Timing Scans for the Barrel: Take 1
Introduction
I have made some changes to the results presented here based upon feedback from the EEMC meeting on Janurary 19th.
The changes are as follows:
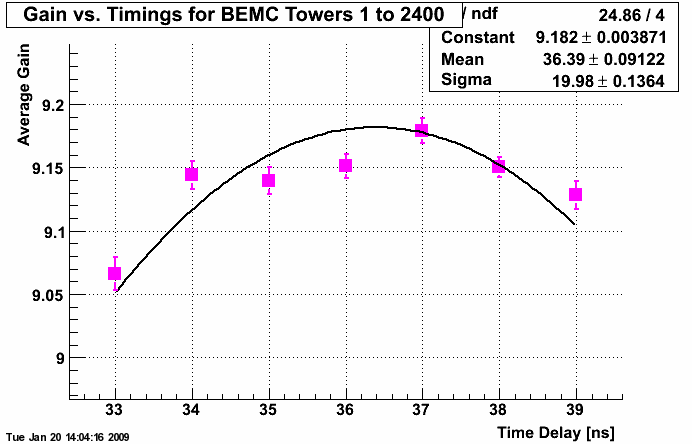
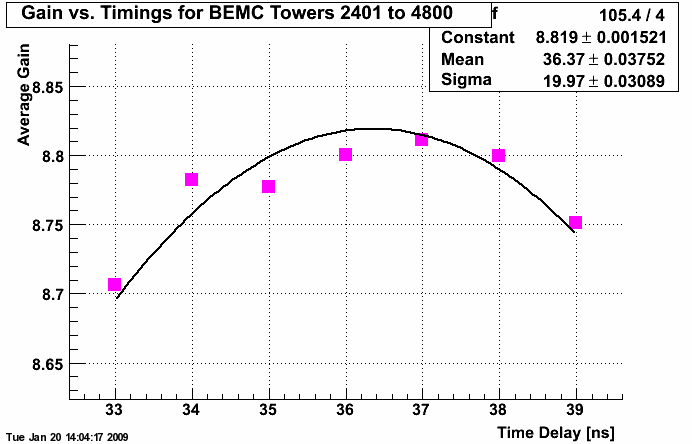
(1)Now plot 1/slope instead of slopes.
(2)Fit with a gaussian instead of a quadratic function.
(3)Towers are now grouped into the 30 crates for the barrel, each with 160 channels.
Also have added some additional information:
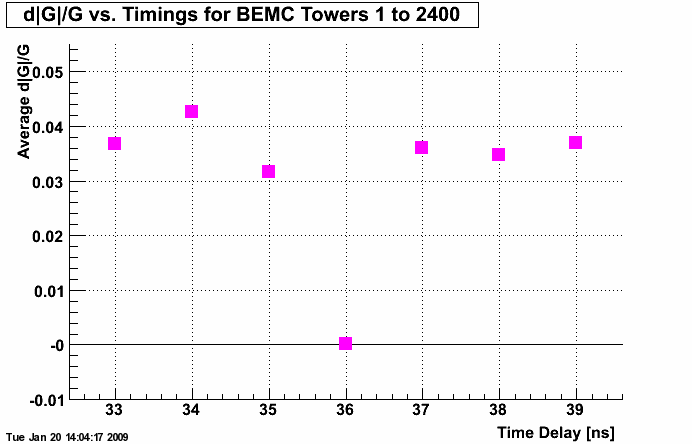
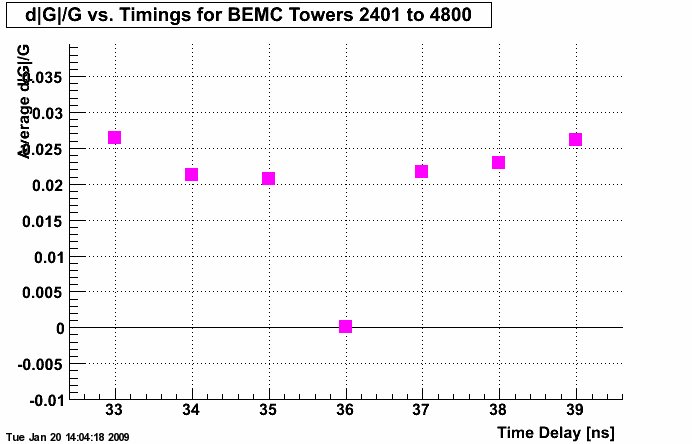
(1)Plots of the gain deviation = |dG|/G at each timing point where the deviation is from the gain at the nominal time delay of 36 ns.
(2)A printout of the gaussian fit results (mean and sigma with fit uncertainties) for each tower's timing curve. Like before I do not include towers where the slope of the ADC spectrum could not be determined to at least 2 sigma. These towers are indicated by values of -999. for the mean and sigma.
Results
The figues below show the 1/slope plots for each half of the barrel.


Below are plots of d|G|/G for each half barrel:


Attachments
As attachements are the same above plots, averaged over each crate. The text file attached gives the fit results for each tower individually.
- aliceb's blog
- Login or register to post comments
