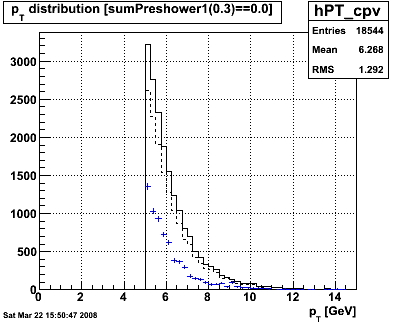
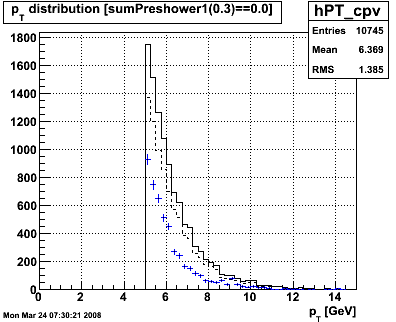
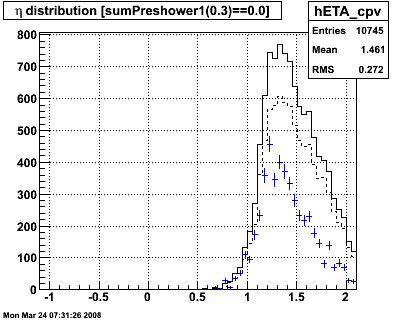
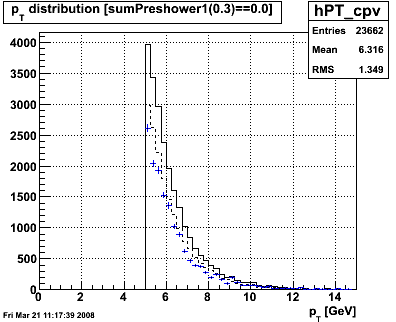
Figure 1.1 -- pT distribution. Black curve indicates all particles which pass the charged-particle veto cut, dashed curve the events which pass the analyzing cuts, and blue points the extracted "gamma" yield. As expected there is a significant increase in yield. However, the purity of the event sample also increases? This can't be right. So let's look at other distributions.
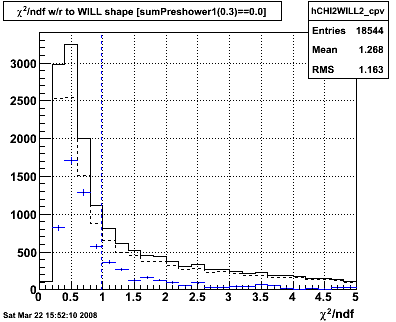
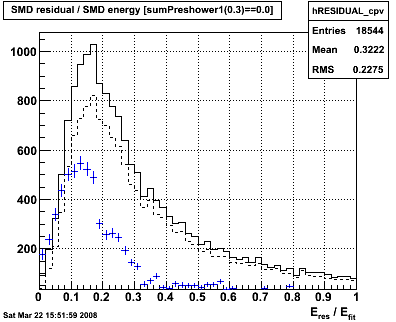
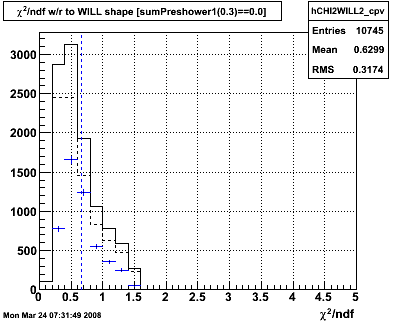
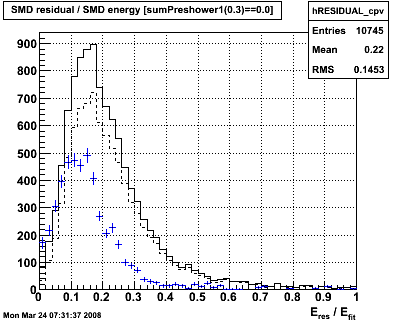
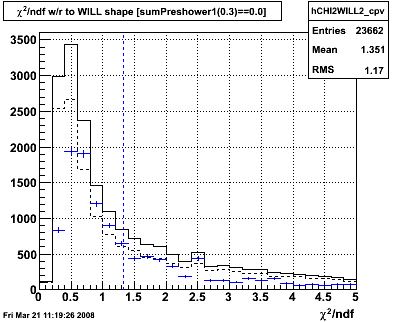
Figure 1.2 -- Chisquare using Will's shower shape (left), and ratio of SMD residual to SMD fit using the "default" lineshape (right). Dashed blue line indicates the mean of the extracted yield. What this indicates is that a large fraction of the "tail" of the chi2 distribution is classified as a single photon yield. Also, that the extraction technique breaks down when there is a small amount of energy outside of the "expected" photon signal in the SMD.
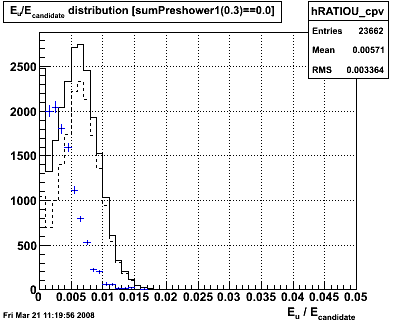
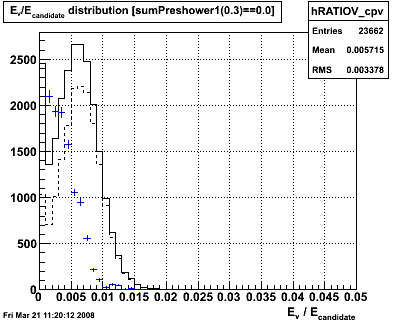
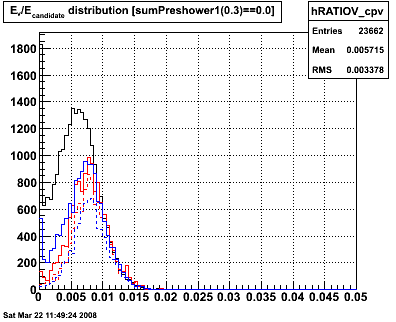
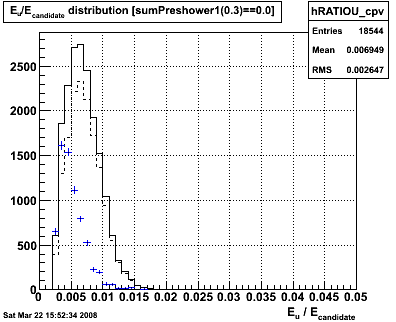
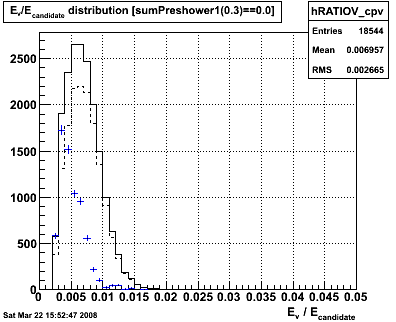
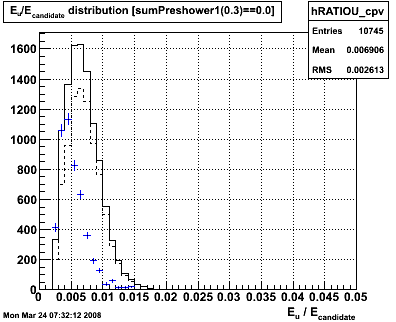
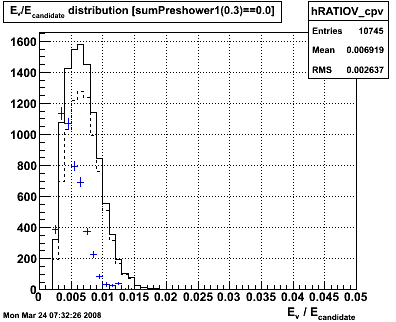
Figure 1.3 -- Ratio of energy deposited in SMD to energy of the gamma candidate. U (left), V(right).
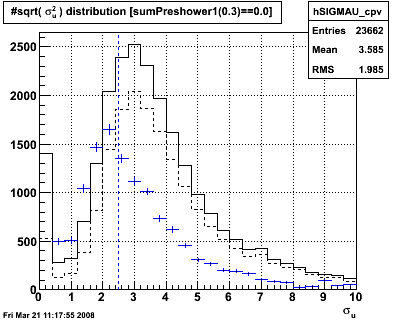
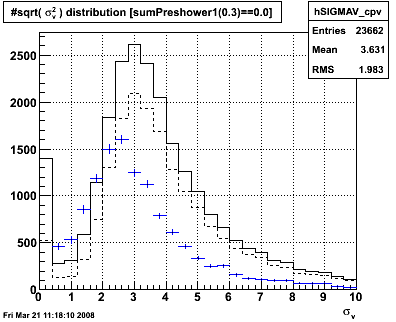
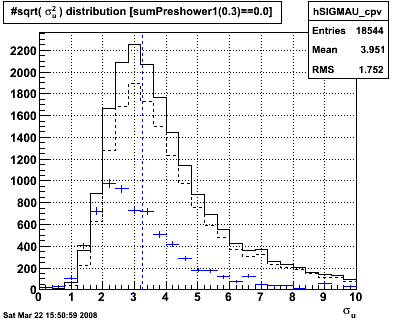
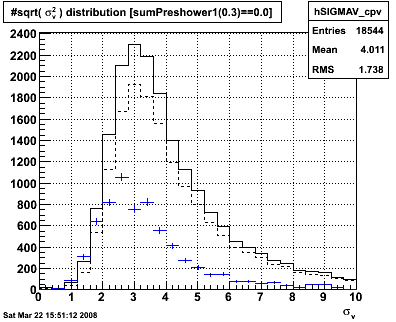
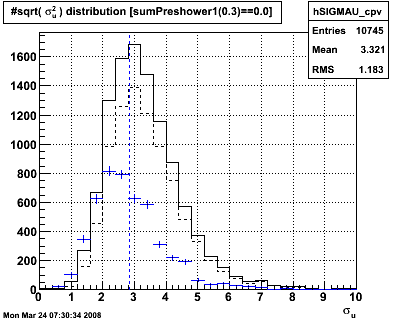
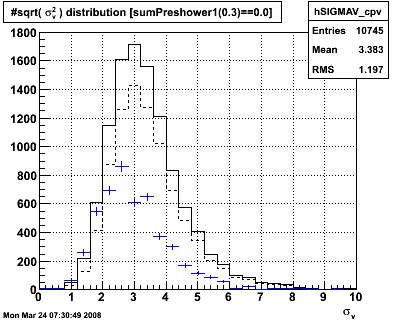
Figure 1.4 -- Width of the SMD distribution. U (left), V (right).
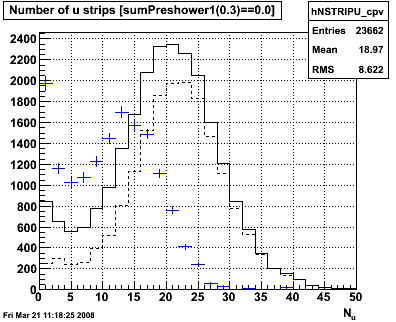
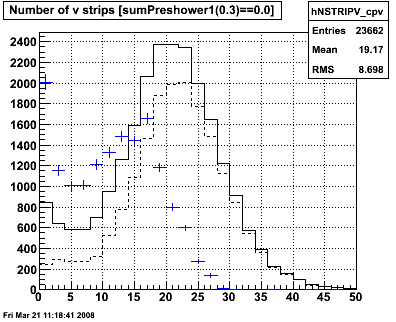
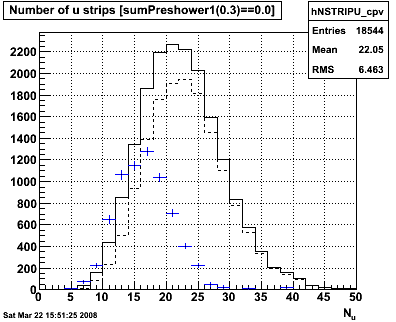
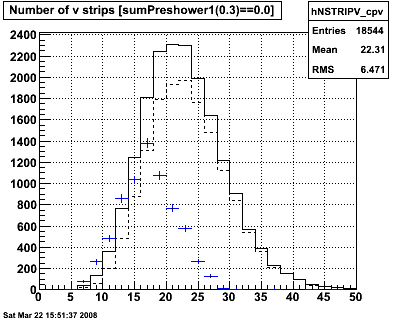
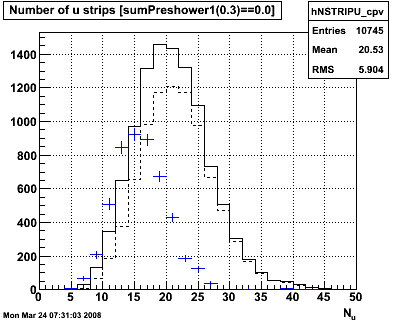
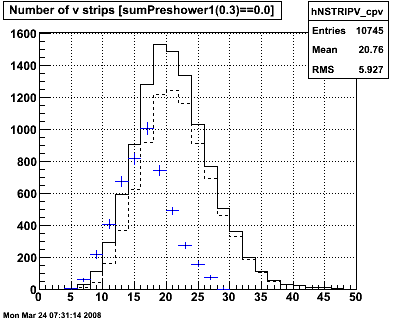
Figure 1.5 -- Number of SMD strips w/ ADC > 3 sigma + ped. U (left), V(right).
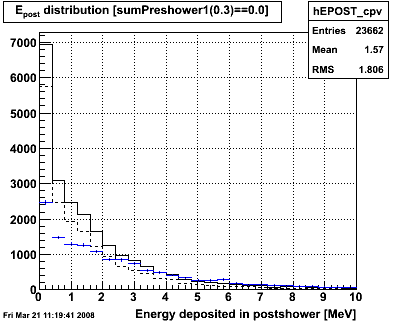
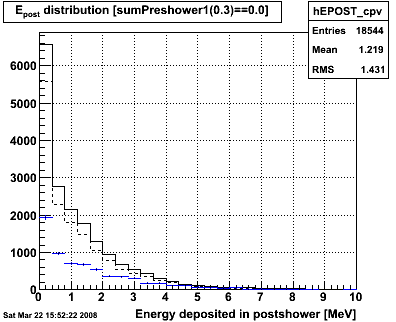
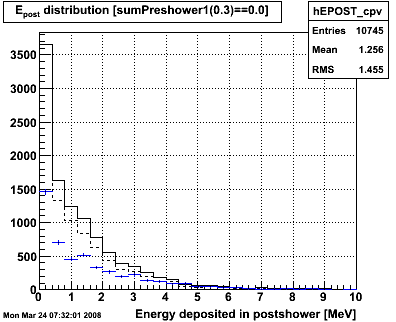
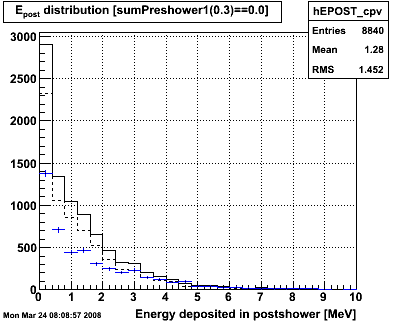
1.6 Energy depostied in the postshower detector.
Observations:
1. When looking at SMD distributions, the extraction method fails when
a. Number of strips are small
b. Amount of energy deposited in SMD is small relative to the gamma candidate
c. The spread in energy deposited in the SMD is small.
2. These features are also observed when the hadronic veto is in place, but to a much smaller degree.
3. These features are all consistent with the expected response for charged hadrons.
It's not clear that we will be able to relax this cut without letting in additional backgrouds. The nature of the background will be looked at in the next section.
2.0 What do events w/ energy > 0.2 MeV in the postshower w/in R < 0.3 of the gamma candidate look like?
Compare:
Cuts (black histograms)
1. Require candidate to be w/in the EEMC with pT > 5.0 GeV.
2. Isolation cut -- ET / ETR<0.3 > 0.9
3. Charged particle veto (solid histograms) -- require sum of all preshower-1 tiles w/in R < 0.3 to be == 0
4. Analyzing cut (dashed histograms) -- sum preshower-2 tiles w/in R < 0.3 is greater than zero (i.e. at least one tile w/ ADC > 3 sigma + ped).
Cuts (red histograms):
1. Require candidate to be w/in the EEMC with pT > 5.0 GeV.
2. Isolation cut -- ET / ETR<0.3 > 0.9
3. Hadronic cut -- sum all postshower tiles, require sum > 0.2 MeV
4. Charged particle veto (solid histograms) -- require sum of all preshower-1 tiles w/in R < 0.3 to be == 0
5. Analyzing cut (dashed histograms) -- sum preshower-2 tiles w/in R < 0.3 is greater than zero (i.e. at least one tile w/ ADC > 3 sigma + ped).
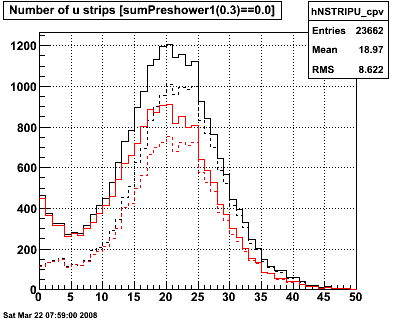
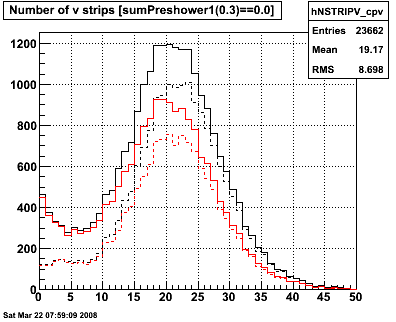
Figure 2.1 -- Number of SMD strips w/ ADC > 3 sigma + ped which survive the CPV cut (solid line) and the analyzing cut (dashed line). The red lines indicate events with total energy deposit > 0.2 MeV in the postshower w/ in R < 0.3 of the gamma candidate.
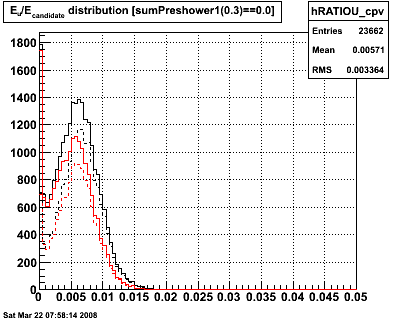
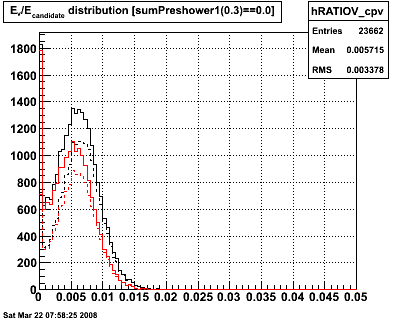
Figure 2.2 -- Ratio of energy deposited in SMD to energy of the candidate. Events which survive the CPV cut (solid line) and the analyzing cut (dashed line). The red lines indicate events with total energy deposit > 0.2 MeV in the postshower w/ in R < 0.3 of the gamma candidate.
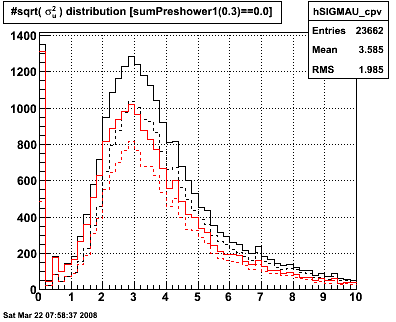
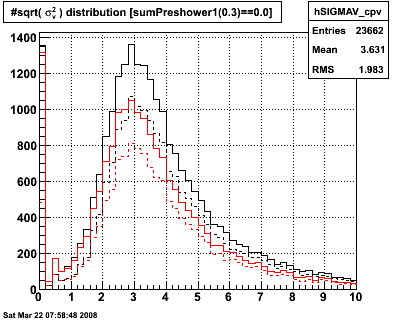
Figure 2.3 -- Width of energy deposited in the SMD plane. Events which survive the CPV cut (solid line) and the analyzing cut (dashed line). The red lines indicate events with total energy deposit > 0.2 MeV in the postshower w/ in R < 0.3 of the gamma candidate.
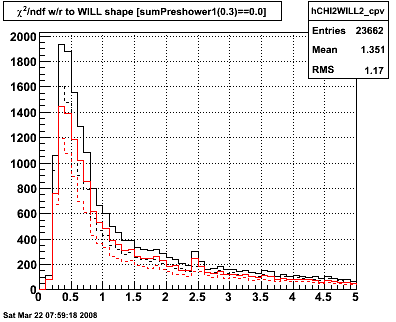
Figure 2.4 -- Chi2/ndf w/ respect to Will's photons.... usual solid/dashed/black/red convention.
note: there's an interesting "glitch" at 2.5 in the chi2 figure.
The gamma candidates with large postshower energy deposition appear to have essentially the same distributions as the rest of the events, modulo the fact that more candidates show up in regions where we suspect hadronic backgrounds. Is there anything that we can learn from the Monte Carlo?
3.0 Guidance from the Monte Carlo
While the Monte Carlo's description of the transverse shower shape is suspect, we should hope that it gets the longitudinal development of the showers correct. So, I look at a generated event sample as described
here, and make some figures...
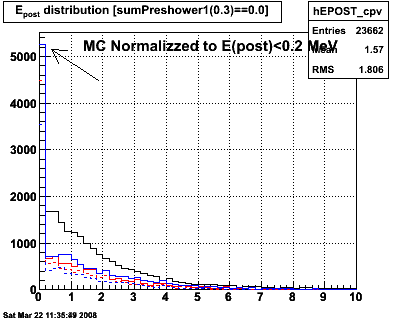
Figure 3.1 -- Comparison between the postshower energy distributions for data (black line), MC gammas (blue lines) and MC pi0 decays (red lines) for events which satisfied the CPV cut (solid) and the analyzing cut (dashed). The normalization of the two MC samples has been chosen such that the number of events matches the data for E(post) < 0.2 MeV. There is a clear excess of events surviving cuts in the data for larger energy deposits.
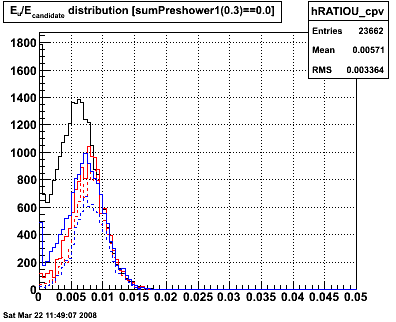
Figure 3.2 -- Ratio of energy deposited in SMD beneath gamma candidate to the energy of the gamma candidate. Same conventions as before. The nromalization of the MC to the data is done the same way, i.e. equalizing the number of events with E(post) < 0.2. This indicates that the events with large E(post) deposits tend to deposit less energy in the SMD (for the same energy gamma candidate) than we would expect for either single photons or pi0 --> 2 gamma events.
Have we learned anything useful here? I think so. When normalized to the number of gamma candidates whose showers are "contained" within the EEMC (i.e. no postshower energy), the ratio of energy deposited at SMD to the energy of the gamma candidate looks to be reasonably modeled. At least the distributions have the same behavior for larger Esmd/Ecandidate.
The agreement between the data and MC for the tail at higher Esmd/Ecandidate is remarkable. However the data shows a clear excess below ~0.008 or so. This is to say that the data contains neutral particles which deposit less energy w/in the SMD per energy deposited in the calorimeter stack than we expect for photons (either singly or in pairs). This may indicate a neutral hadron background... we should cross check results w/ full geant simulation.
Alternatively this could indicate issues with the absolute calibration of the SMD.
Next try cutting on this variable.
4.0 Extraction after applying a cut, requiring E(smd)/E(candidate) > 0.0025 in each SMD plane.
Cuts:
1. Require candidate to be w/in the EEMC with pT > 5.0 GeV.
2. Isolation cut -- ET / ETR<0.3 > 0.9
3. Test cut: Eu / Ecandidate > 0.0025 and Ev/Ecandidate > 0.0025
4. Charged particle veto (solid histograms) -- require sum of all preshower-1 tiles w/in R < 0.3 to be == 0
5. Analyzing cut (dashed histograms) -- sum preshower-2 tiles w/in R < 0.3 is greater than zero (i.e. at least one tile w/ ADC > 3 sigma + ped).
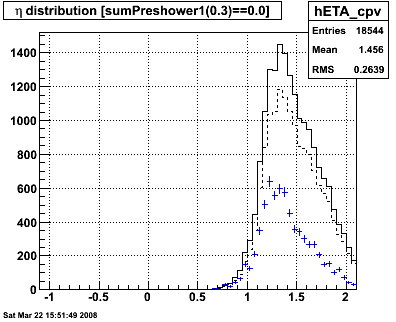
Figure 4.1 -- pT (left) and eta (right) distributions. As usual, events which pass the CPV cut (solid) and analyzing cut (dashed) are shown along with the extracted gamma yield (blue data points). Error bars only show the statistical uncertainty in the yield. The yield integrates to 6800 events.
Observations:
1. Yield does not fall off so quickly with increasing eta.
2. This is one of the benefits to releasing the postshower cut. Due to the angle of incidence, gammas "see" more material between the first and last layer of the endcap at eta = 1 than at eta = 2. Therefore, a gamma will be more likely to range out in the calorimeter stack at eta = 1 than a gamma w/ equal energy at eta = 2. Therefore at eta = 2, the gamma will deposit more energy in the postshower (when it deposits any).
3. I am starting to notice a trend. Specifically, where I have a cut or where the acceptance falls off as in the eta distribution, there is frequenly an increase in purity near the cut. More on this below....
Figure 4.2 -- Chi2 (left) and residual (right) distributions.
Observations:
1. The residual distribution looks much more sensible. The extracted yield is w/in uncertainties of the maximum possible yield... this may still indicate an issue (i.e. it implies that the sample is 100% pure for E(res) / E(fit) < 0.08 or so... which may or may not be reasonable). But it's clearly not failing.
2. The chi^2 distribution looks better as well. We don't identify stuff out in the tail as a highly-enriched gamma sample as was the case in figure 1.2.
3. There is still quite a bit of "cleanup" which can happen. A chi^2/ndf cut < 1.5 should knock down ~5k background events w/out touching the gamma yield.
Figure 4.3 -- SMD energy ratios. This is the quantity which we cut on.
Observations:
1. Well, it should be improved because we cut on it. The extraction is at least self-consistent. Beyond that I don't think I can make anything of this plot. Other than I expect, as the purity of the event sample improves, we should see something like figure 3.2 emerge.
2. ... as I said previously, I'm starting to get worried about distributions like this... I've applied a cut at Esmd/Ecandidate of 0.025. Immediately to the right of that cut, we have 100% (even slightly better) purity. I think this is just reflecting that there's a source of background which isn't properly treated by the efficiencies. I think that it's still useful to proceed. There are additional and reasonable cuts (i.e. chi^2) which may help to remove these backgrounds.
Note: on further reflection, this is becoming less of a concern for me. It should be the case that, as we apply tighter cuts, the event sample will become more purely single photons. There should be regions in plots like this which indicate more highly enriched gamma samples. So as a general rule, seeing that the photon yield takes up a large fraction of the number of events passing the CPV cut is not necessarily a bad sign.
For this particular plot, however, I remain concerned. The concern is that the distribution of photons deviates significantly from what we see in the Monte Carlo. This suggests that the background estimate may be off.
Figure 4.4 -- Width of the SMD distribution. U (left), V (right).
Observations:
1. The width is much better behaved. No more "0-width" candidates. Mean width of the extracted gamma yield is also reasonable.
Figure 4.5 -- Number of SMD strips w/ ADC > 3 sigma + ped. U (left), V(right).
Observations:
1. Much better behaved... no more "0-strip" candidates.
2. We certainly expect our gammas to deposit energy in at least 5 strips. They do now.
3. We are still above the total yield for smaller numbers of strips firing.
Figure 4.6 -- Energy deposited in the postshower detector.
Observations:
1. For events below 0.4 MeV deposited, S/B is about 1:3. This holds out to ~1.5 MeV, where the ratio grows to about 1:2.
2. It's reasonable to expect pi0's to range out before gammas do, since they split their energy between two showers vs one shower for the prompt gamma.
3. Somehow this strikes me as incompatible with the MC, and figure 3.1. Maybe the binning differences are confusing the issue somewhat, but I would expect a larger drop between the first and second bins in this plot if the MC is to be believed.
Next step, apply a chi^2/ndf cut at 1.5.
5.0 Apply a chi^2 cut, chi^2/ndf < 1.5, and extract yields
Cuts:
1. Require candidate to be w/in the EEMC with pT > 5.0 GeV.
2. Isolation cut -- ET / ETR<0.3 > 0.9
3. Test cut: chi2/ndf < 1.5 and Eu / Ecandidate > 0.0025 and Ev/Ecandidate > 0.0025
4. Charged particle veto (solid histograms) -- require sum of all preshower-1 tiles w/in R < 0.3 to be == 0
5. Analyzing cut (dashed histograms) -- sum preshower-2 tiles w/in R < 0.3 is greater than zero (i.e. at least one tile w/ ADC > 3 sigma + ped).
Figure 5.1 -- pT and eta distributions
Observations:
1. Mainly just a loss of statistics.
Figure 5.2 -- chi2/ndf and residual / fit yield distributions
Observations:
1. We cut on chi^2/ndf at 1.5. We still have some improvement which can be made by cutting on the residual distribution.
Figure 5.3 -- SMD energy to tower energy ratio
Observations:
1. SMD energy ratio distribution remains basically untouched.
2. Events with high chi^2 are not associated with the excess number of events which show up with low Esmd/Ecandidate. Therefore shower-shape discriminants may have difficulty with this "background". I use quotes around "background", because it's possible that SMD calibrations may be smearing out this distribution more than is accounted for in the MC.
Figure 5.4 -- SMD width distributions
Observations:
1. Widths of the SMD distributions continue to look more photon-like.
2. The extracted photon yields are showing a narrower distribution as a result of the chi^2 cut. This is to be expected.
Figure 5.5 -- Nstrip distributions
Observations:
1. Nothing much to say about this.
Figure 5.6 -- Postshower energy deposit
Observations:
1. The ratio of N(gammas) / N(CPV) appears to be somewhat constant out to 2-3 MeV. Starts at 2:1, varies by ~ +/-50%.
6.0 Apply a cut on the residual E / fit E in the SMD
We continue to see the same types of changes in the spectra as when we applied the chi^2 cut.
Cuts:
1. Require candidate to be w/in the EEMC with pT > 5.0 GeV.
2. Isolation cut -- ET / ETR<0.3 > 0.9
3. Test cut: Eresidual/Efit<0.30 and chi2/ndf < 1.5 and Eu / Ecandidate > 0.0025 and Ev/Ecandidate > 0.0025
4. Charged particle veto (solid histograms) -- require sum of all preshower-1 tiles w/in R < 0.3 to be == 0
5. Analyzing cut (dashed histograms) -- sum preshower-2 tiles w/in R < 0.3 is greater than zero (i.e. at least one tile w/ ADC > 3 sigma + ped).
Figure 6.1 -- pT and eta
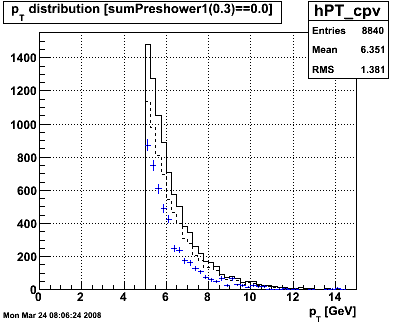
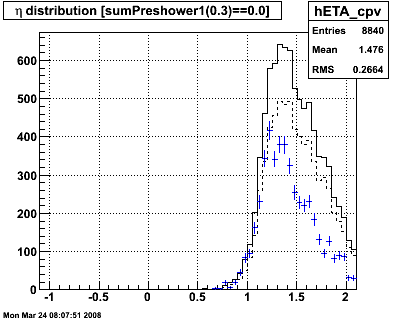
Figure 6.2 -- chi2 and resiude
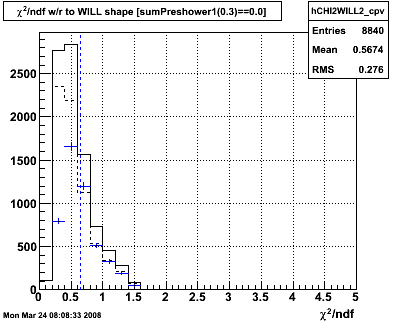
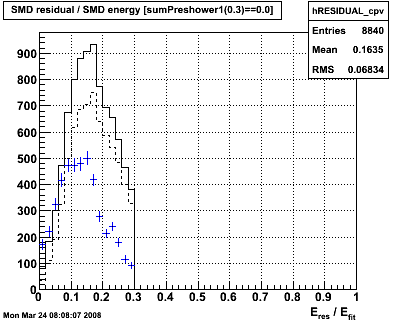
Figure 6.3 -- SMD energy ratios
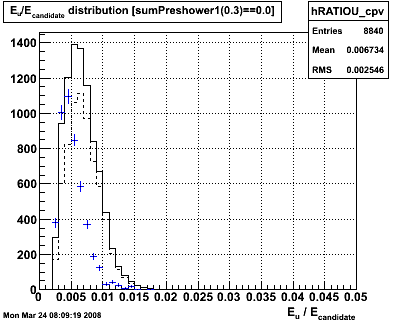
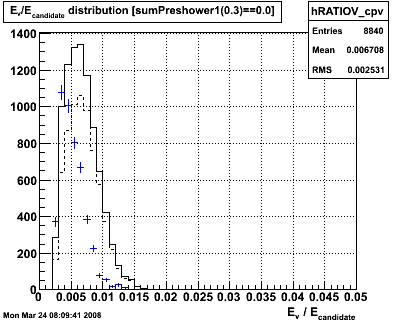
Figure 6.4 -- widths in SMD
Figure 6.5 -- N strips
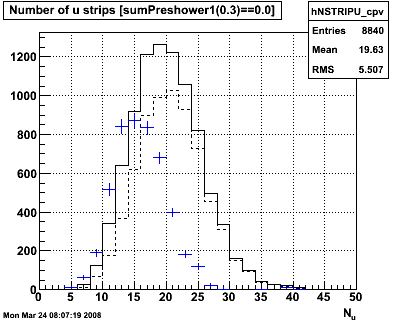
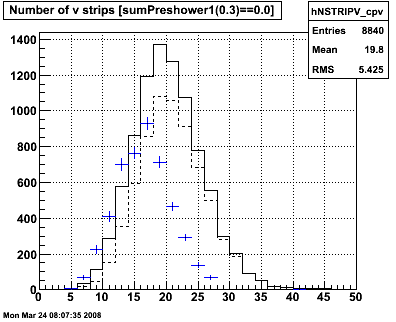
Figure 6.6 -- Postshower energy deposit
7.0 Results and Conclusions
.png)