2006 Calibration Uncertainty
Adam, Alan, Mike, and I have been working on reducing the uncertainty on the BTOW Calibration for 2006.
Our initial task outline of the problem and proposed course of action can be found here: http://drupal.star.bnl.gov/STAR/subsys/bemc/calibrations/run6/btow/calibration-uncertainty-calculation. It was discussed and approved at the EMC meeting on Monday, March, 30, 2009.
The first round of work was outlined in http://drupal.star.bnl.gov/STAR/blog-entry/kocolosk/2009/apr/06/calib-uncertainty-update.
A new set of calibration trees was created to be able to study isolation and trigger effects in better detail. We have come to the conclusion of that analysis.
We made a set of cuts to make the sample as unbiased as possible. No energy leakage correction is applied.
List 1:
- 3.5 < dEdx < 4.5
- abs(vertexZ) < 30
- 1.5 < p < 15 GeV
- dR (from tower center to track projection) < 0.004 (in units of deta,dphi)
- tower_id == tower_id_exit of projection
- Energy of highest neighbor < 0.5 * track energy
The following plot shows p vs. E/p for tracks in HT or HTTP events. There is a clear sculpting in the region around the trigger threshold.
Figure 1:
.png)
We can remove these tracks, which results in the following figure that includes only tracks from events that were not HT/HTTP events.
Figure 2:
.png)
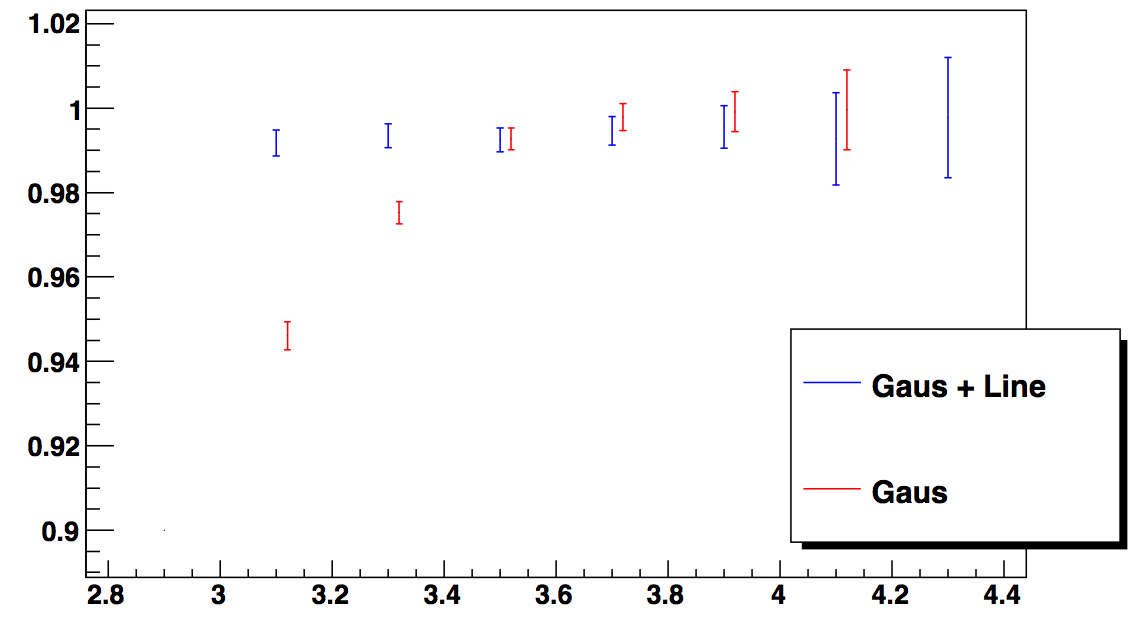
By projecting this plot we can fit using a gaussian + pol1 as discussed in the previous page to find the mean E/p. The following plot has the mean E/p with statistical errors for four different scenarios. If we make slices in p, we can see the E/p has no dependence.
Figure 3:
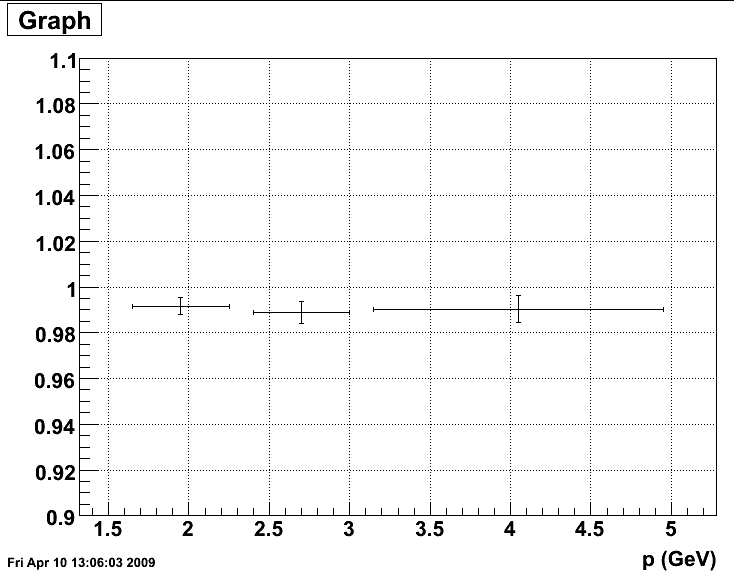
Figure 4:
.png)
Point 1 of this plot corresponds to tracks passing the cuts in List 1, including tracks from all triggers. As expected, it falls right at 1, since it closely resembles the cuts used for the original calibration.
Point 2 of this plot adds the requirement that the tracks did not come from a HT or HTTP event.
Point 3 of this plot has the requirement that tracks did come from a HT or HTTP event.
Point 4 of this plot has the requirement that tracks did come from a HT or HTTP event, put have the tracks in the trigger turn on region removed: 4.5 < p < 6.5 GeV.
Conclusion
Based on this analysis, the overall calibration uncertainty is at the 1.3 % level (the max of the difference between points 1 and 3 and the statistical uncertainty on 1 or 3).
We will also quote a crate by crate systematic uncertainty when the analysis is complete.
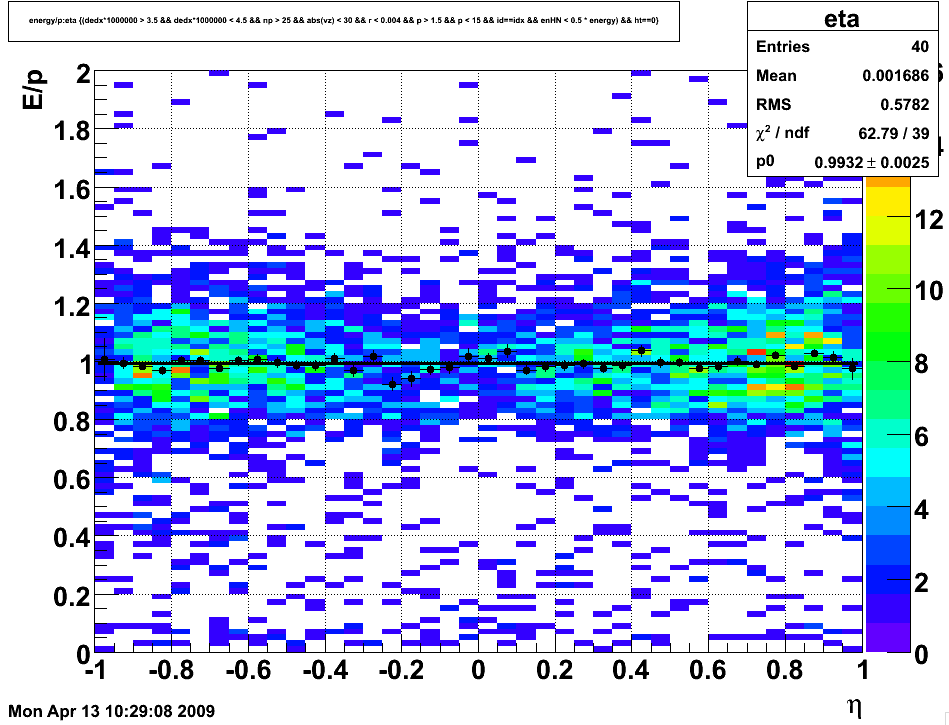
There is no eta dependence.
Figure 5:
Update: We did some more examination of the eta dependence and the results can be found here: http://drupal.star.bnl.gov/STAR/node/14147/
Here are some of the previous plots created with the latest trees and cuts to confirm our choices for the various cuts.
Figure 6 (shows E/p flat at low dR):
.png)
Figure 7 (showing the removal of background):
- mattheww's blog
- Login or register to post comments