Space Charge Distribution with New Acceptance Cuts
We saw that the our power fit (r^-N) for the charge distribution had a increasing magnitude of N as luminosity decreased. We also saw that our plots of charge distribution with the power fit subtracted had excess charge near dead regions of the TPC. There was also the possibility that the excess charge was being produced by acceptance edge effects and/or other errors in the acceptance plots.
Since each sector spans 30 degrees, Gene modified the code to exclude 3 degrees on each side of the sectors in an attempt to reduce acceptance edge effects. This means each sector will use only 3 to 27 degrees. Overall, we see that the excess charge is decreased as compared to our initial results, but there are still some areas of excess charge, and the magnitude of N still increases in a similar trend.


The chisquared/ndf values are larger than the original attempt, but this is most likely due to smaller N values since in the plots we see the larger the N the smaller the chisquared/ndf. Since we make no attempt at computing the error, we can only look at the trend, which matches the same trend as seen previously.
The following plots are the charge distribution with the howfit subtracted from it, for all acceptances:
Run 13077066

Run 13077068
Run 13077073

Run 13077076

Run 13077081

Run 13078001

Run 13078006

Run 13078014 (All, West, East)


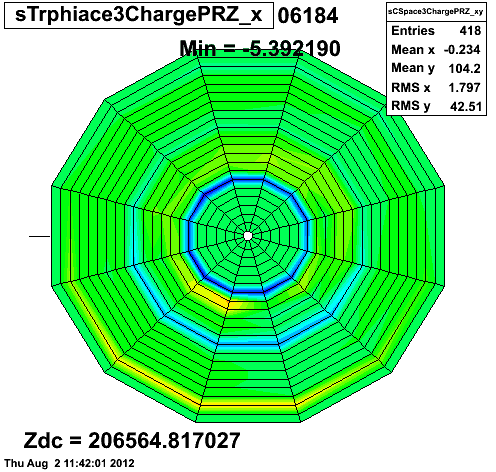
Acceptance Plots:


- dgarand's blog
- Login or register to post comments