- drach09's home page
- Posts
- 2022
- 2020
- June (1)
- 2019
- 2018
- 2017
- 2016
- 2015
- 2014
- December (13)
- November (2)
- October (5)
- September (2)
- August (8)
- July (9)
- June (7)
- May (5)
- April (4)
- March (4)
- February (1)
- January (2)
- 2013
- December (2)
- November (8)
- October (5)
- September (12)
- August (5)
- July (2)
- June (3)
- May (4)
- April (8)
- March (10)
- February (9)
- January (11)
- 2012
- 2011
- October (1)
- My blog
- Post new blog entry
- All blogs
Run-11 Transverse Jets: JP2 (High) Embedding (Azimuth and Transverse Momentum Resolutions)
Transverse Momentum Resolution
One question of importance is by how much to shift the reconstructed jet pT to obtain the particle or parton-jet pT. One way to obtain this estimate is to look at the difference in reconstructed and thrown pT in embedding. Another is to examine the true pT distribution of jets reconstructed in a particular pT bin. In the end the latter is probably the path I will pursue.
In the present case, I have matched reconstructed jets to "parton" jets. "Thrown" pT is the pT of the "parton" jet. The thrown pT distributions are quite asymmetric. To estimate the mean and σ I have fit the distributions with a skew normal distribution:
The mean and width are then calculated by
and
To estimate the errors on the mean and width I have only taken the uncertainties on the first fitted parameter in each expression, as there is undoubtedly some correlation between the parameters which would be difficult to isolate for proper error propagation.
For the two of the three highest pT bins I have fixed the α parameter to be zero. The fitting was returning α's within 1σ of zero for these bins; and to get a sensible error it was simpler to fix the α parameters in the three relevant bins.
As a reminder, I use pT bins defined as
const double xbins[nbins+1] = { 5.0, 6.0, 7.1, 8.4, 9.9, 11.7, 13.8, 16.3, 19.2, 22.7, 26.8, 31.6, 37.3, 45., 55., 65., 80., 100., 250. };
Figure 1
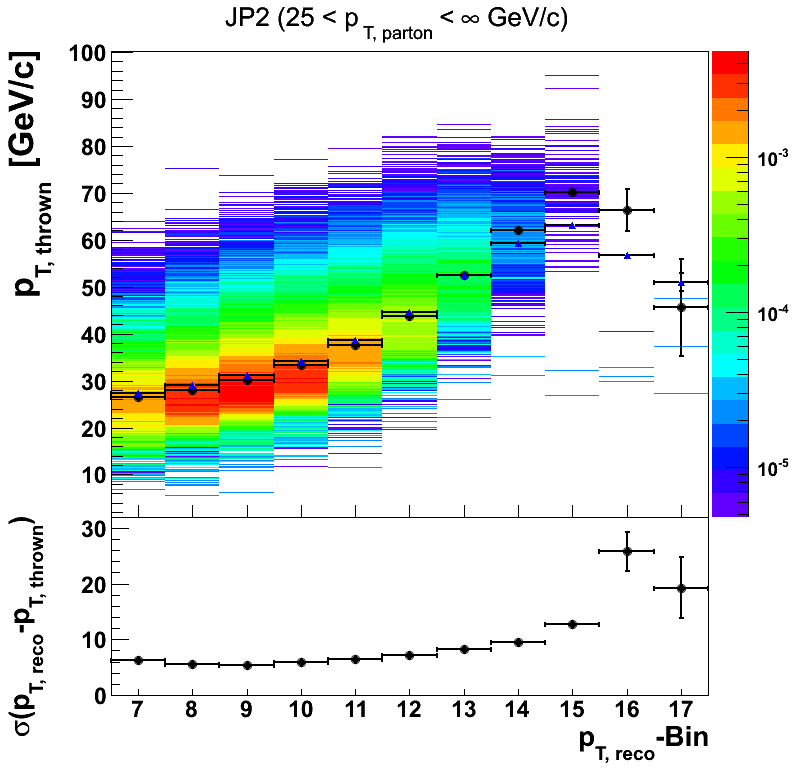
The fitted means are plotted in black circles, while the simple arithmetic mean from the histograms is plotted in blue triangles. For lower pT, the values are quite similar, deviating slightly at the three highest pT bins. The resolutions dip from bin-7 to bin-9, likely, a reflection of the lack of lower partonic-pT bins. I expect all of the means will shift lower from the "rolling downhill" effect when the low-partonic-pT embedding is included. The two highest pT bins appear to be rather thoroughly dominated by misreconstructed jets. It may, thus, make sense to consider excluding these bins from subsequent analysis. For reference, attached to this blog are plots from the individual fits.
Figure 2
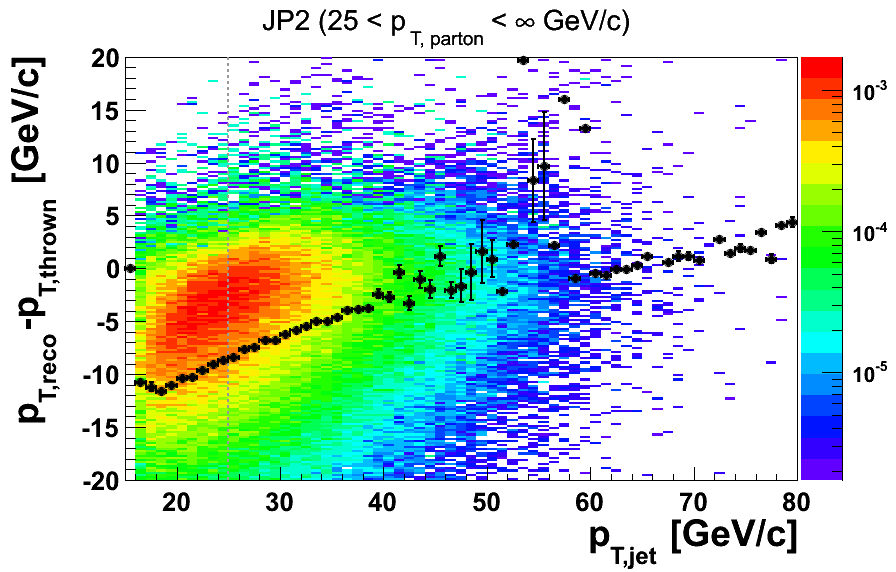
It is also interesting to consider the pT shifts event-by-event. For a reference, Fig. 2 shows the δpT vs. pT, reco with the arithmetic means of the bins plotted as black circles. One can see that the means fall below 0 until rather high pT.
Figure 3
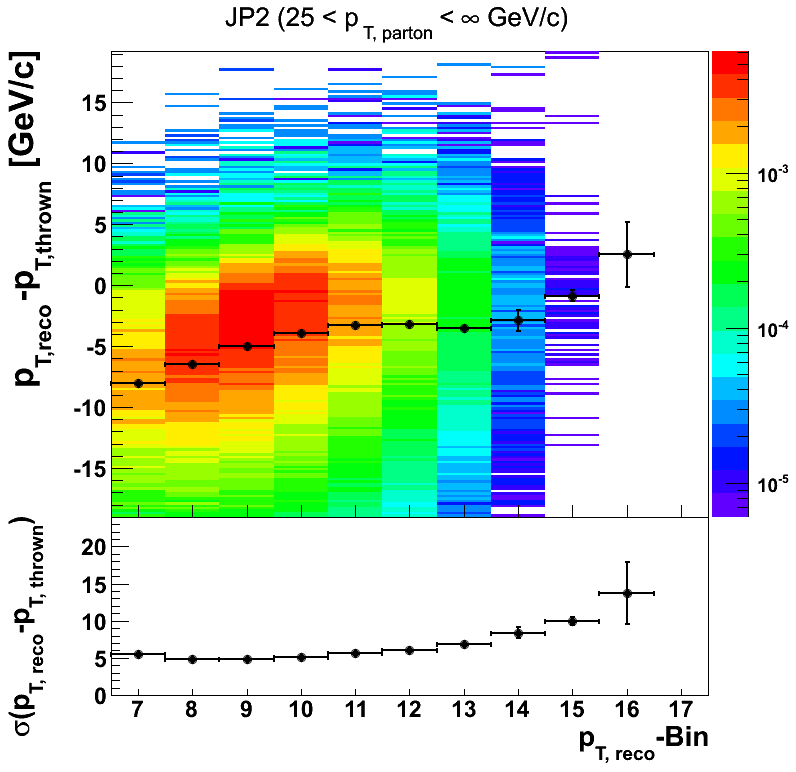
Figure 3 shows δpT vs. pT, reco-bin using the skew normal fitting and related definitions of mean and width, now for δpT rather than pT, thrown. One sees the resolution degrading at higher pT. Additionally, one sees δpT trend more positive with higher pT.
Azimuthal Resolution in η-Bins
In a Sivers measurement it is crucial to have reliable azimuthal resolution. Our detectors tend to have good resolution in azimuth, but it is good to confirm in embedding that there are no surprises, here. Additional checks can be made in data, e.g. using weighted events to verify the absence of significant distortion from finite binning coupled to non-uniform acceptance.
To estimate the resolution in φ I have separated matched jets into bins of reconstructed η, φS, and pT. For a first look, I integrate over φS and examine δφS as a function of pT, reco. Within bins of pT I fit the distribution of δφS with a Gaussian. The figures show the extracted centroids and σ's. I have attached PDF files of the individual fits. The χ2 of the fits is not very good, but in general the distributions do appear to be fairly Gaussian in shape.
One concern in investigating resolutions in this method is whether or not the sigma; of the fit sufficiently accounts for the resolution degredation, e.g. at the base of the peak, where the distribution is no longer Gaussian. In my dissertation I simply used the RMS of the distribution. Given that, now, I have substantially more data, perhaps the RMS approach is not the most efficient.
φS-Resolution vs. pT-Bins
Figure 4: -1 < η < -0.5
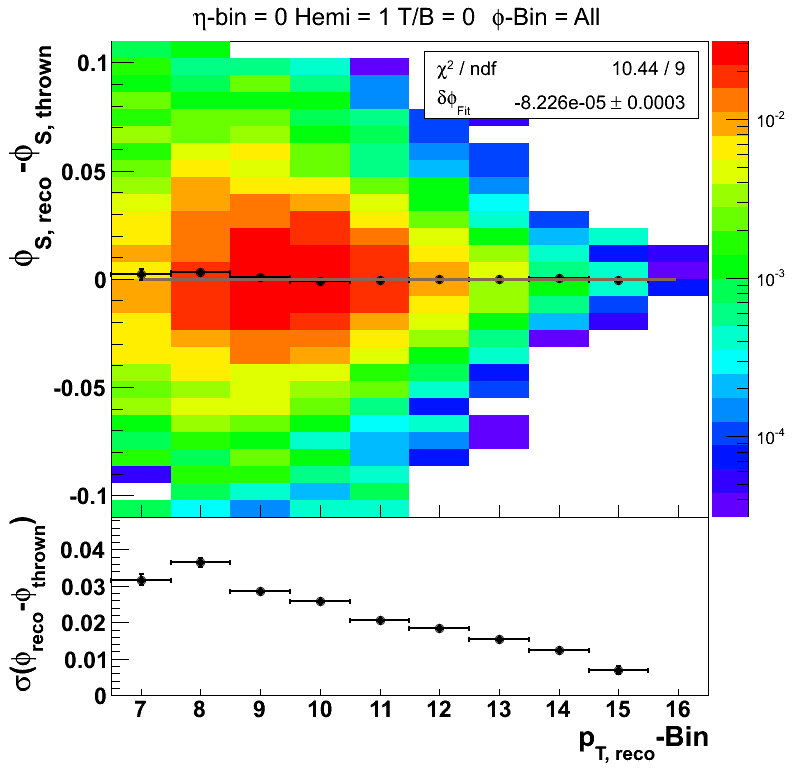
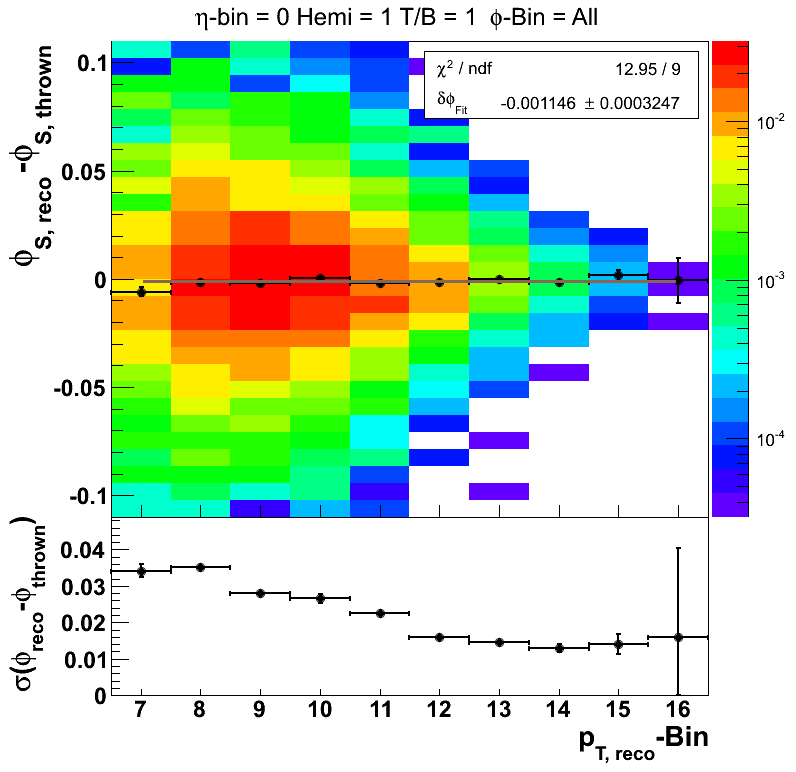
Figure 5: -0.5 < η < 0
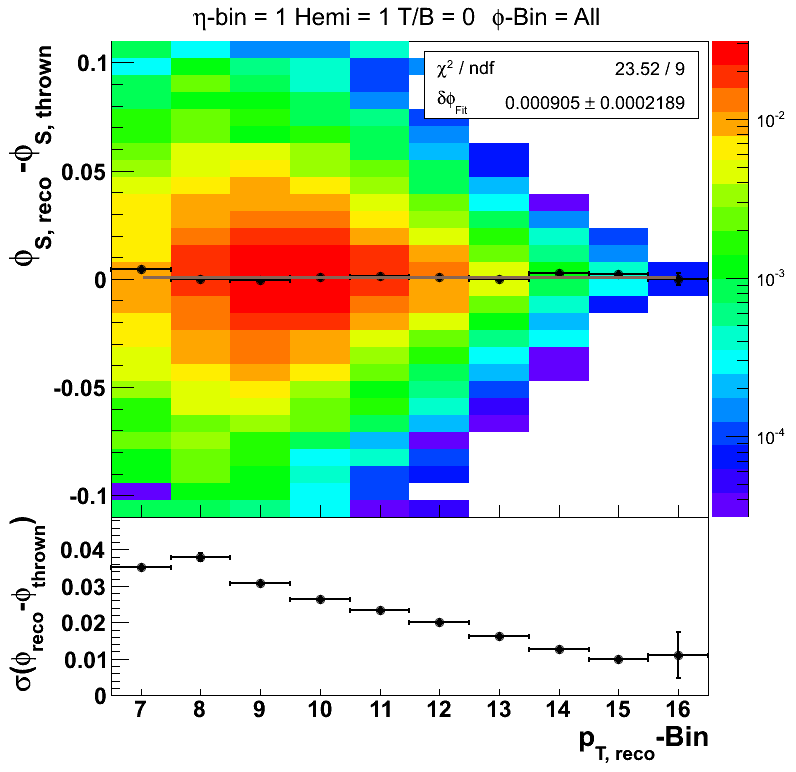
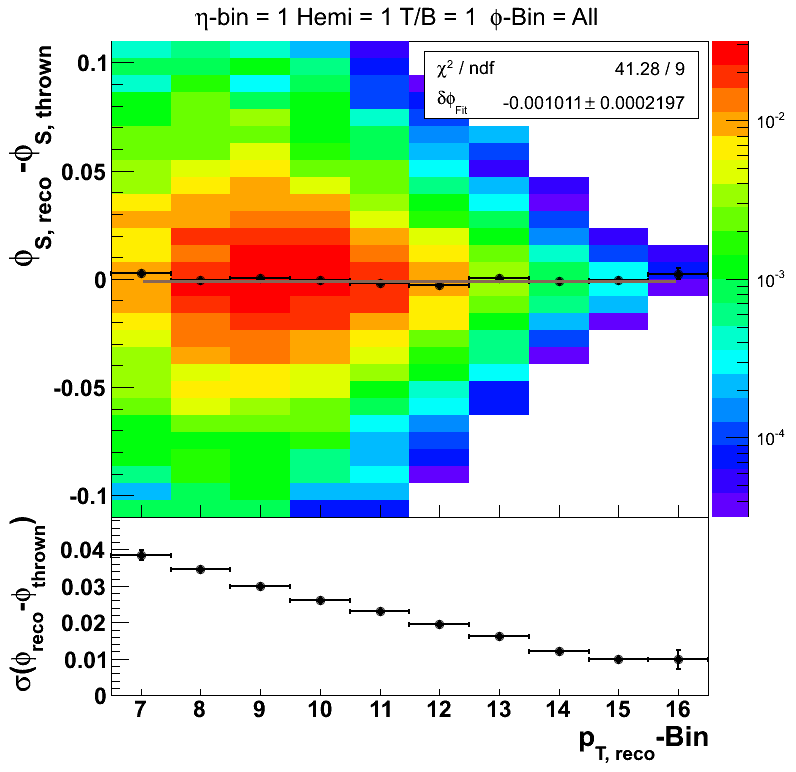
Figure 6: 0 < η < 0.5
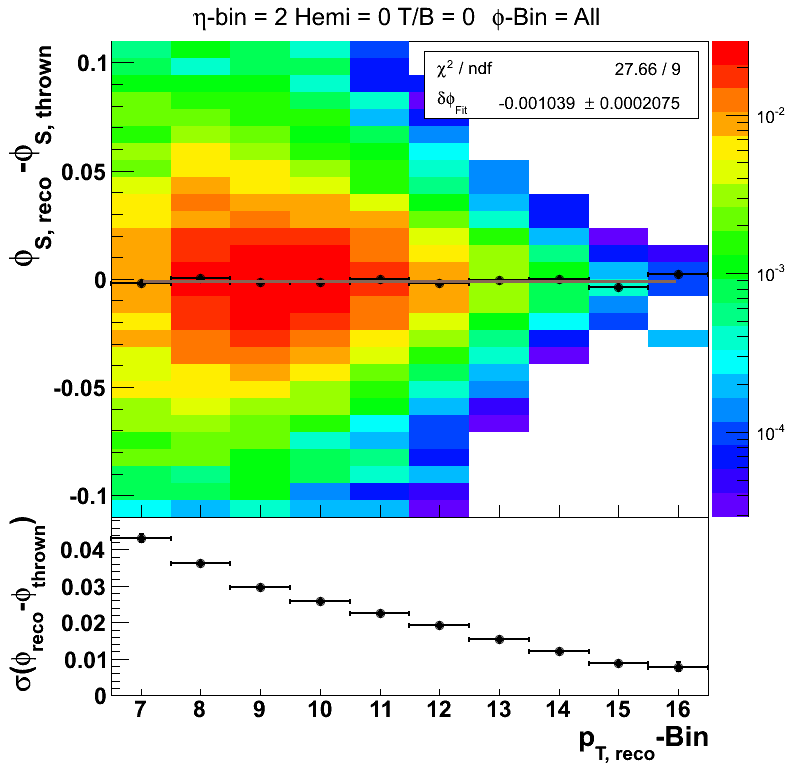
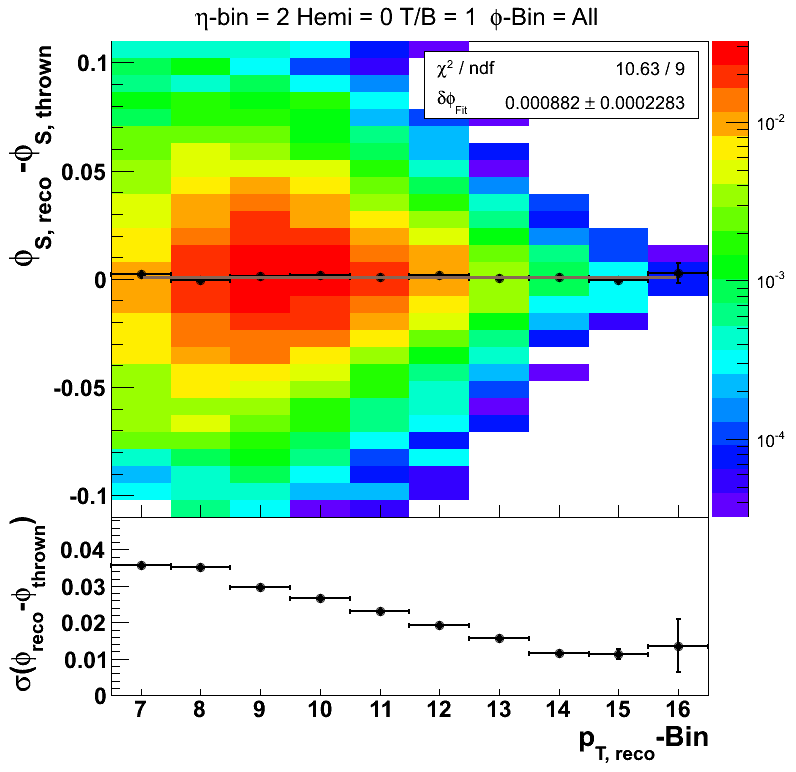
Figure 7: 0.5 < η < 1
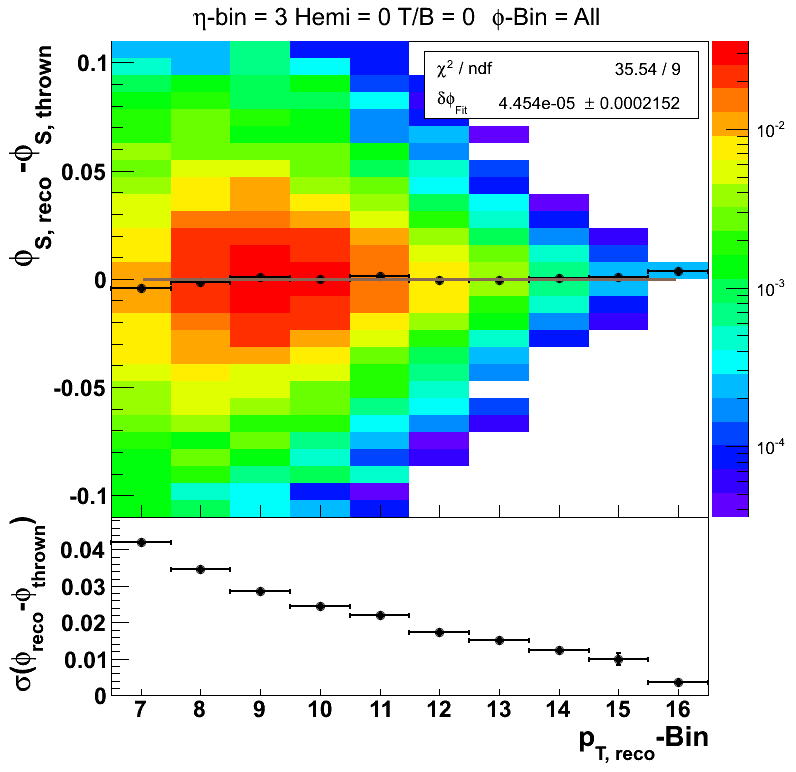
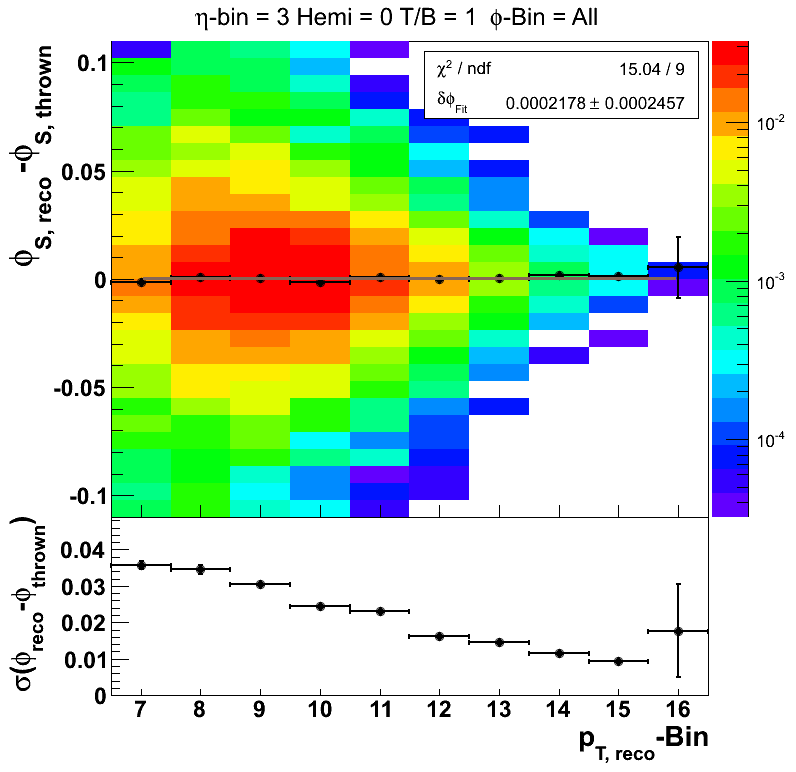
The figures show centroids fluctuating around zero across all pT-bins. The χ2 values tend to indicate that the uncertainties are under-estimated, however, the fitted values are quite small with flucutations within 0.01 radians. The σ's tend to start out around 0.04 at the lowest pT bin and decrease steadily with high pT. This is not so surprising as the tracks tend to become straight-lines at high pT. For high-pT jets, the limiting factor is thus the track pT resolution rather than the φS resolution.
φS-Resolution vs. φS-Bins
It is also worthwhile to examine the azimuthal resolution in bins of the Sivers angle. Large fluctuations could indicate an acceptance effect. Such a study could complement and inform the data-driven analysis of weighting histogram yields to observe finite binning coupled to non-uniform distribution within the bins. As an overview I post figures of the azimuthal resolution integrated over pT.
Figure 8: -1 < η < -0.5
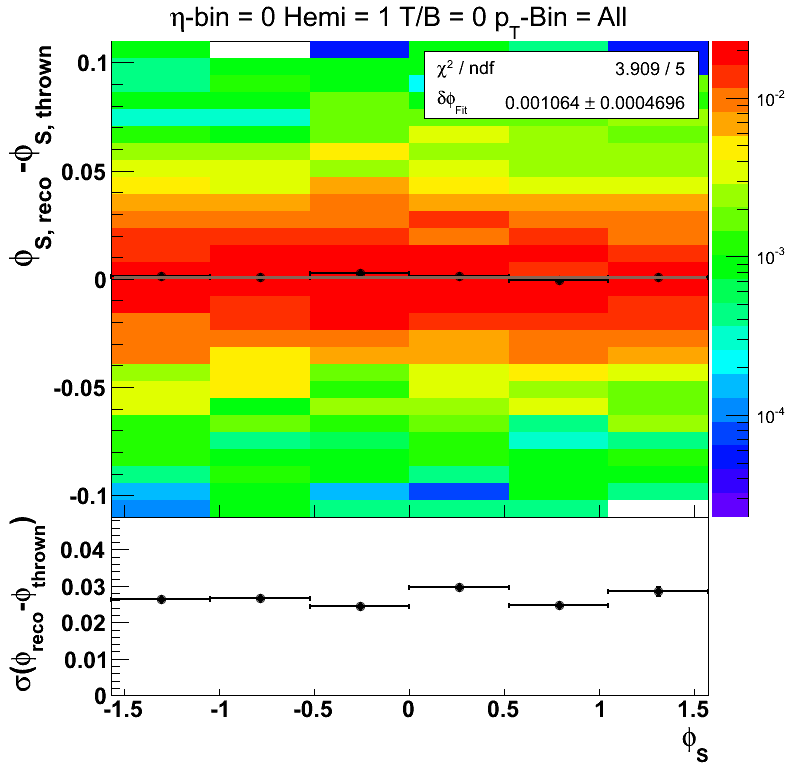
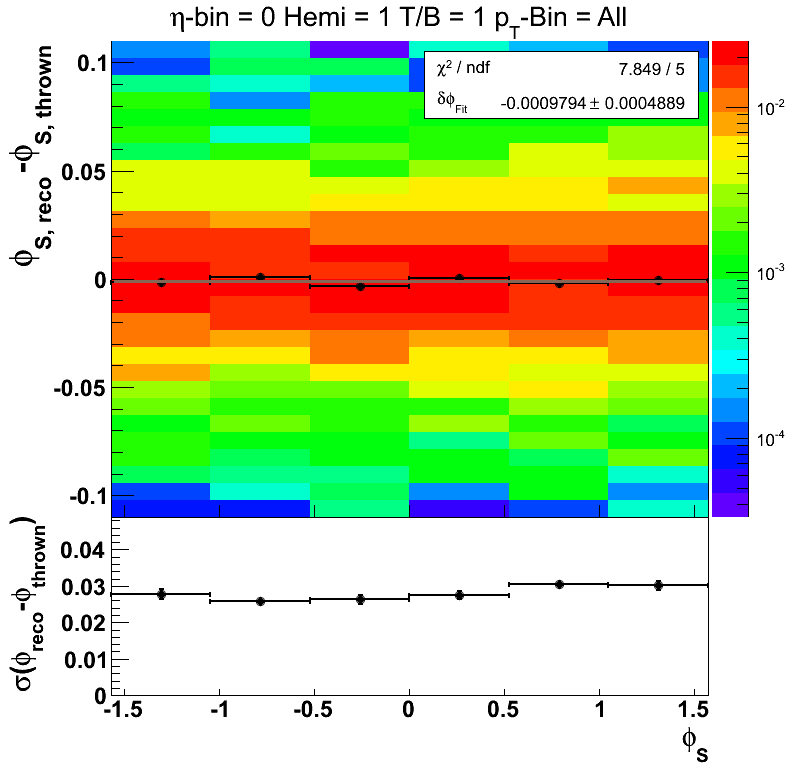
Figure 9: -0.5 < η < 0
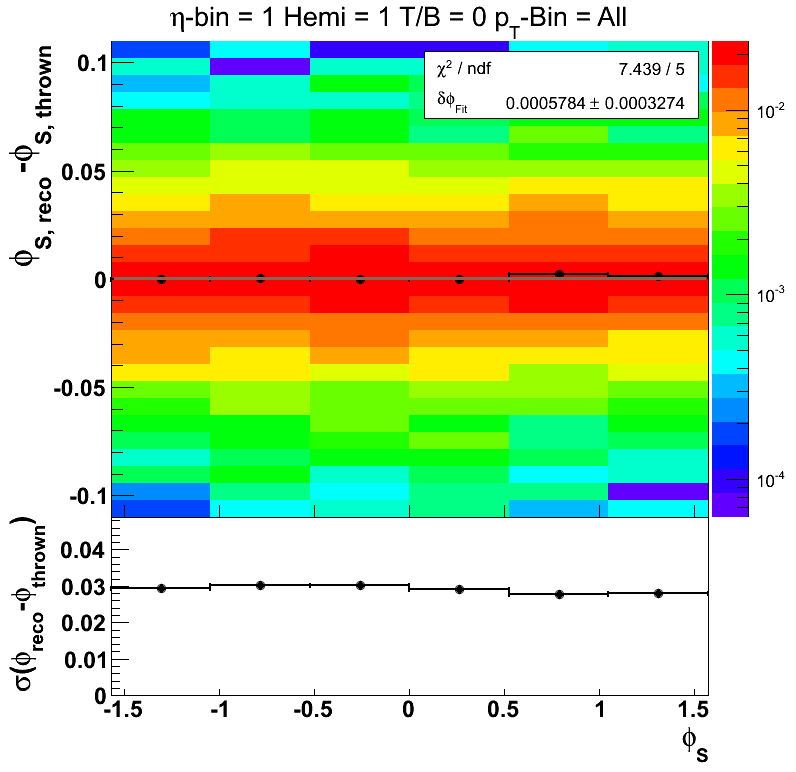
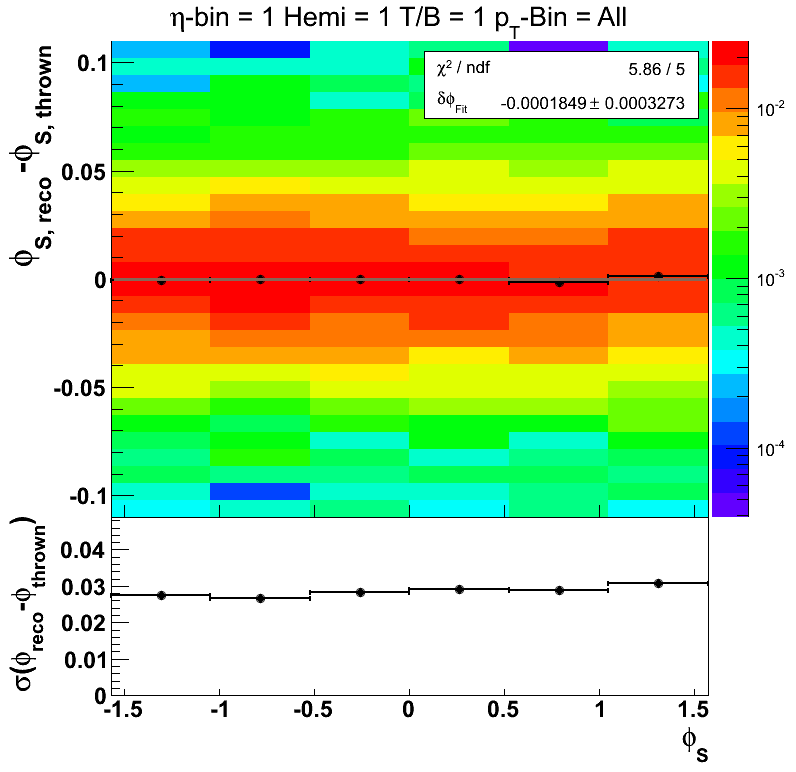
Figure 10: 0 < η < 0.5
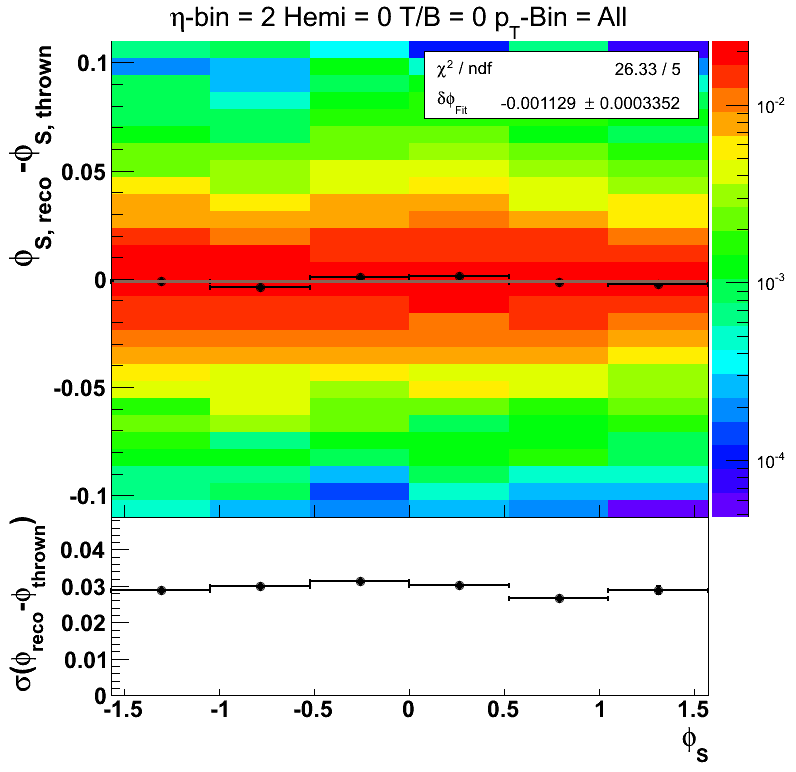
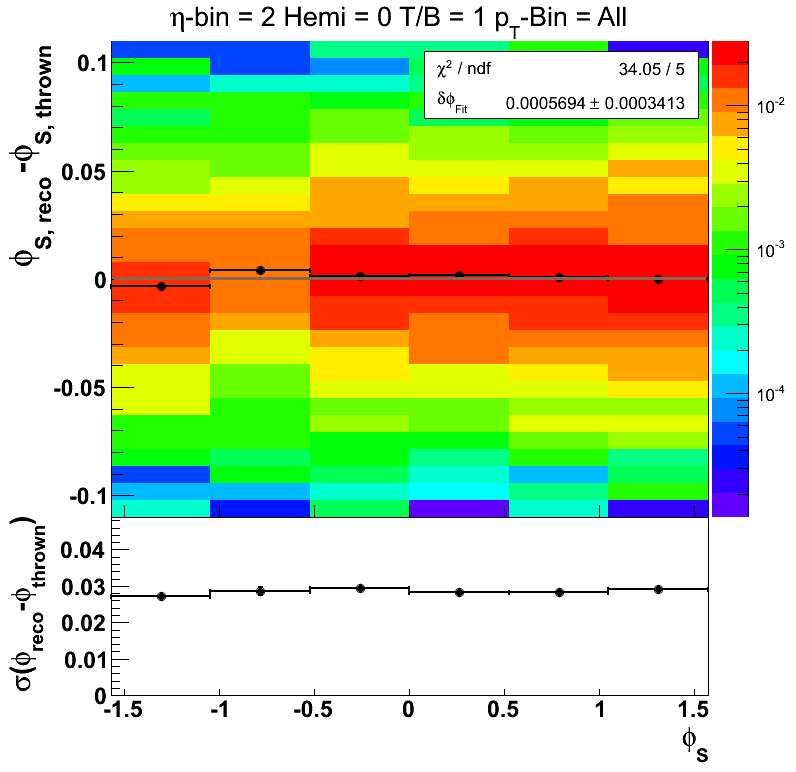
Figure 11: 0.5 < η < 1
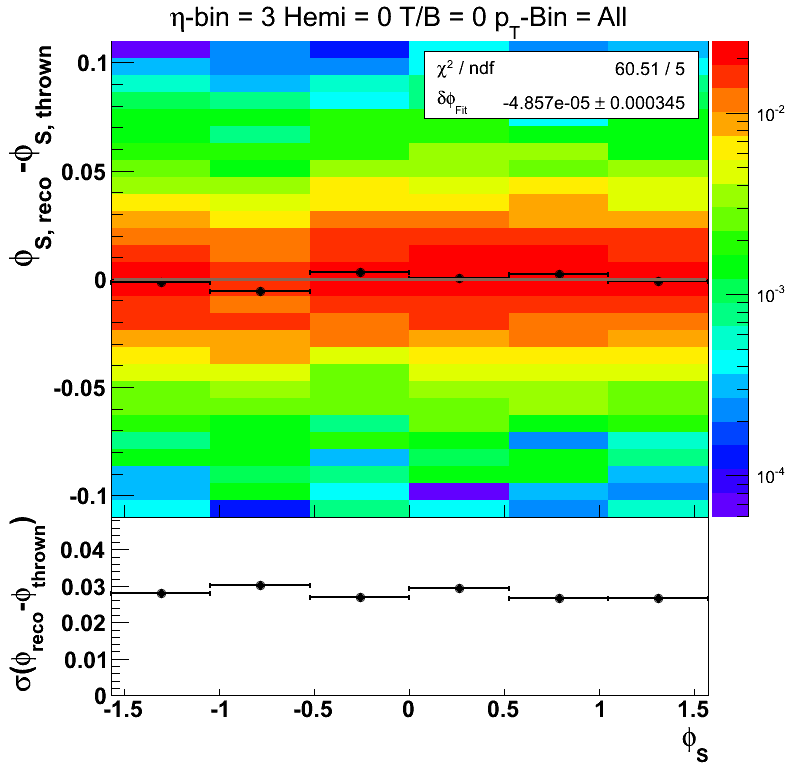
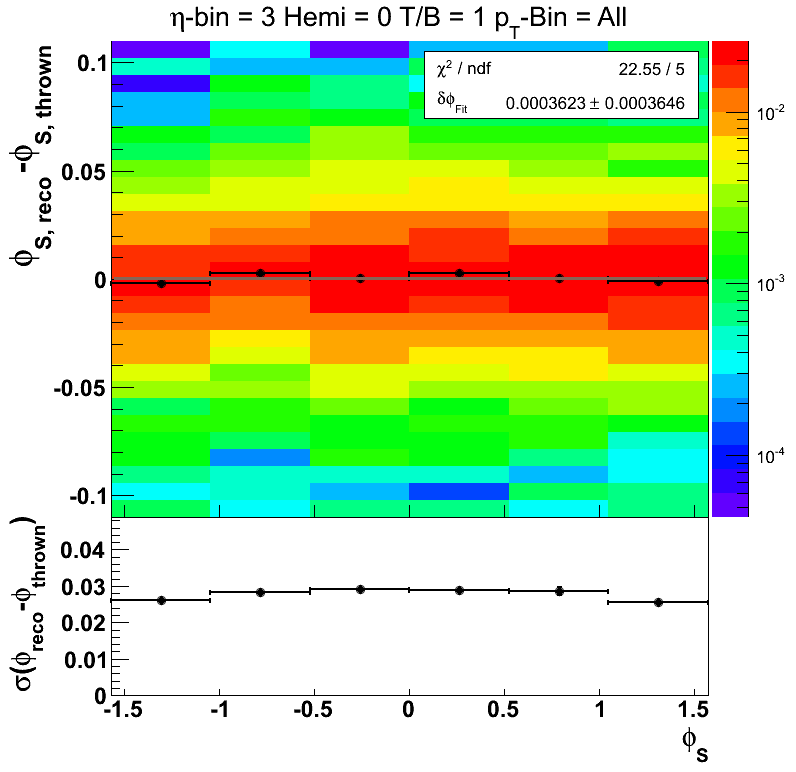
The figures show centroids fluctuating around zero across all pT-bins. The χ2 values, again, indicate that the uncertainties are under-estimated. Again, however, the fitted values are quite small with flucutations within 0.01 radians. The σ's tend to be flat around 0.03. This is undoubtedly correlated to the average pT, e.g. cross-reference with earlier figures. A quick eye-ball scan of the various pT bins suggests the resolution is constant in φS within the various pT bins.
If I take the RMS of the distributions within the range -π/4 < δφS < π/4 I find a resolution that begins around 0.06 and decreases with increasing pT. In one case, I find a resolution that peaks around 0.08. To get an idea of the effect on the Sivers asymmetry, I convoluted a sine function with a Gaussian of width equal to the resolution of 0.08. The resulting distribution represents a sine function damped by a factor of 0.9968.
Groups:
- drach09's blog
- Login or register to post comments