- genevb's home page
- Posts
- 2024
- 2023
- 2022
- September (1)
- 2021
- 2020
- 2019
- 2018
- 2017
- December (1)
- October (3)
- September (1)
- August (1)
- July (2)
- June (2)
- April (2)
- March (2)
- February (1)
- 2016
- November (2)
- September (1)
- August (2)
- July (1)
- June (2)
- May (2)
- April (1)
- March (5)
- February (2)
- January (1)
- 2015
- December (1)
- October (1)
- September (2)
- June (1)
- May (2)
- April (2)
- March (3)
- February (1)
- January (3)
- 2014
- 2013
- 2012
- 2011
- January (3)
- 2010
- February (4)
- 2009
- 2008
- 2005
- October (1)
- My blog
- Post new blog entry
- All blogs
TPC prompt hit reality check
Updated on Fri, 2009-08-28 12:57. Originally created by genevb on 2009-08-28 12:44.
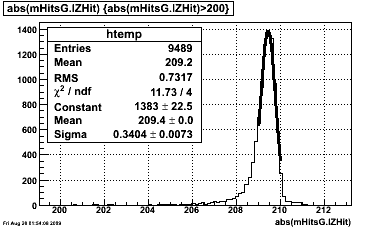
In my opinion, You do not have access to view this node examining the so-called "prompt hits" in the TPC (hits reconstructed at essentially no drift, i.e. Z very close to the endcap, now seen with the new TPX electronics), while valuable, has not shown definitively whether these are truly prompt hits or just noise. It is possible that there is electrical/electronic noise generated near the opening of time window for recording TPC data, which would potentially then be reconstructed as clusters as attached to tracks. Here is a sample Z distribution using Run 9 low luminosity pp data from Run 10118050 (one file: st_physics_10118050_raw_4020001):
(note: all distance units on this page are in cm unless otherwise noted)
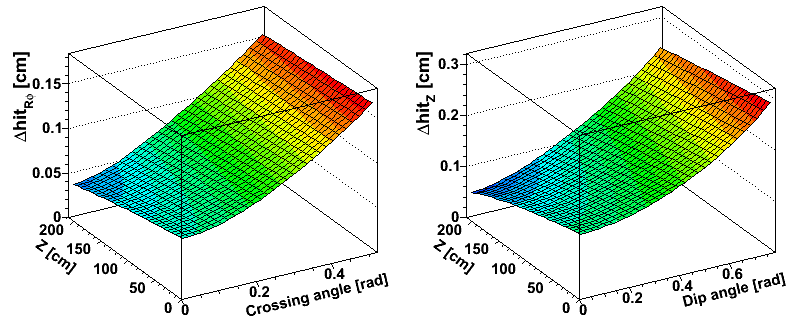
Because the tracking assigns rather good (small) errors to hits at very short drift, these hits potentially also have the power to constrain the track fit and bend the track near the hit. Thus, residuals for these hits will naturally be peaked. Here are the hit errors normally assigned to data, using the latest values from the DB:
I believe the solution is to give these possibly prompt hits large errors so that they do not constrain the tracks, and then look at the residuals. Victor helped by modifying the code to multiply the hit errors by x10 for hits reconstructed with |z| > 200 cm (i.e. the hit errors were increased from the mm level to the cm level). The resulting residuals along the padrow (using the StiPulls code) are shown on the left here, with west TPC in blue and east TPC in red. For comparison, regular small hit errors are shown for the west TPC on the right, constraining the track and pulling the distribution in towards zero:
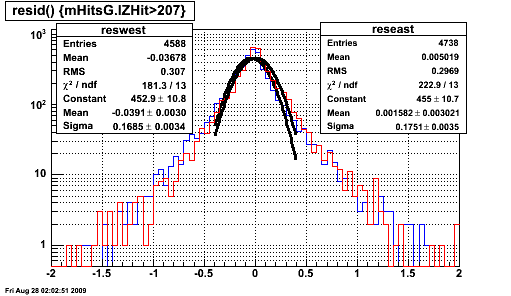
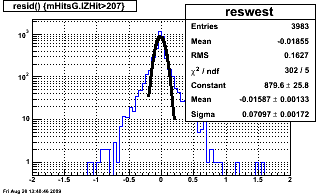
This distribution with larger errors is still clearly peaked at zero, contrary to the flat distribution which we would expect from noise. I think this is very clear evidence that these hits are associated with tracks and not just noise (to me, the first convincing evidence). The distributions for east and west are similar, and seem to exhibit resolutions in the vicinity of 1.7 mm in the central peak, though the overall distributions have an RMS of perhaps 3 mm. I have not studied these numbers versus crossing angle, so this should not be considered a definitive study of the true hit errors, though it gives some idea of them being on the same order of magnitude as usual TPC hits, perhaps a bit larger).
Showing the mean along-padrow residual versus padrow and sector reveals no gross structures, and I've not studied whether the few outliers that exist are simply due to statistics:
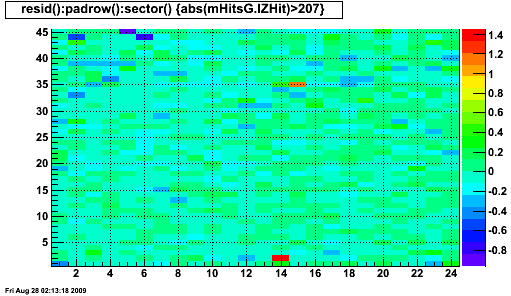
It's interesting that there are any hits at the inner-most padrows, considering tracks need at least 5 hits to be considered by Sti. But I've put no quality cuts of any sort on these tracks.
In the Z direction, things are much uglier. I have not used the latest calibration of the T0s, so there could be some artifacts from it. However, I understand from Grant that his calibration is generally at the few ns level, corresponding to the 100 micron level when converted to distances using a drift velocity near 5.5 cm/us. So I think my plots are insensitive to any such artifacts given the spread in Z residuals (again, west is in blue and east is in red):
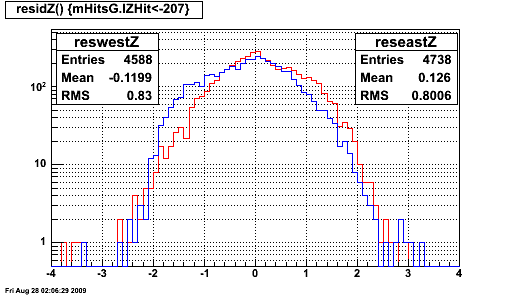
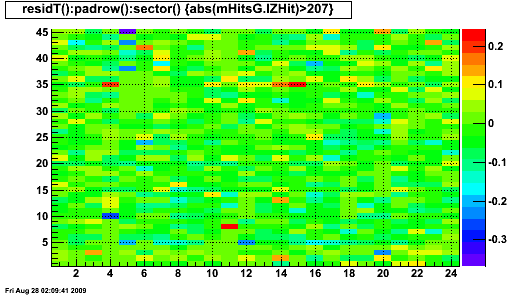
The residuals appear to show a distribution which has a hump on one side. Since Z corresponds to time with opposite sign dependence for east and west, this implies a similar hump in the time distribution on the two sides. I have not studied this, but I show here the residuals in time (the Z residual by the drift velocity and signed by TPC half) versus padrow and sector (color axis is in microseconds), again revealing no gross features:
It is further work to assign proper hit errors to these hits to make them truly useful for constraining tracks. For now, Victor and I plan to leave the hit errors large so that they do not constrain the tracks.
-Gene
»
- genevb's blog
- Login or register to post comments