- genevb's home page
- Posts
- 2024
- 2023
- 2022
- September (1)
- 2021
- 2020
- 2019
- 2018
- 2017
- December (1)
- October (3)
- September (1)
- August (1)
- July (2)
- June (2)
- April (2)
- March (2)
- February (1)
- 2016
- November (2)
- September (1)
- August (2)
- July (1)
- June (2)
- May (2)
- April (1)
- March (5)
- February (2)
- January (1)
- 2015
- December (1)
- October (1)
- September (2)
- June (1)
- May (2)
- April (2)
- March (3)
- February (1)
- January (3)
- 2014
- 2013
- 2012
- 2011
- January (3)
- 2010
- February (4)
- 2009
- 2008
- 2005
- October (1)
- My blog
- Post new blog entry
- All blogs
A decade of TPC Field Cage Currents
Updated on Thu, 2013-10-17 13:01. Originally created by genevb on 2013-10-01 22:33.
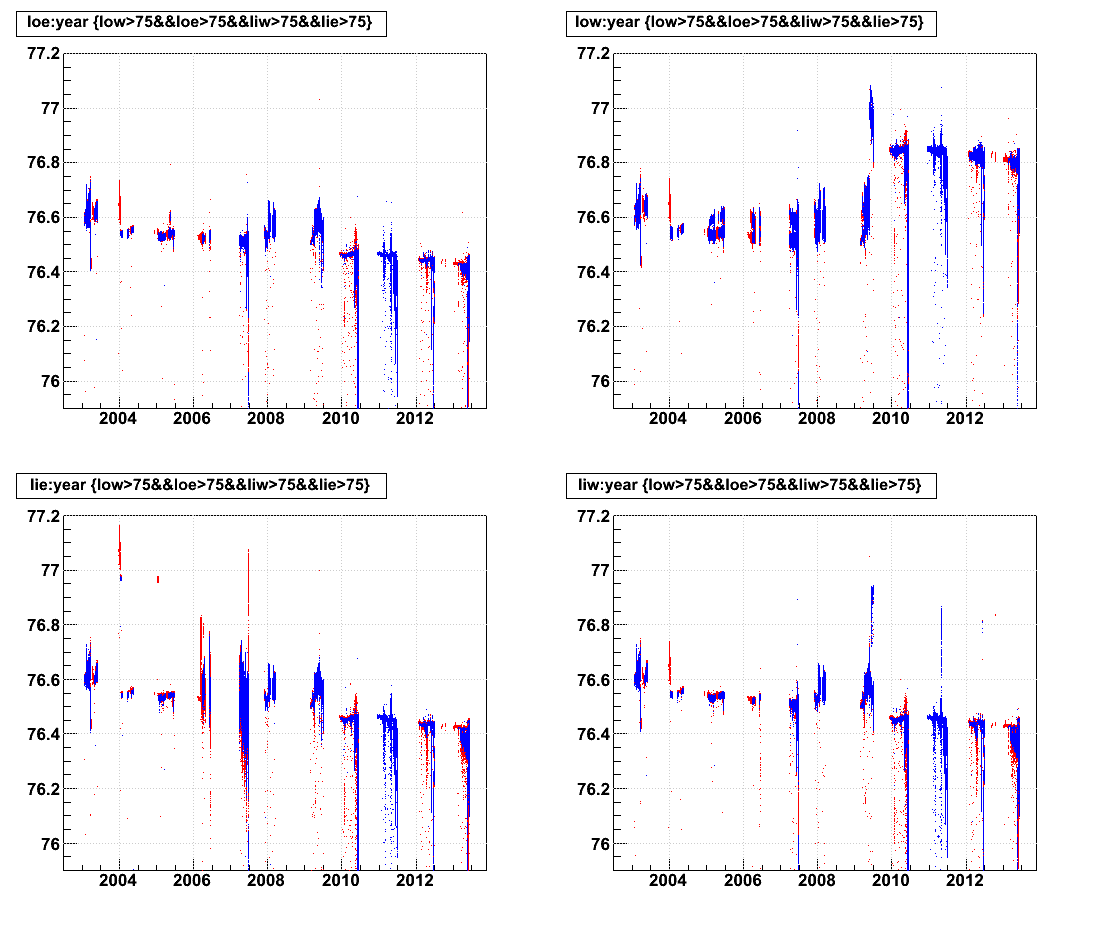
I obtained the field cage currents from Runs 3 through 13 (years 2003-2013) and plotted them versus time [years]. The individual Run periods are easily discerned over this time range. Here are the results:
(open each image in a new window or tab to see higher resolution)
Legend:
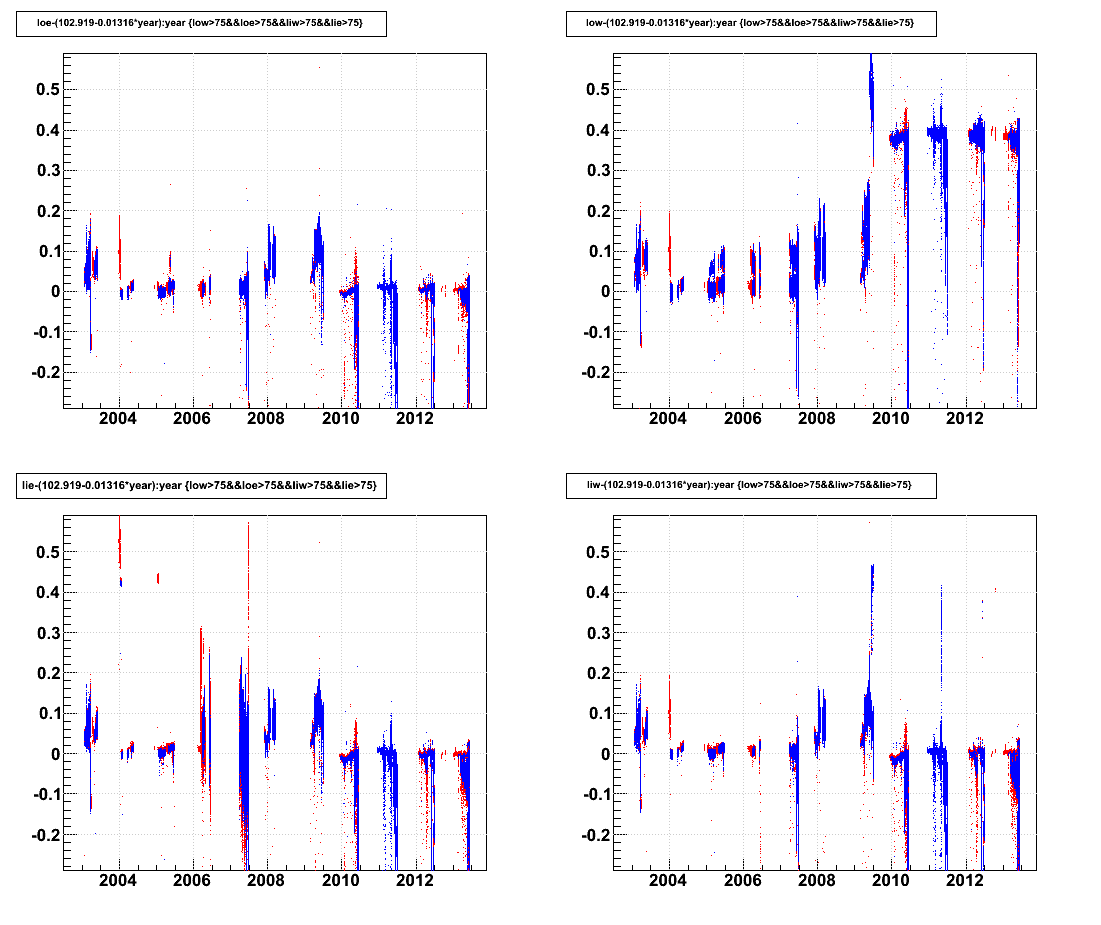
Attempting to subtract off the common downward trend, and overall magnitude, helps obviate other features:
-Gene
(open each image in a new window or tab to see higher resolution)
Legend:
- top left: OFCE (outer east)
- bottom left: IFCE (inner east)
- top right: OFCW (outer west)
- bottom right: IFCW (inner west)
- all recorded data in red
- only during during TPC runs in blue
Attempting to subtract off the common downward trend, and overall magnitude, helps obviate other features:
- Common:
- Run 3 (and the very beginning of Run 4) and Runs 8 & 9 all have slightly elevated currents (on the ~100 nAmp scale, or ~0.1% scale)
- Huge dips seen near the end of Run 13 (see this blog) also occurred in Runs 10-12 (but went unnoticed?)
- OFCE:
- Generally no unique issues
- IFCE:
- A short near ring 169.5 occurred at start of Run 4, but a compensating resistor was put in place for most of Runs 4 and 5
- The first attemt to patch this short caused flucuating currents in Runs 6 and 7
- The short was permanently fixed before Run 8
- OFCW:
- The partial short believed to be near ring 80.5 persisted from Run 5-9 (but went unnoticed for a few years and was only corrected in the data for Runs 8-9?)
- The short between the last two rings (181 & 182) occurred part way through Run 9
- IFCW:
- Some Run 9 data looked like a short, but other evidence does not support this (see this blog)
-Gene
»
- genevb's blog
- Login or register to post comments