- genevb's home page
- Posts
- 2024
- 2023
- 2022
- September (1)
- 2021
- 2020
- 2019
- 2018
- 2017
- December (1)
- October (3)
- September (1)
- August (1)
- July (2)
- June (2)
- April (2)
- March (2)
- February (1)
- 2016
- November (2)
- September (1)
- August (2)
- July (1)
- June (2)
- May (2)
- April (1)
- March (5)
- February (2)
- January (1)
- 2015
- December (1)
- October (1)
- September (2)
- June (1)
- May (2)
- April (2)
- March (3)
- February (1)
- January (3)
- 2014
- 2013
- 2012
- 2011
- January (3)
- 2010
- February (4)
- 2009
- 2008
- 2005
- October (1)
- My blog
- Post new blog entry
- All blogs
SpaceCharge fluctuations in AuAu27
Updated on Wed, 2018-05-30 00:09. Originally created by genevb on 2018-05-16 08:15.
Evidence of sizable space charge due to the large ionization in abort gap cleaning due to beam in bunch ID 113 using run 19133056 (from Sunday, May 12th, 2018)
Plots:
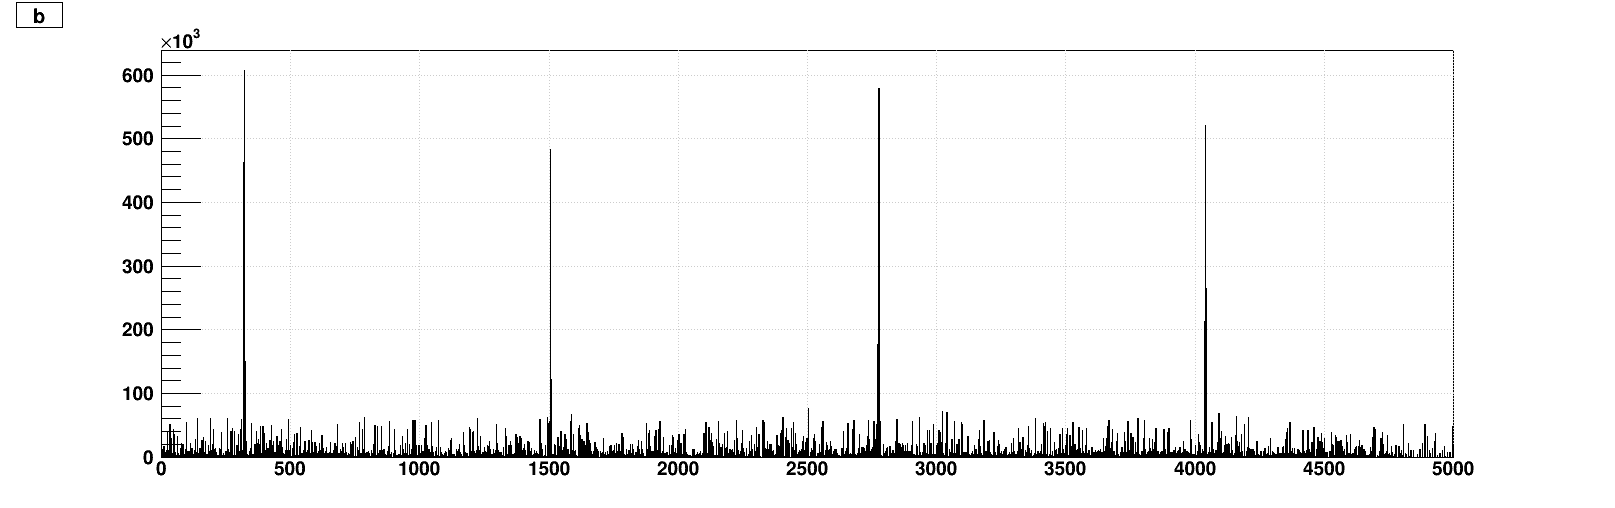
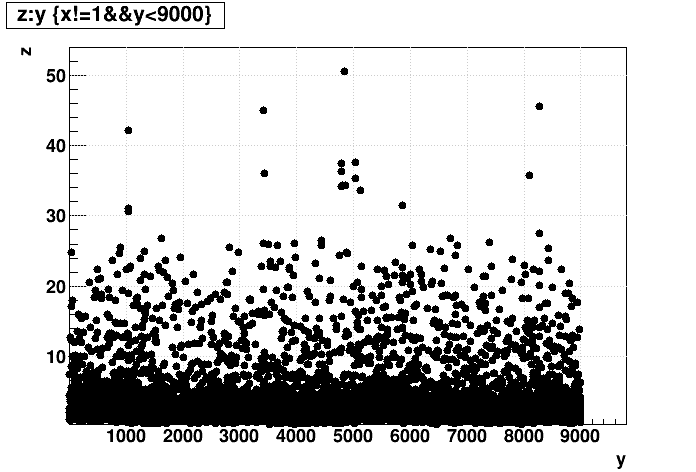
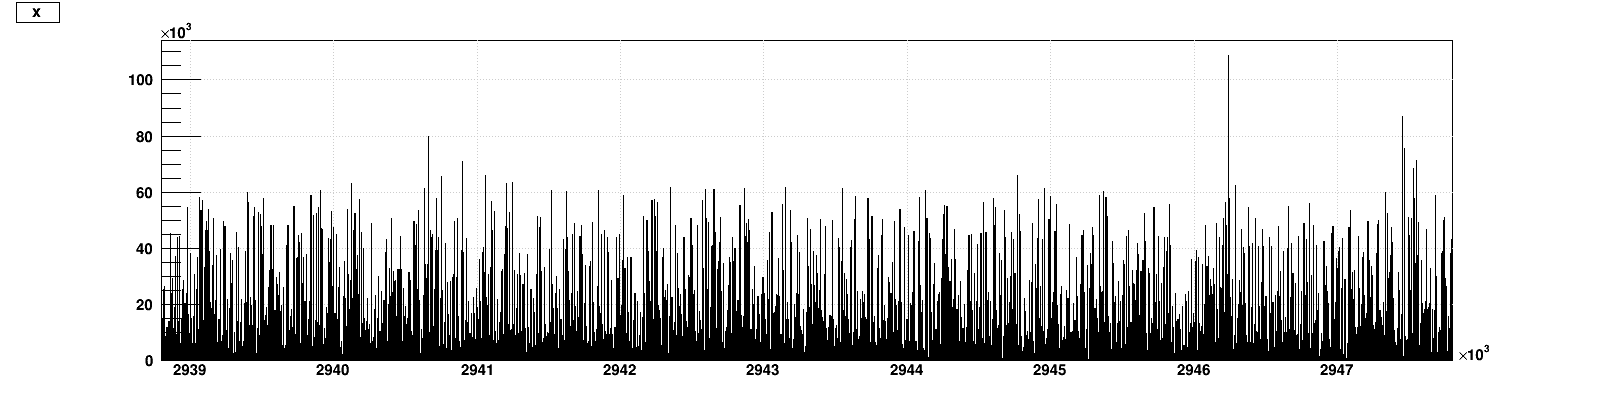
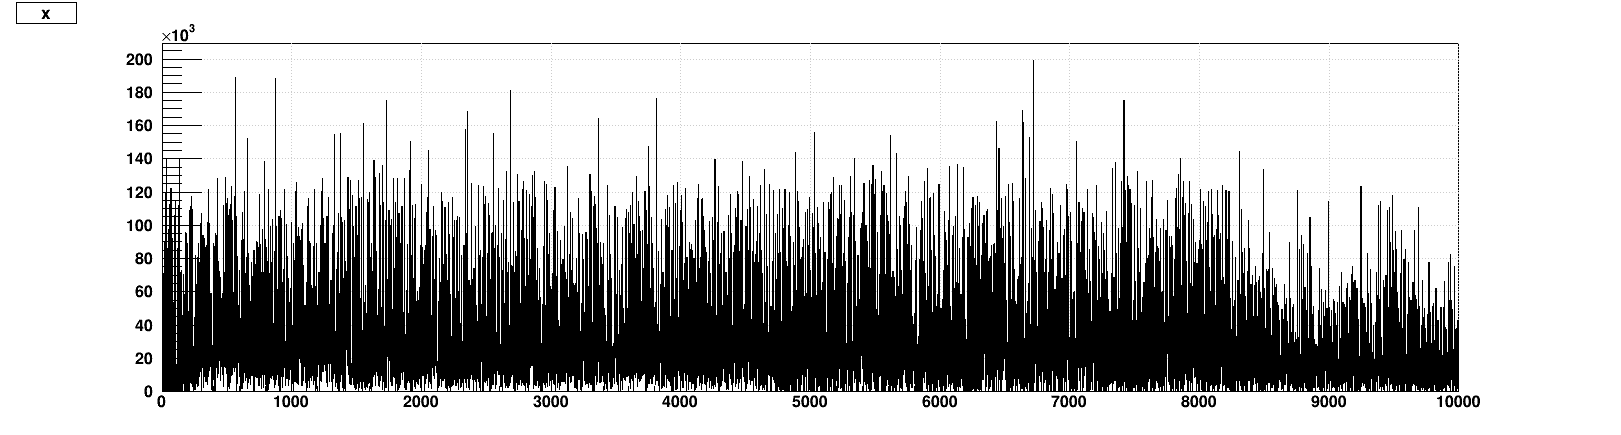
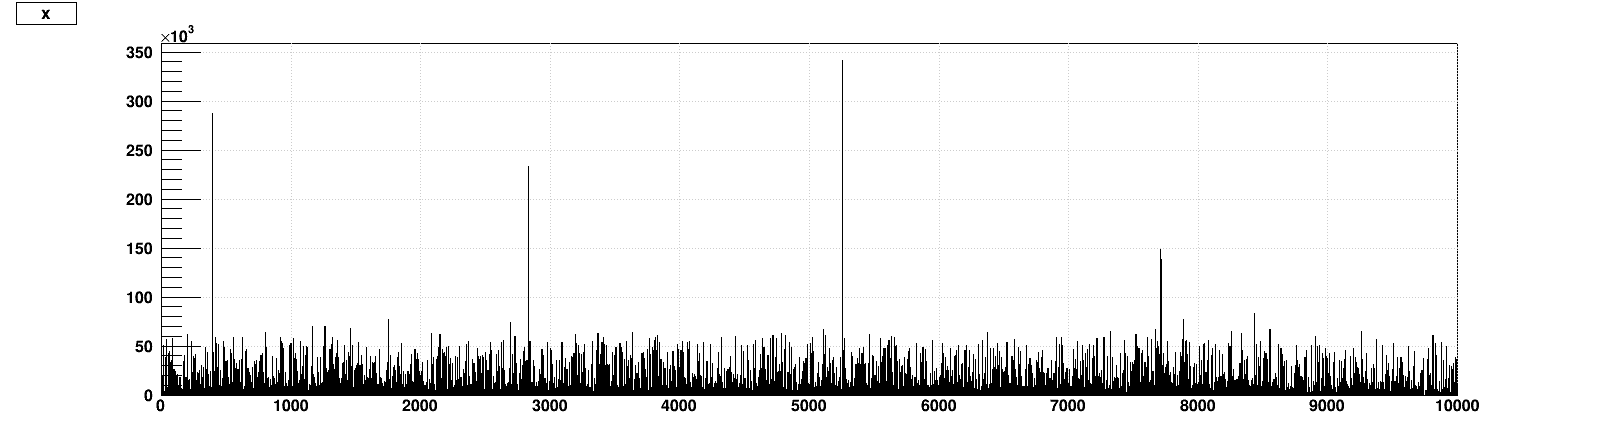
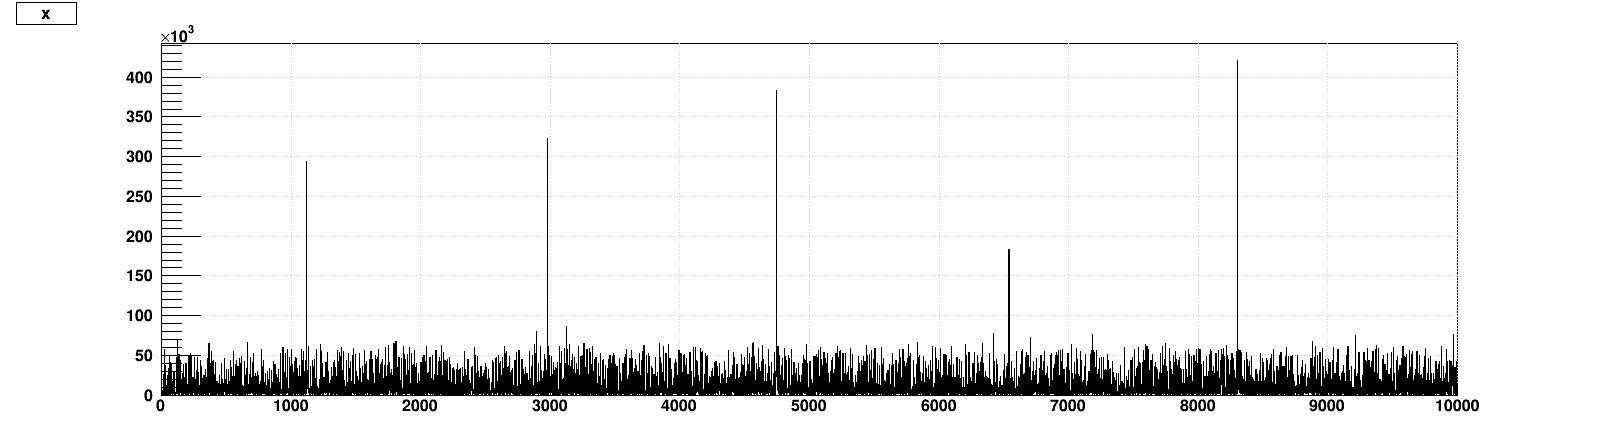
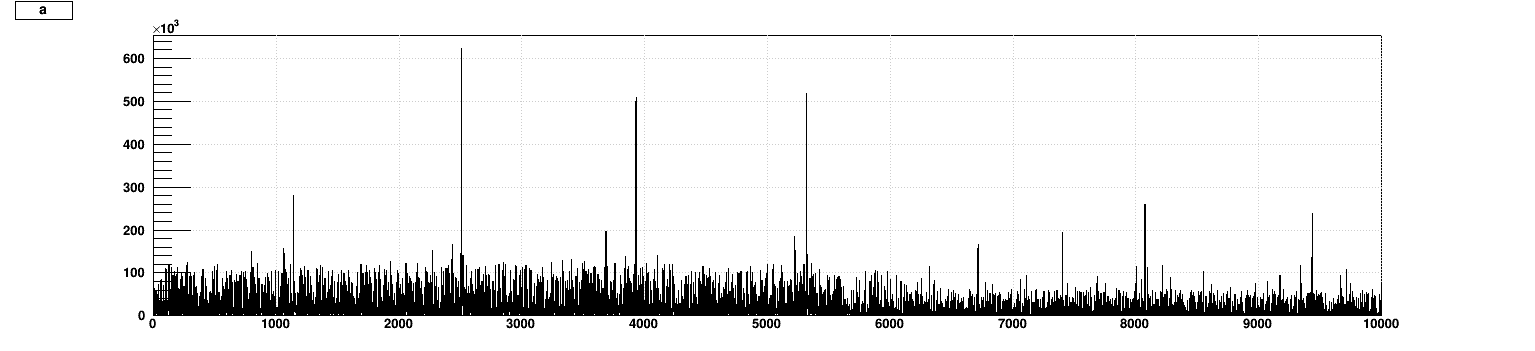
1) number of TPC clusters per event vs. event ID for the first 5000 events
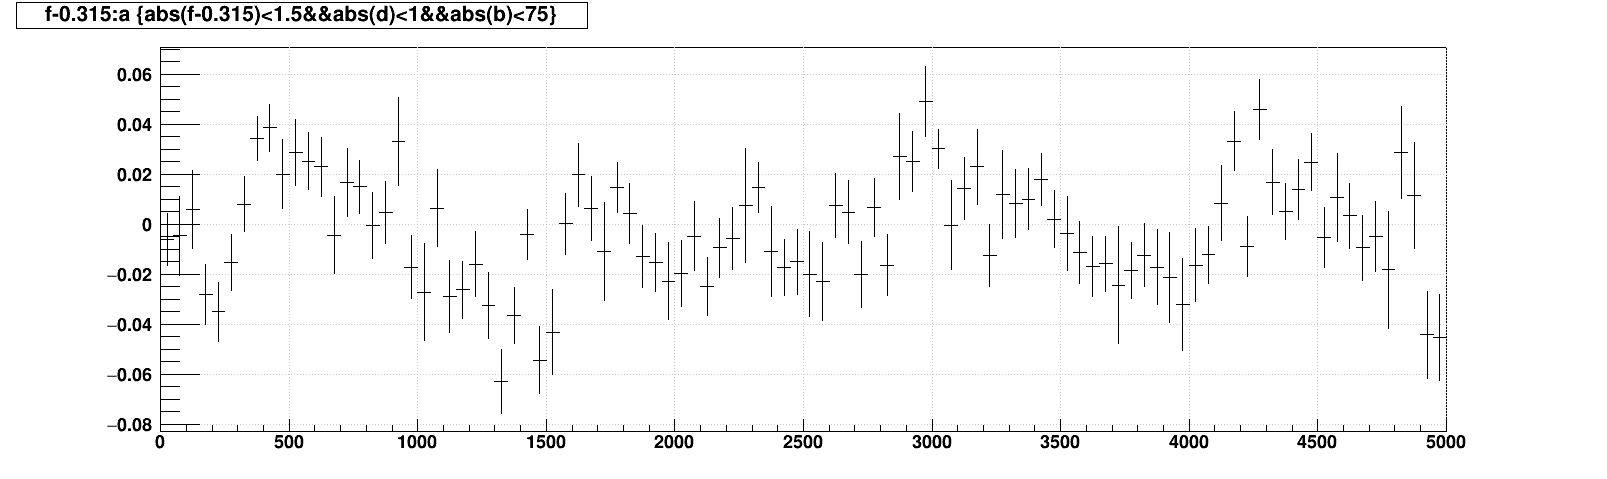
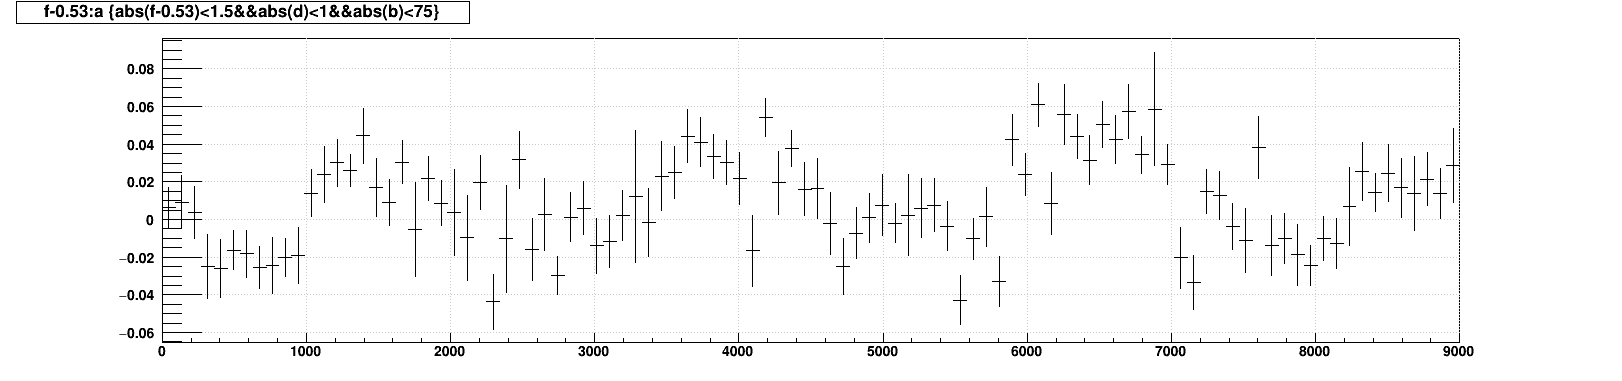
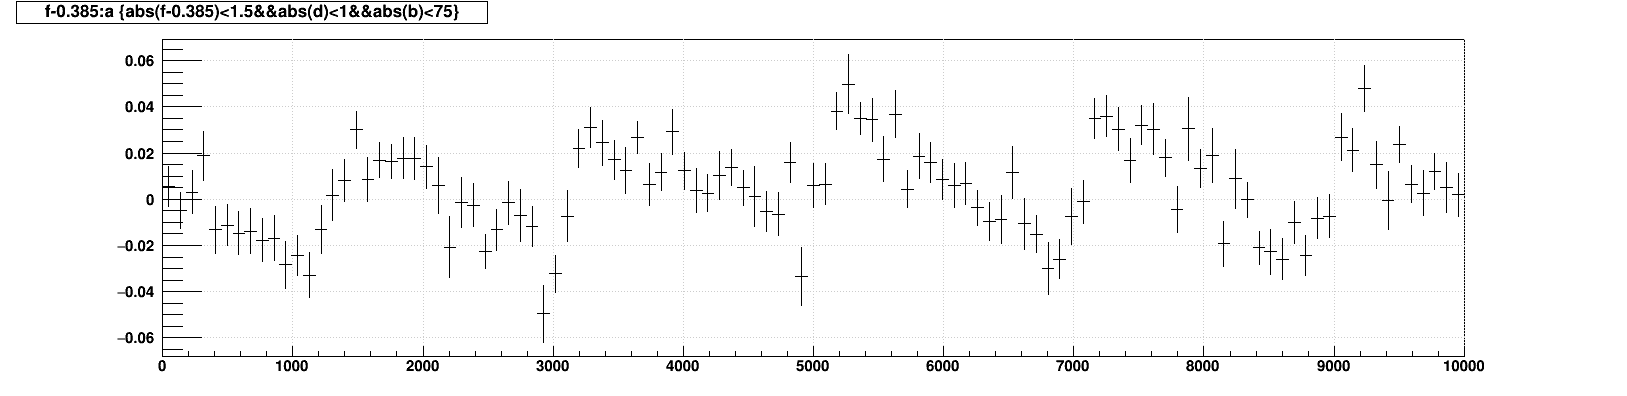
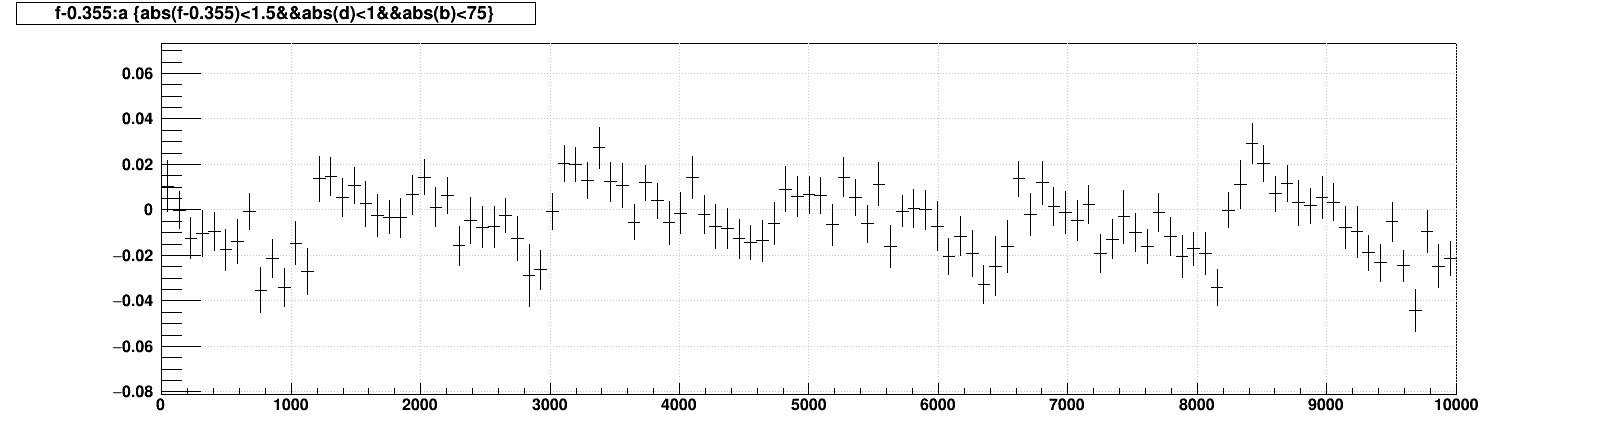
2) signed DCA of tracks averaged over the whole TPC (|eta|<1) vs. event ID for the first 5000 events
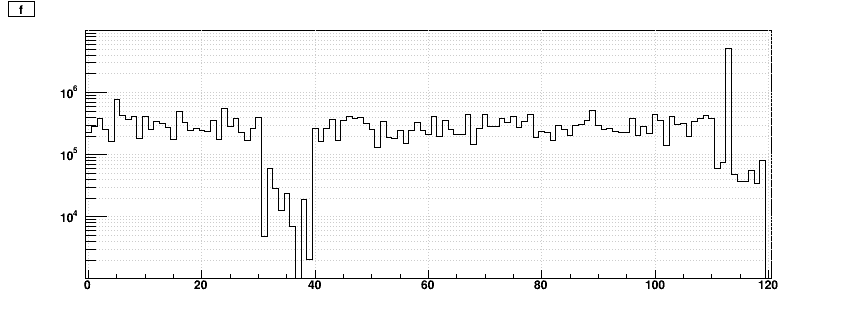
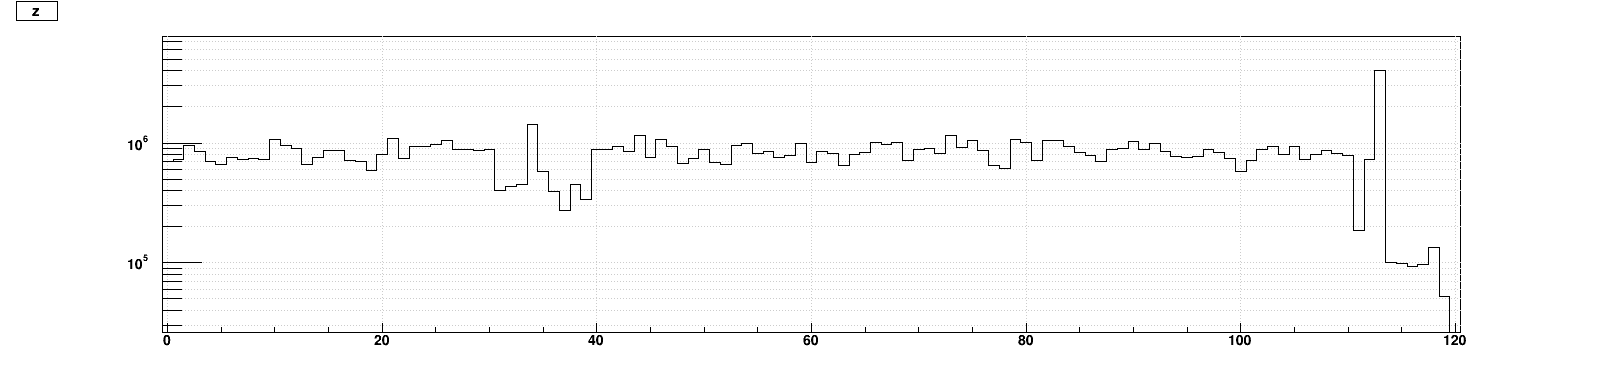
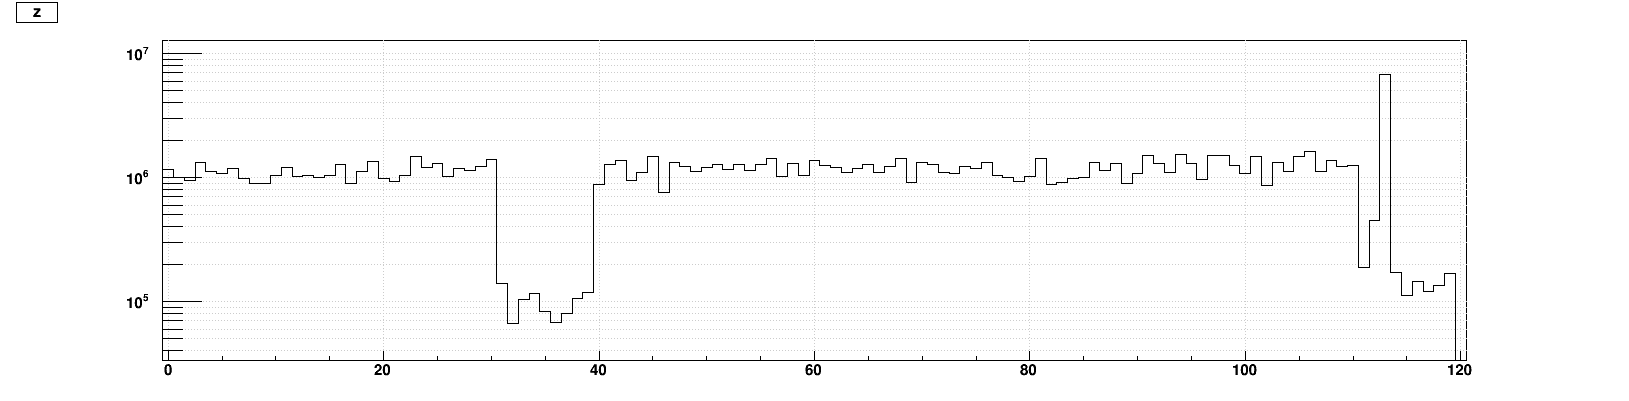
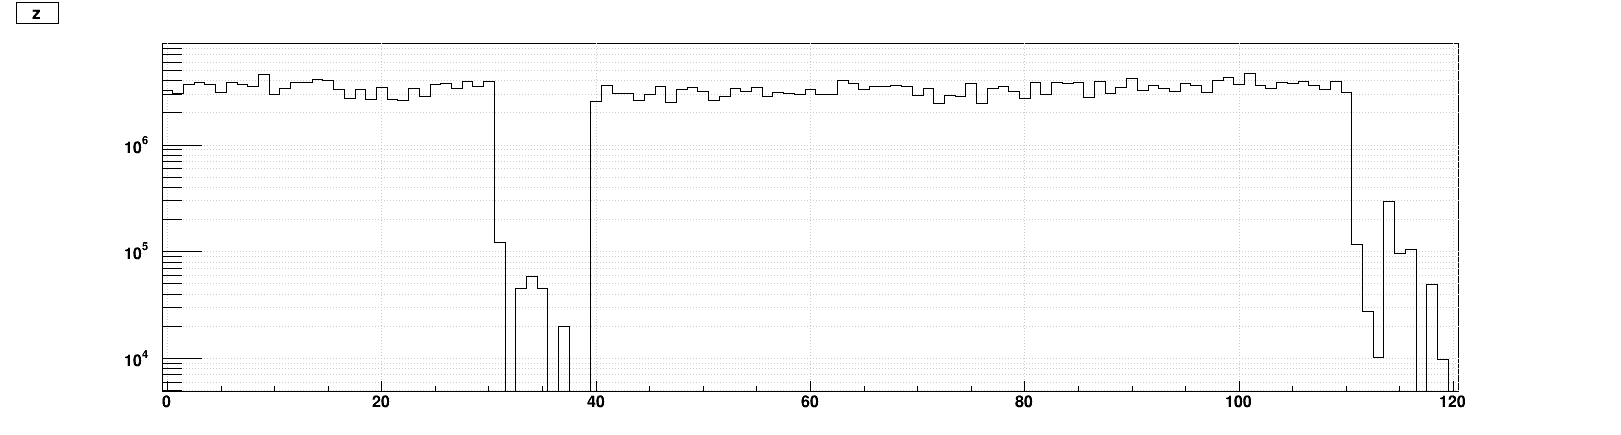
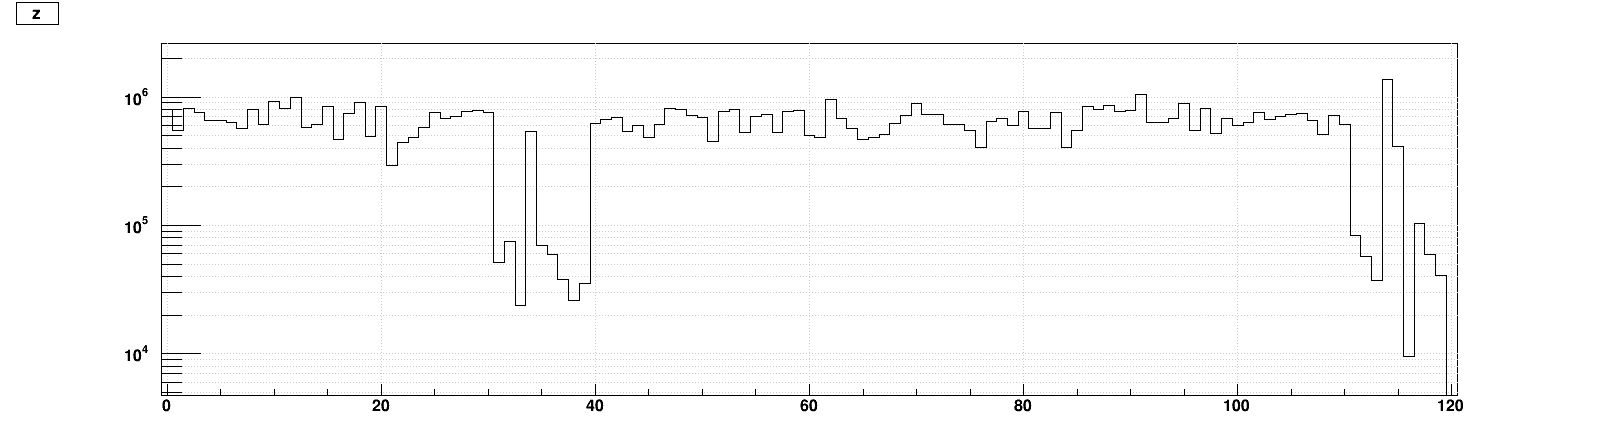
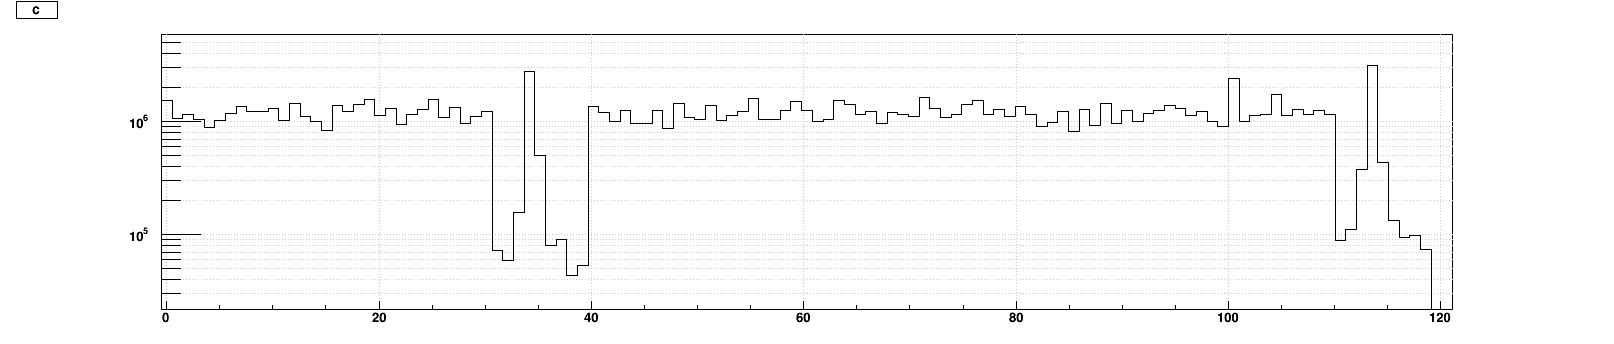
3) number of TPC clusters per event vs. bunch ID (7 bit)
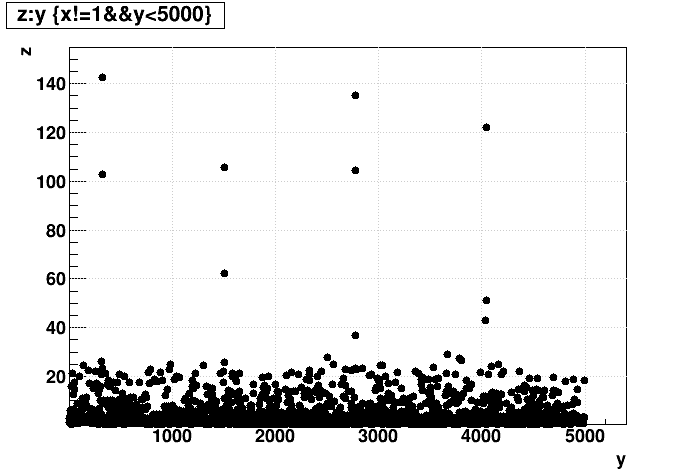
4) CPU processing time per event vs. eventID for the first 5000 events
These show clear jumps in the signed DCA of order 1 mm when the large events occur. Given that this is an average over the whole TPC, we can assume that some of the tracks are seeing larger than 1 mm effects.
NB: Even though the large events generally trigger on bunch ID 113, this does not mean that events triggered on other bunch IDs are immune. For example, I have seen events triggered on a collision in bunch ID 5, but there is still lots of charge arriving on subsequent arrivals of bunch ID 113 (i.e. the next large charge deposition arrives 108 crossings after the trigger instead of 120 crossings after, and then another deposition arrives 228 instead of 240 after, etc.).
-Gene
_______________
Update #1: Comparing to Run 11, using run 12174106 (5000 events from a single file)
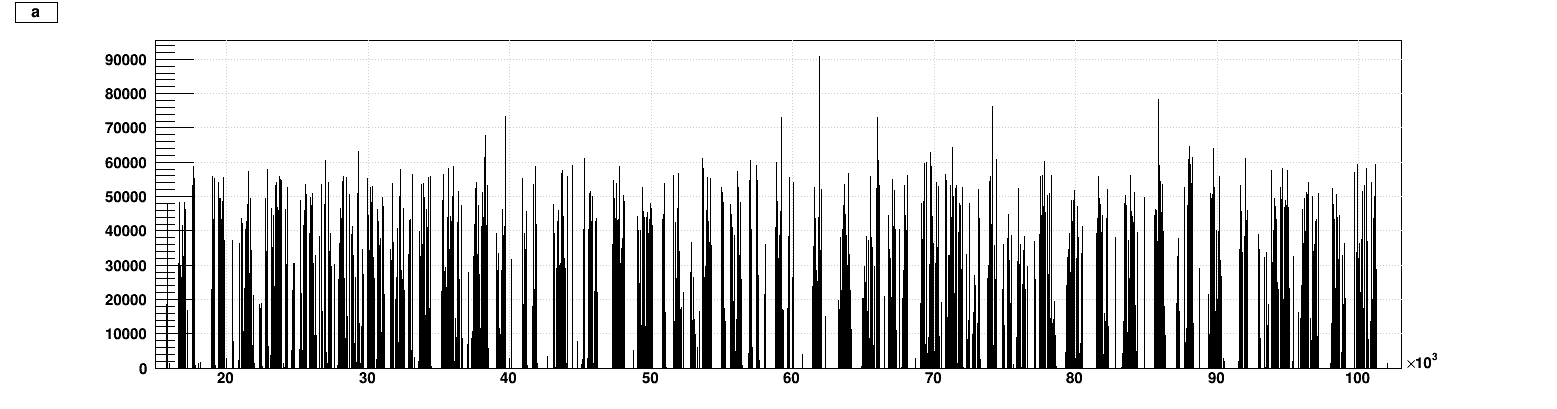
Here are the TPC clusters vs. event ID, showing no big peaks:
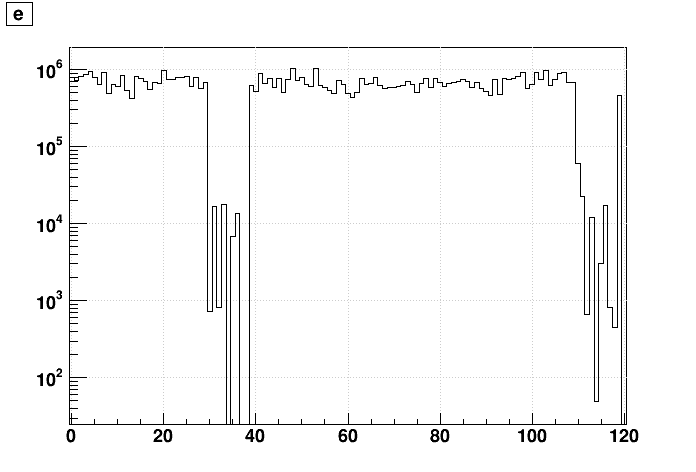
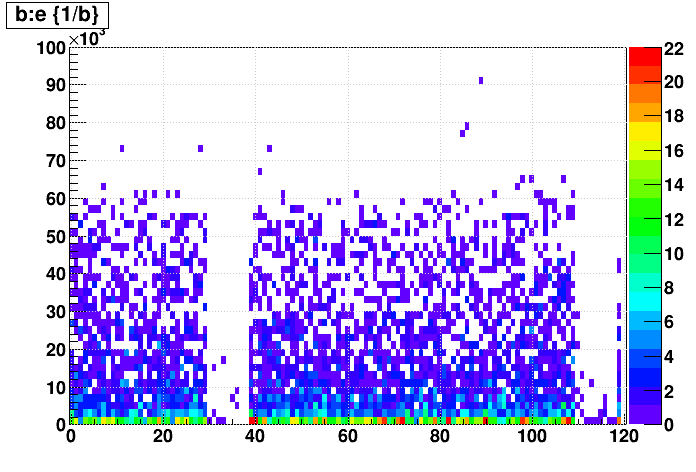
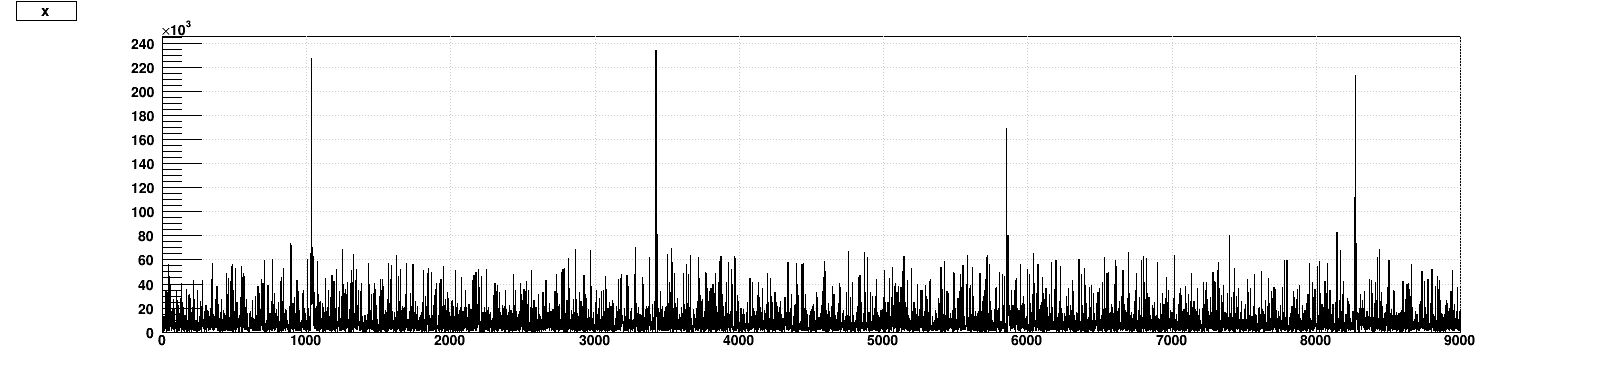
Next is the TPC clusters vs. bunch ID, with the sum of all clusters from all events in that bunch ID on the left, and then the distribution of TPC clusters in events on the right:
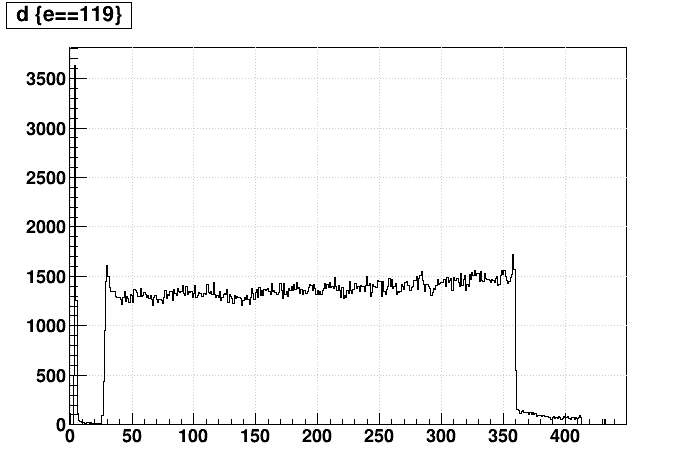
The only notable peak in the abort gap seems to be at bunch ID=119, but it looks like normal events:
Next I use the data to enhance the charge step within the TPC. I use only time bins [80,320] to avoid other charge steps in the TPC (i.e. gating grid, triggered event), and then offset the time bucket distribution by the amount necessary to see events that occur from bunch ID 113 starting at time bin 40 in the plot: (time_bin + 160 + (triggered_bunch_ID - 113))%120. One can indeed see something of a step around 40:
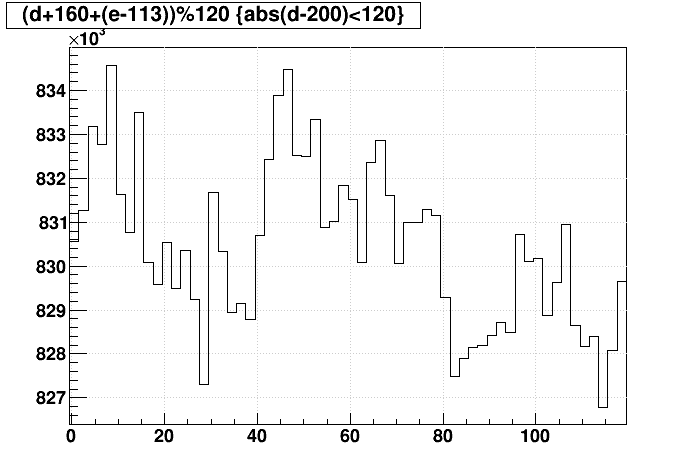
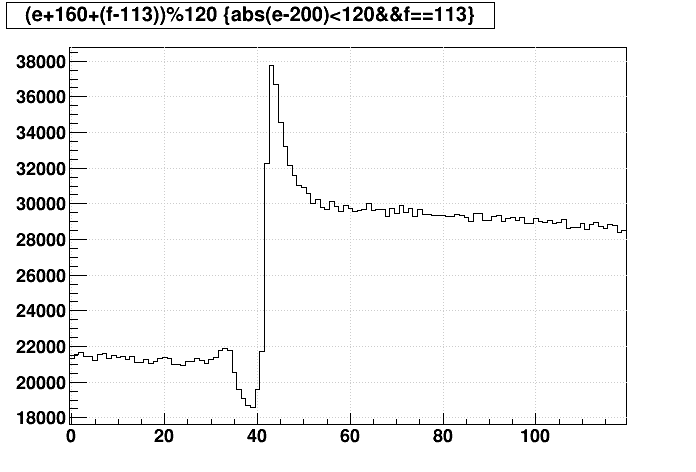
For comparison, here is the same plot for Run 18 AuAu27. On the left is for events not triggered on bunch ID 113, and on the right are events triggered on bunch ID 113 (which is clearly a biased trigger towards showing the step):
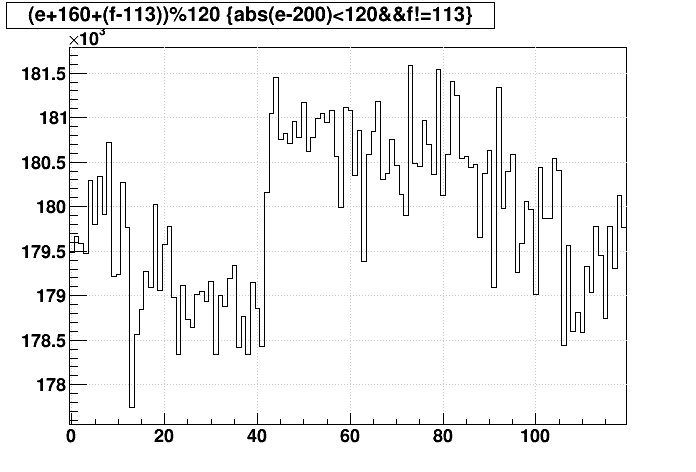
If I compare the non-bunch-113-triggered charge step from Run 18 to the charge step in Run 11 (which didn't seem to trigger on 113 anyhow), I see that it is notably larger percentage-wise (~2.5/180 = ~1.4% vs. ~5/832 = ~0.6%). So in Run 18 we are both triggering on the bunch 113 events, and we're seeing more charge from bunch 113 events in other events.
I am a bit curious about the charge step shape clearly seen in the bunch-113-triggered events which has a small dip before the step and a peak just after the step. I have the following guesses:
- The peak might be due to these clusters actually being formed in or near the multi-wire chamber region of the TPC, and the clusters there may have different characteristics from standard clusters, leading to splitting into multiple clusters?
- The dip might possibly be the charge step at the other end of the drift (e.g. central membrane) from earlier bunch 113 events (early pile-up).
-Gene
____________________
UPDATE #2: a look at Run 19137029, which was expected to have reduced charge from abort gap events
Field cage currents seem to show an improvement
Below are the same 4 plots as at the top of this page but for run 19137029 (aside: this run was acquired at a notably higher trigger rate, so it takes more events to span each second). The big TPC Cluster events appear to be a factor of 2-3x smaller than for run 19133056 above....however...
....It looks like there's still SpaceCharge due to the abort gap events, and it appears to be about the same magnitude as before of nearly 1 mm on signed DCA! ?!?!
_________
UPDATE #3: looking at events from the very end of run 19137048, which was supposed to have both blue and yellow abort gap cleaning turned off
Same 4 plots again, looking very clean all around! This is how we would really like it to be!
_____________
UPDATE #4: looking at events from the very beginning of run 19137048, which was supposed to have just yellow abort gap cleaning turned off
Same 4 plots again, with lots of space charge. The blue gap cleaning really made the difference.
_____________
UPDATE #5: looking at events from the very beginning of runs 19139022, 023, 024
Running some jobs concurrently caused some extra CPU time, so ignoring the CPU time plot, here are....
...the same as plots 1-3 from the top of this page again, which seem to show increasing contributions of abort gap events, and of space charge fluctuations.
Run 19139022:
Run 19139023:
Run 19139024:

_____________
UPDATE #6: looking at runs where the abort gap repetition rate was supposed to be increased from 1 Hz to 10 Hz, specifically looking at runs near the end of fills where the amount of charge dumped into STAR from abort cleaning has typically been largest
TPC clusters and sDCA vs. Event ID plots for run 19141030, but things look the same...perhaps the switch to 10 Hz was not actually done?
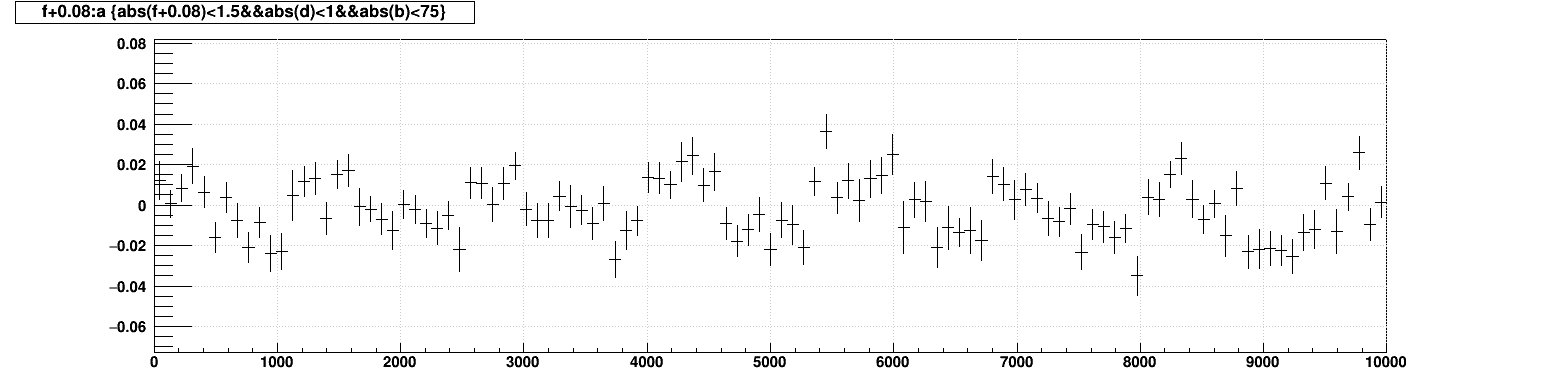
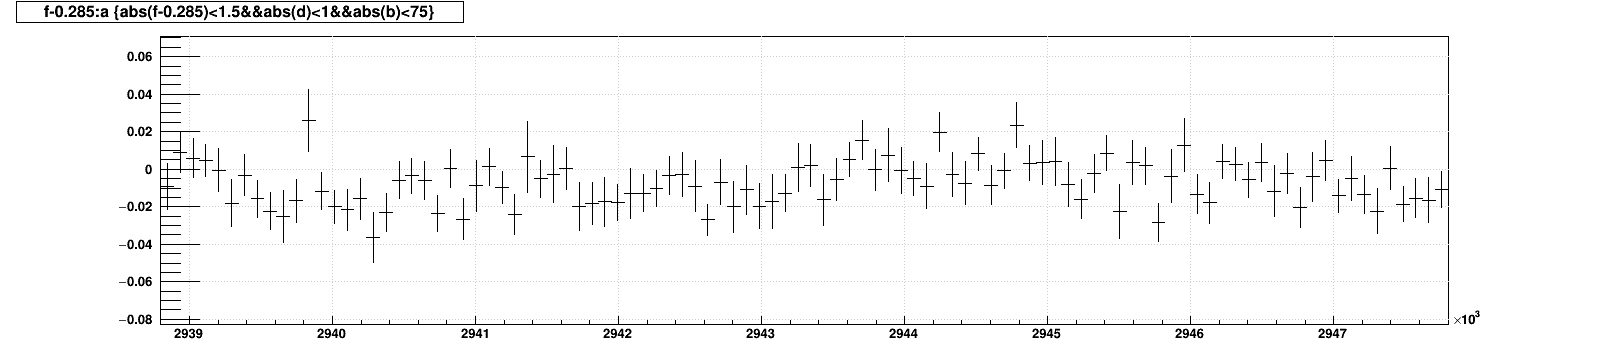
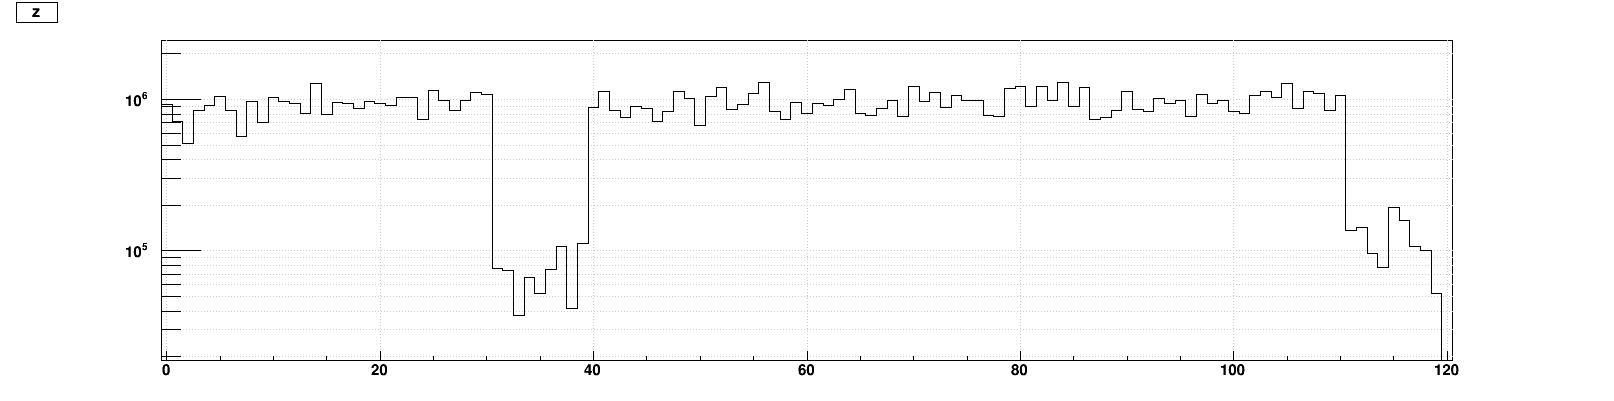
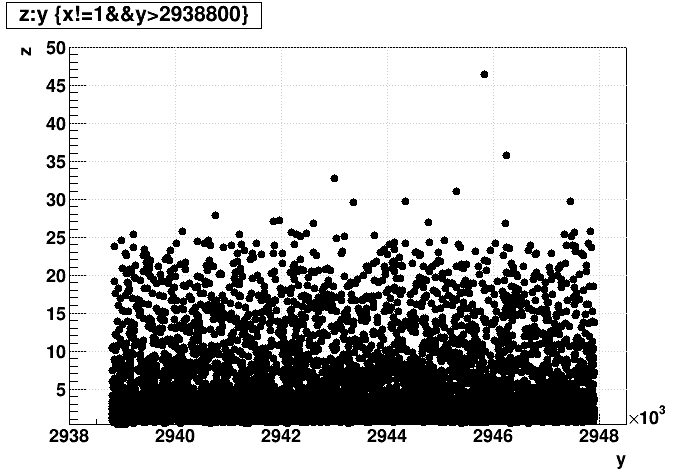
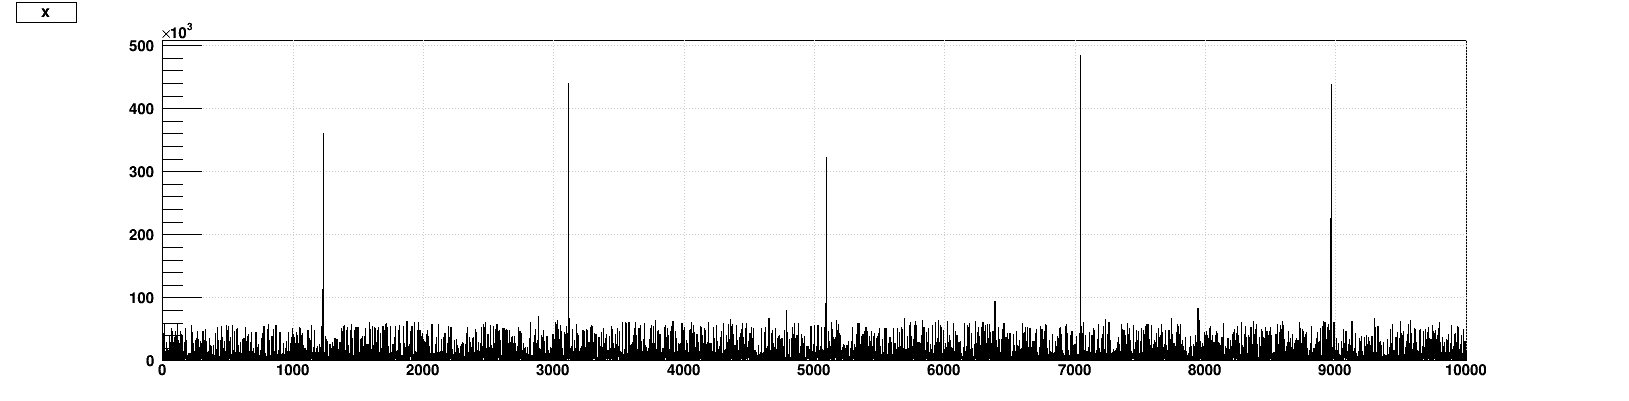
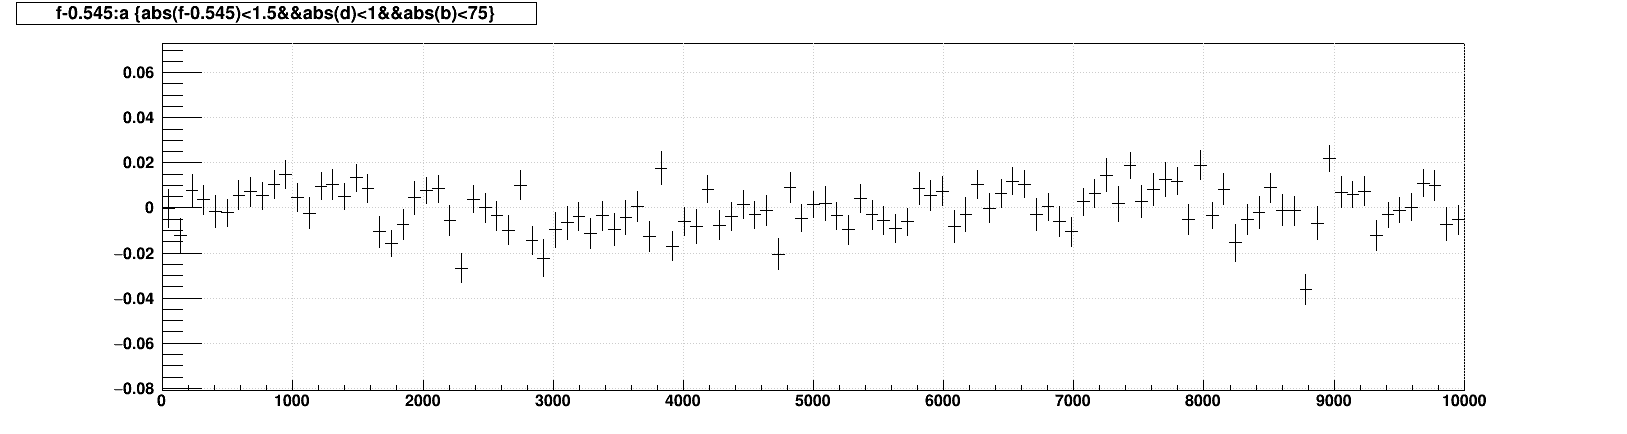
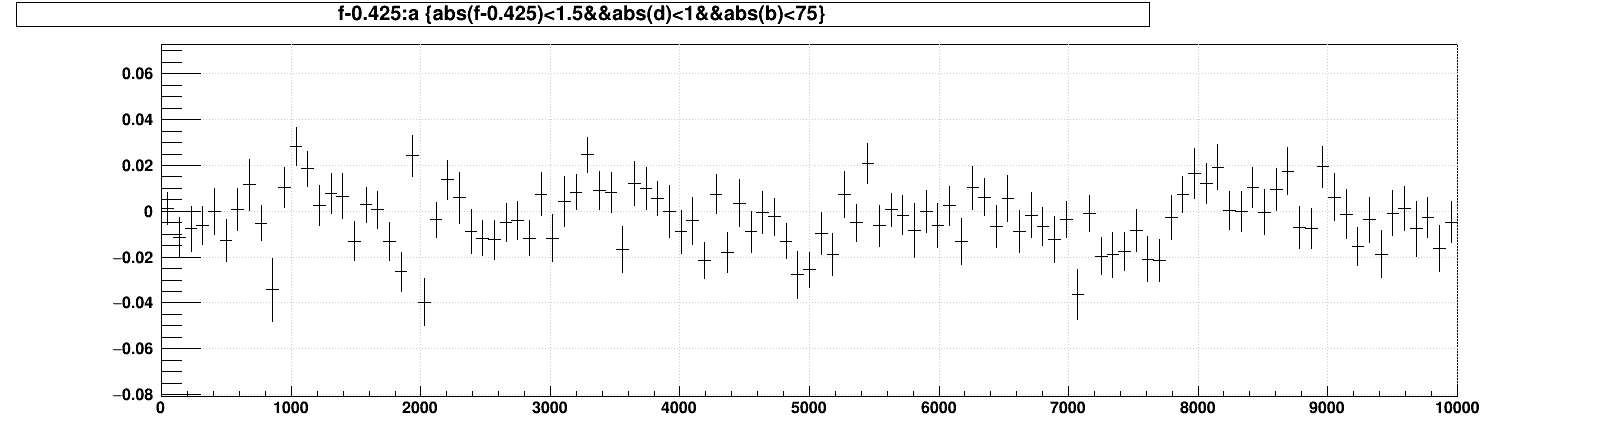
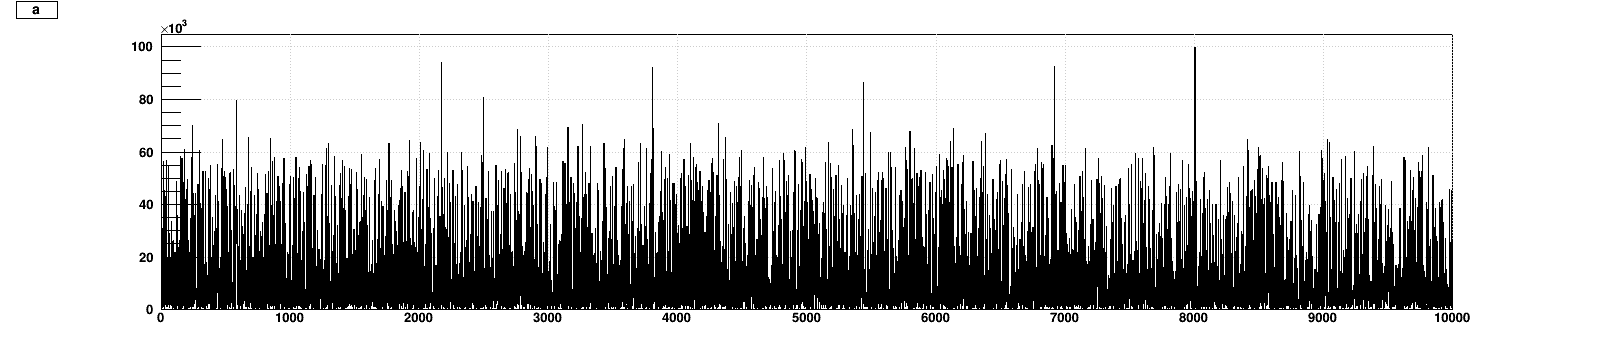
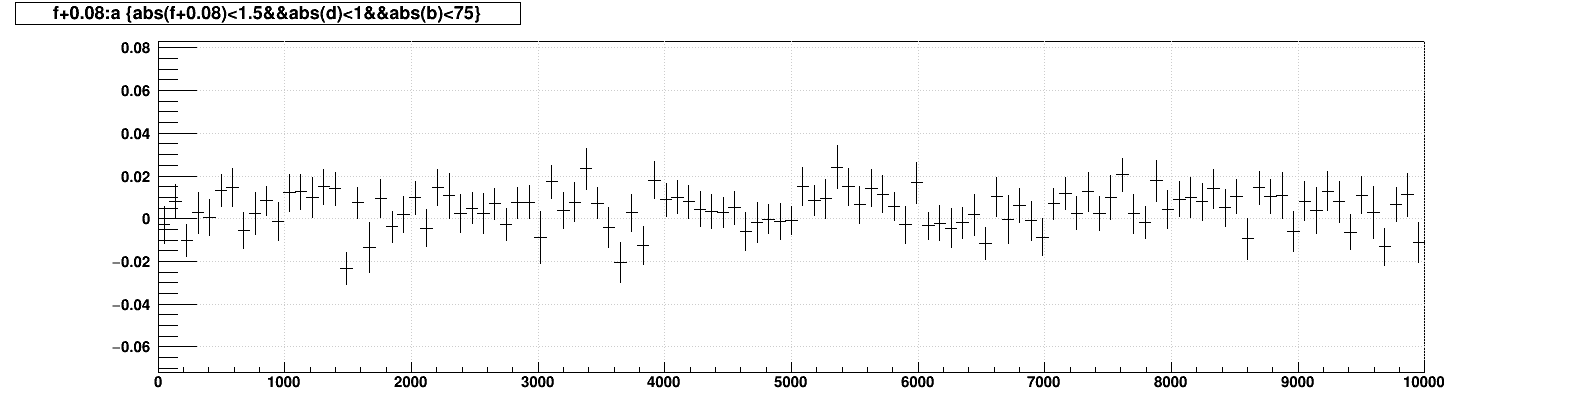
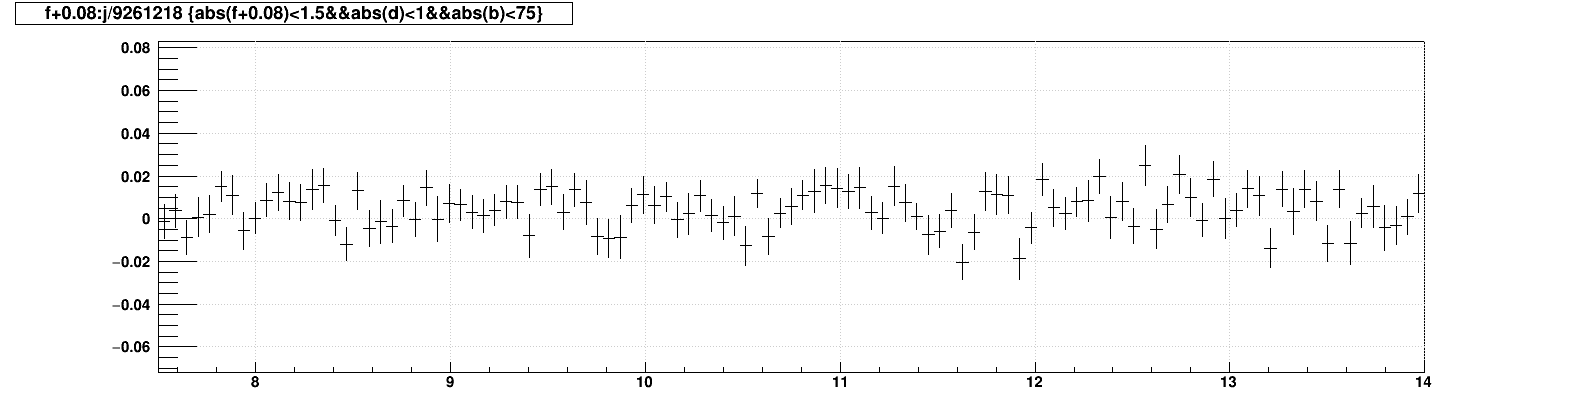
TPC clusters and sDCA vs. Event ID plots for run 19142035, and now things look steady state for space charge! I also added a plot of sDCA vs. time [seconds] by way of dividing bunch crossing number by the collider's bunch frequency (9361218 Hz), as Event ID is not guaranteed to be time-ordered. One can also see that there's still a bunch 113 component, but it is no longer problematic.
_____________
-Gene
Plots:
1) number of TPC clusters per event vs. event ID for the first 5000 events
2) signed DCA of tracks averaged over the whole TPC (|eta|<1) vs. event ID for the first 5000 events
3) number of TPC clusters per event vs. bunch ID (7 bit)
4) CPU processing time per event vs. eventID for the first 5000 events
These show clear jumps in the signed DCA of order 1 mm when the large events occur. Given that this is an average over the whole TPC, we can assume that some of the tracks are seeing larger than 1 mm effects.
NB: Even though the large events generally trigger on bunch ID 113, this does not mean that events triggered on other bunch IDs are immune. For example, I have seen events triggered on a collision in bunch ID 5, but there is still lots of charge arriving on subsequent arrivals of bunch ID 113 (i.e. the next large charge deposition arrives 108 crossings after the trigger instead of 120 crossings after, and then another deposition arrives 228 instead of 240 after, etc.).
-Gene
_______________
Update #1: Comparing to Run 11, using run 12174106 (5000 events from a single file)
Here are the TPC clusters vs. event ID, showing no big peaks:
Next is the TPC clusters vs. bunch ID, with the sum of all clusters from all events in that bunch ID on the left, and then the distribution of TPC clusters in events on the right:
The only notable peak in the abort gap seems to be at bunch ID=119, but it looks like normal events:
Next I use the data to enhance the charge step within the TPC. I use only time bins [80,320] to avoid other charge steps in the TPC (i.e. gating grid, triggered event), and then offset the time bucket distribution by the amount necessary to see events that occur from bunch ID 113 starting at time bin 40 in the plot: (time_bin + 160 + (triggered_bunch_ID - 113))%120. One can indeed see something of a step around 40:
For comparison, here is the same plot for Run 18 AuAu27. On the left is for events not triggered on bunch ID 113, and on the right are events triggered on bunch ID 113 (which is clearly a biased trigger towards showing the step):
If I compare the non-bunch-113-triggered charge step from Run 18 to the charge step in Run 11 (which didn't seem to trigger on 113 anyhow), I see that it is notably larger percentage-wise (~2.5/180 = ~1.4% vs. ~5/832 = ~0.6%). So in Run 18 we are both triggering on the bunch 113 events, and we're seeing more charge from bunch 113 events in other events.
I am a bit curious about the charge step shape clearly seen in the bunch-113-triggered events which has a small dip before the step and a peak just after the step. I have the following guesses:
- The peak might be due to these clusters actually being formed in or near the multi-wire chamber region of the TPC, and the clusters there may have different characteristics from standard clusters, leading to splitting into multiple clusters?
- The dip might possibly be the charge step at the other end of the drift (e.g. central membrane) from earlier bunch 113 events (early pile-up).
-Gene
____________________
UPDATE #2: a look at Run 19137029, which was expected to have reduced charge from abort gap events
Field cage currents seem to show an improvement
Below are the same 4 plots as at the top of this page but for run 19137029 (aside: this run was acquired at a notably higher trigger rate, so it takes more events to span each second). The big TPC Cluster events appear to be a factor of 2-3x smaller than for run 19133056 above....however...
....It looks like there's still SpaceCharge due to the abort gap events, and it appears to be about the same magnitude as before of nearly 1 mm on signed DCA! ?!?!
_________
UPDATE #3: looking at events from the very end of run 19137048, which was supposed to have both blue and yellow abort gap cleaning turned off
Same 4 plots again, looking very clean all around! This is how we would really like it to be!
_____________
UPDATE #4: looking at events from the very beginning of run 19137048, which was supposed to have just yellow abort gap cleaning turned off
Same 4 plots again, with lots of space charge. The blue gap cleaning really made the difference.
_____________
UPDATE #5: looking at events from the very beginning of runs 19139022, 023, 024
Running some jobs concurrently caused some extra CPU time, so ignoring the CPU time plot, here are....
...the same as plots 1-3 from the top of this page again, which seem to show increasing contributions of abort gap events, and of space charge fluctuations.
Run 19139022:
Run 19139023:
Run 19139024:
_____________
UPDATE #6: looking at runs where the abort gap repetition rate was supposed to be increased from 1 Hz to 10 Hz, specifically looking at runs near the end of fills where the amount of charge dumped into STAR from abort cleaning has typically been largest
TPC clusters and sDCA vs. Event ID plots for run 19141030, but things look the same...perhaps the switch to 10 Hz was not actually done?
TPC clusters and sDCA vs. Event ID plots for run 19142035, and now things look steady state for space charge! I also added a plot of sDCA vs. time [seconds] by way of dividing bunch crossing number by the collider's bunch frequency (9361218 Hz), as Event ID is not guaranteed to be time-ordered. One can also see that there's still a bunch 113 component, but it is no longer problematic.
_____________
-Gene
»
- genevb's blog
- Login or register to post comments