- genevb's home page
- Posts
- 2024
- 2023
- 2022
- September (1)
- 2021
- 2020
- 2019
- 2018
- 2017
- December (1)
- October (3)
- September (1)
- August (1)
- July (2)
- June (2)
- April (2)
- March (2)
- February (1)
- 2016
- November (2)
- September (1)
- August (2)
- July (1)
- June (2)
- May (2)
- April (1)
- March (5)
- February (2)
- January (1)
- 2015
- December (1)
- October (1)
- September (2)
- June (1)
- May (2)
- April (2)
- March (3)
- February (1)
- January (3)
- 2014
- 2013
- 2012
- 2011
- January (3)
- 2010
- February (4)
- 2009
- 2008
- 2005
- October (1)
- My blog
- Post new blog entry
- All blogs
TPC hits: 32-bit vs. 64-bit
Updated on Thu, 2019-03-21 14:39. Originally created by genevb on 2019-03-20 16:51.
Executive summary of the contributions to differences in TPC hit positions between 32-bit and 64-bit:
All hit position differences can be understood to be shifted due to the resolution of a float's 24-bit mantissa contributing in the following ways:
- The z position of the hit due to the drift velocity value as a float
- The transverse position of the hit due to the values of (y,x) as floats when the hit was treated at times in its history with Cartesian coordinates
- The transverse position of the hit due to the values of (r,phi) as float when the hit was treated at times in its history with polar coordinates
Below are the details of my study.
___________________
(Jason's findings to-date were presented You do not have access to view this node)
Using event.root files Jason generated in trying to examine differences in running in 32-bit vs. 64-bit, I obtained the TPC hits positions and looked at their differences. First, what's the same:
- The number of TPC hits
- Hardware coordinates (sector [integer], row [integer], pad position [float], time bucket position [float])
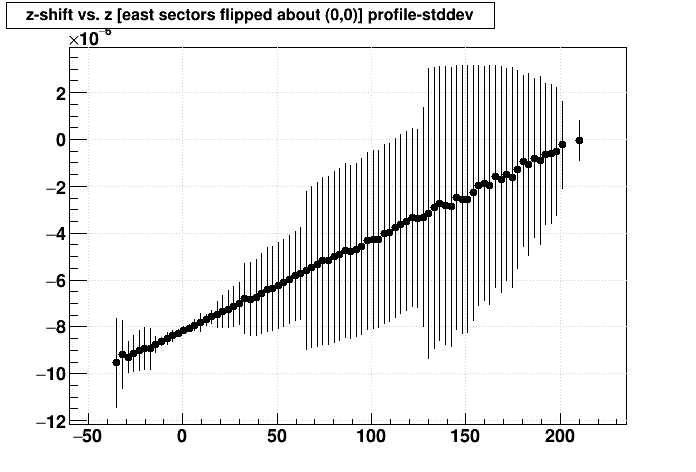
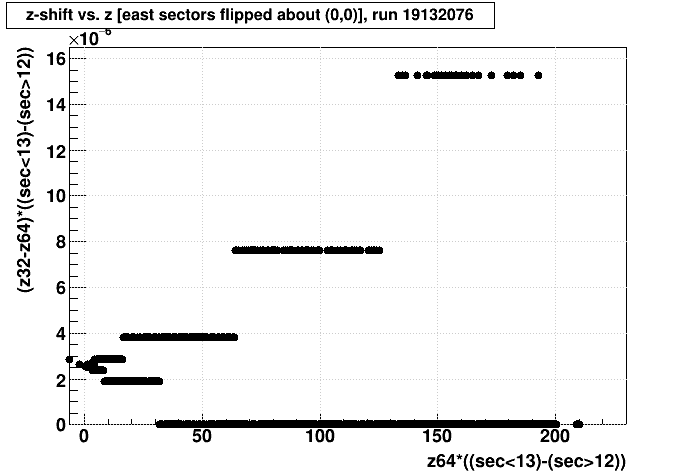
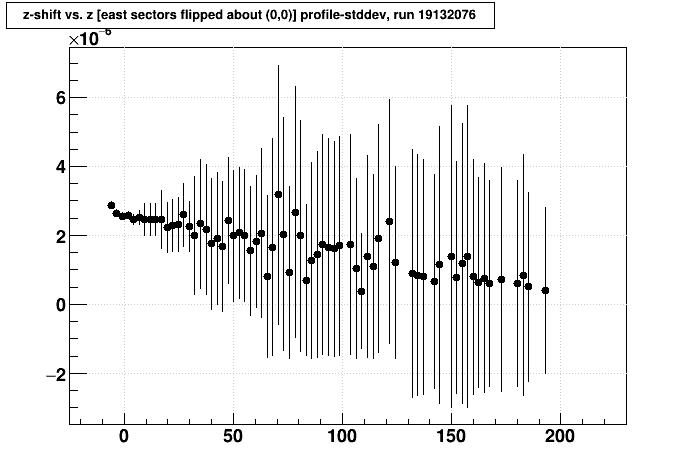
What can be different are the x,y,z position values, stored as float. Here are some plots of the absolute differences, where the plot on the left shows the raw data, and the plot on the right is the profile whose error bars show the standard deviation:
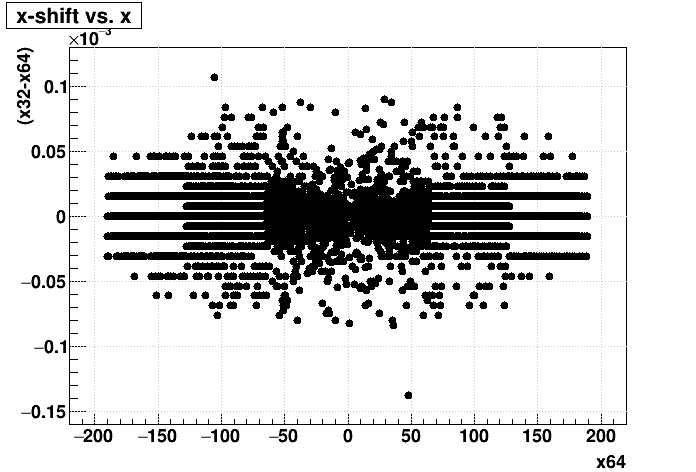
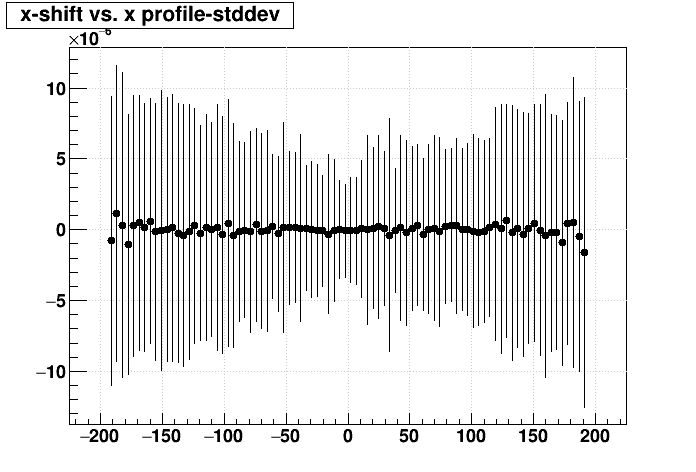
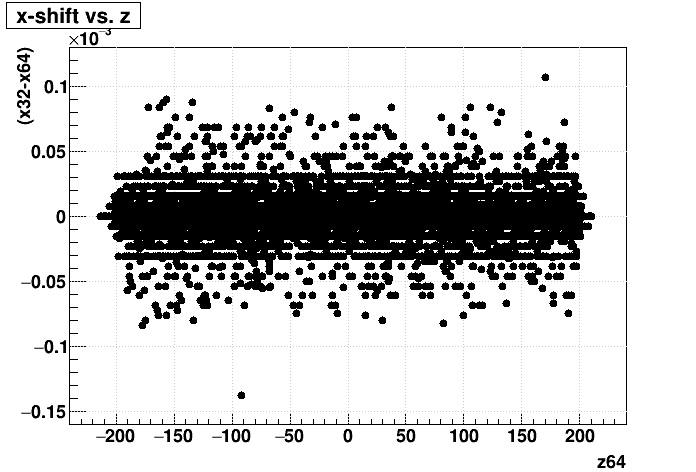
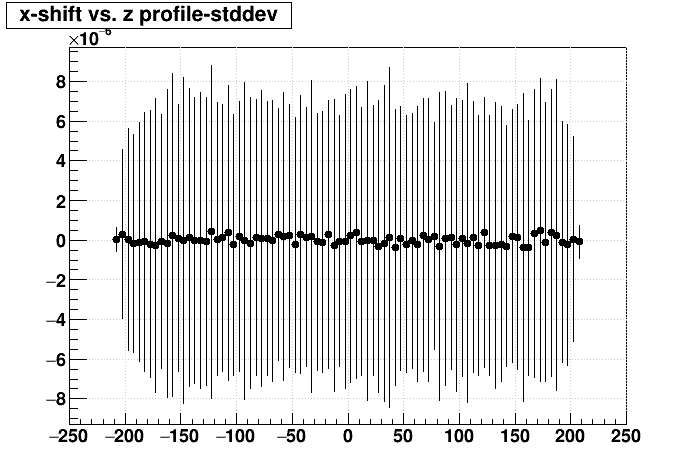
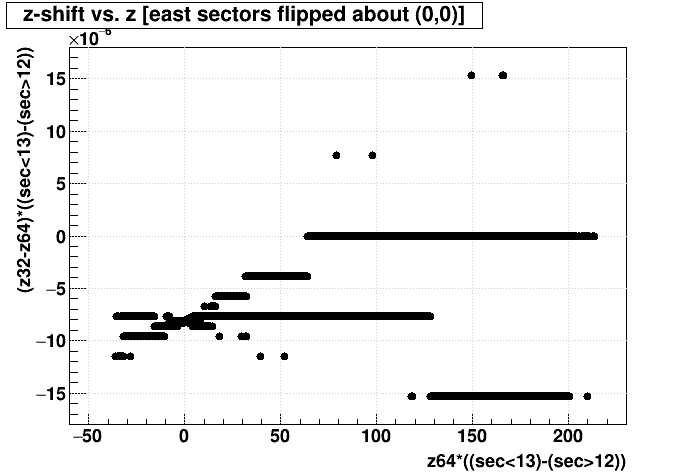
From the above plots, we see that x-shift has no dependence on z, and while there is no biased dependence on x, the resolution of x-shift grows with |x| at the level of about 1 part in a little more than 107, which is as expected with the 24-bit resolution of a floating point mantissa (224 = ~1.7 x 10⁷). The y-shift plots look similar.
The above z-shift vs. z plot shows the same resolution growth with |z|, and it's even clear that there are steps in the resolution when |z| exceeds factors of 2 (i.e. there are steps in the error bars at |z| = 32, 64, 128). But even more striking is the clear linear bias of z-shift with z. The bias goes to 0 at |z| ~ 210 (zero drift length), and linearly grows to 8e-6 at z = 0 (full drift length). So (z-shift)/(drift length) = 4e-6. This can be re-phrased as having the wrong drift velocity (or the wrong clock frequency) by 1 part in 2.5 x 10⁷. Again, this is of similar scale to the resolution of a float. But...
...Why should this appear as a bias instead of as a smearing if it is, for example, just the impact of the resolution of a float on the drift velocity value? The answer may be that for all of the data shown here, only a single value of the drift velocity is used. One would need to sample the drift velocity over a few different instances of its value to see smearing instead of the bias of a single value. So, Jason helped me do just that...so here are the z-shift vs. z plots for three other runs:
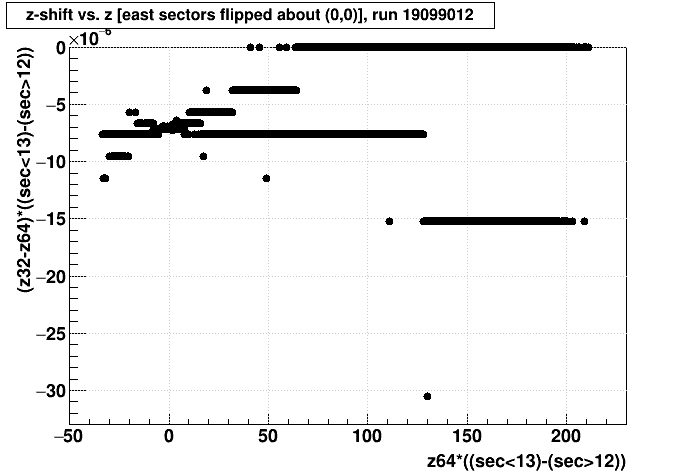
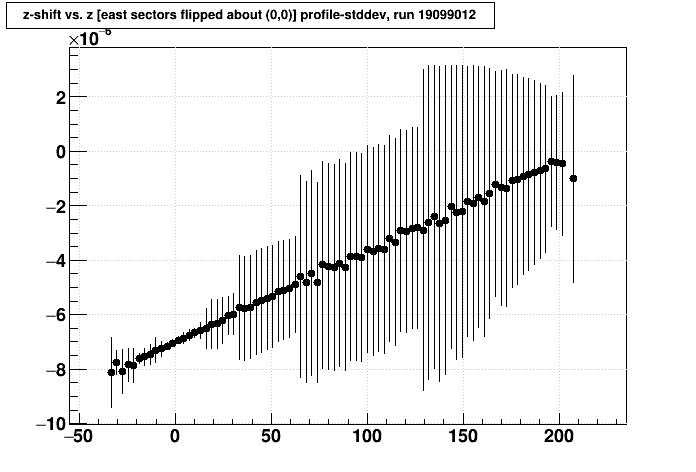
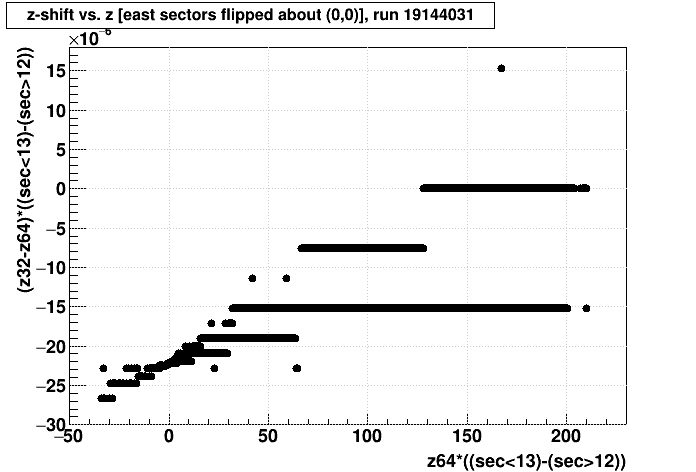
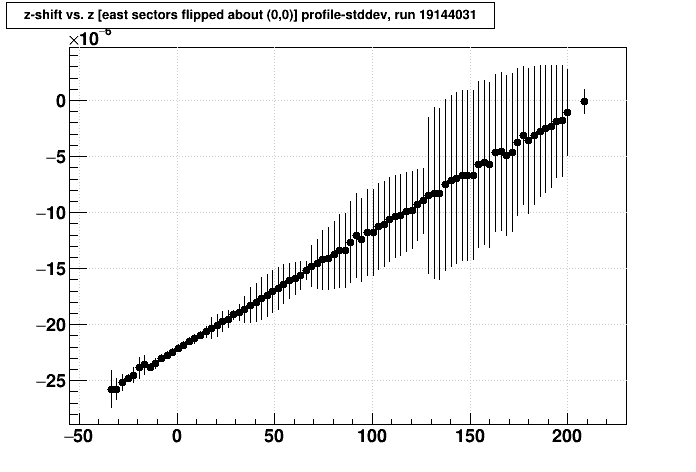
So there does appear to be a variation in the z-shift dependence on |z|. In rough numbers, the above 3 runs have drift velocities that have changed by 1 part in 3 x 10⁷, -10 x 107, and 1 x 10⁷ respectively. The variance of these values seems compatible with a standard deviation on the order of the resolution of a float. I think drift velocity is the more likely culprit than clock frequency because the clock frequency should not change from run-to-run, so any 32- vs. 64-bit effects should be constant.
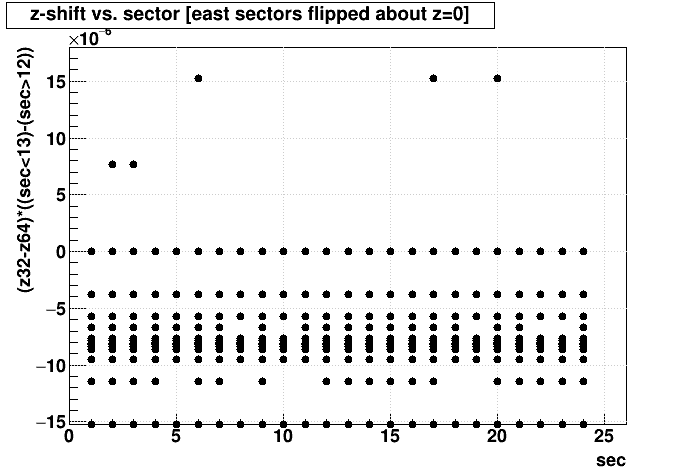
Another aspect to consider is whether there is any azimuthal and/or sector dependence. Here are absolute x-, y-, and z-shift vs. sector:
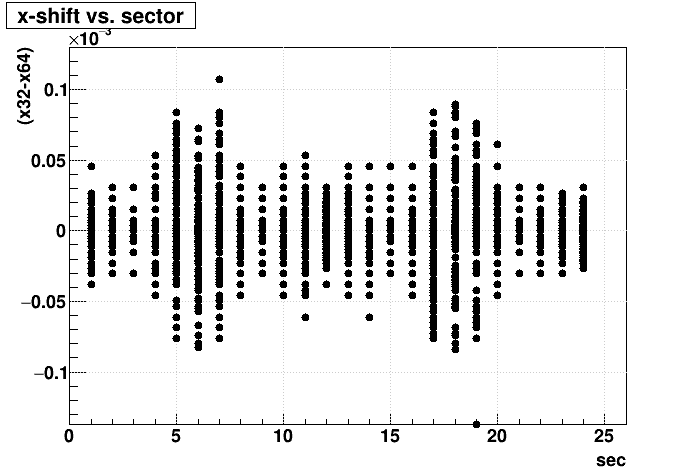
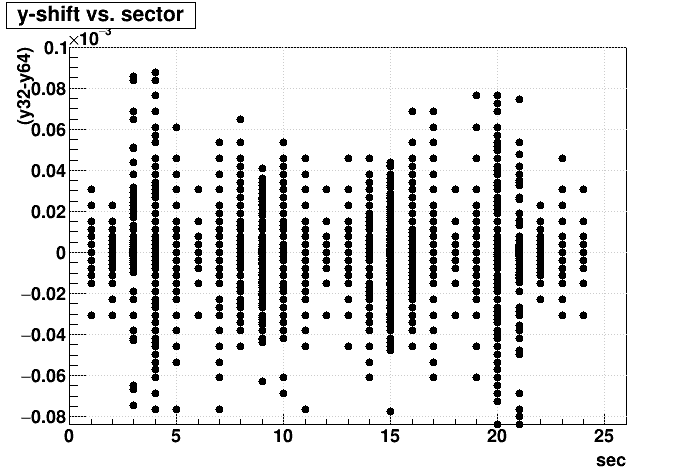
The x- and y-shifts do show a sector (or azimuthal) dependence in their distributions. Interestingly, the distributions are consistent with something that was easily missing in the x-shift vs. x plot shown earlier: while there is a general increase in the standard deviation with larger |x|, the tails of the distribution are actually longest at small |x|. So the sectors where |x| is small (particularly for back-to-back 6 & 18, but not so much for 12 & 24?) are where the tails in x-shift stretch out the farthest. The y-shift tails seem to be longest for back-to-back sectors 4 & 20 (and maybe 9 & 15?). I do not understand this.
The z-shift does not appear to show any azimuthal nor sector dependence.
____________
Update 2019-03-21
I tried to understand the reason for the tails in the x-shift and y-shift in sectors where x and y were respectively small. So I looked at other dependencies and noticed this peculiar behavior of a linear dependence in the x-shift on y:
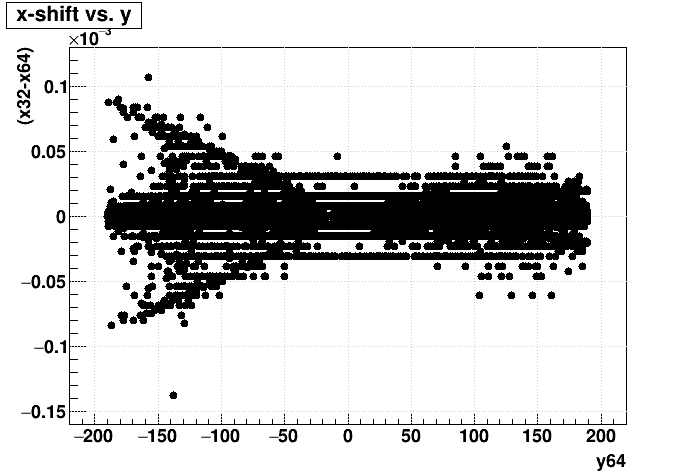
To look at it a little more closely, I took the absolute value of the x-shift, and then also drew |y-shift| vs. x:
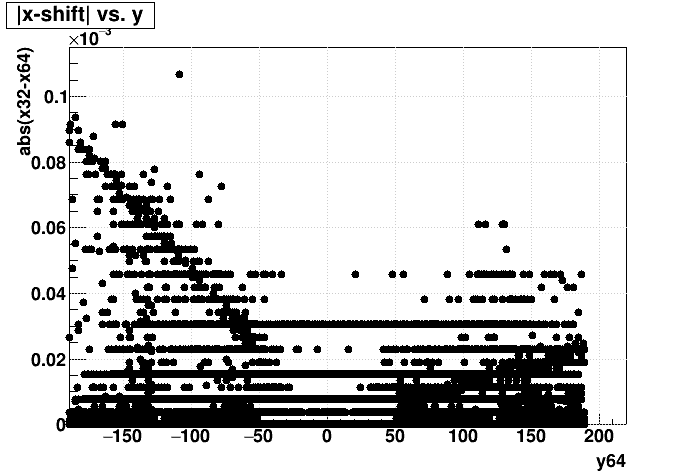
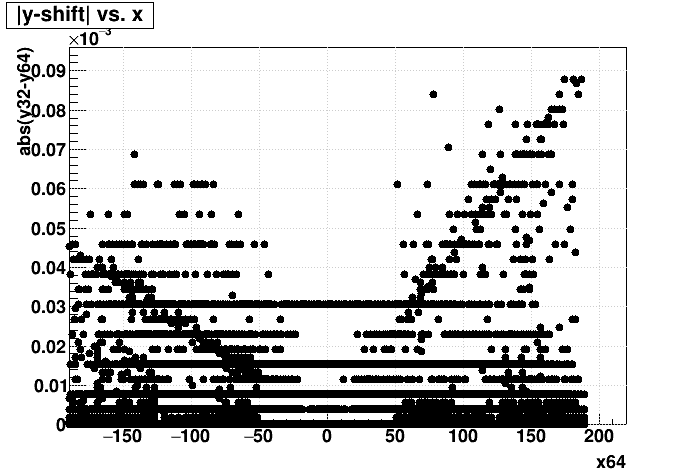
What I see is what appears to be a radial (not pad row!) dependence that differs on opposite sides of the TPC. So I decided to look at radial and azimuthal shifts...
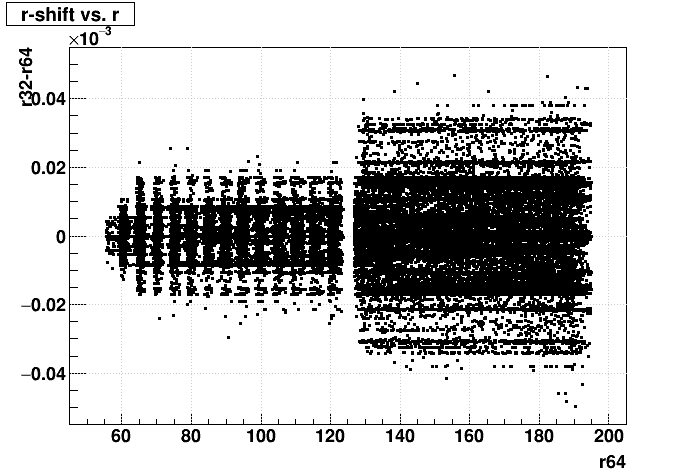
(Note: at this point, I also increased my statistics from 1 event to 5 events, and I used smaller markers to make the picture clearer.)
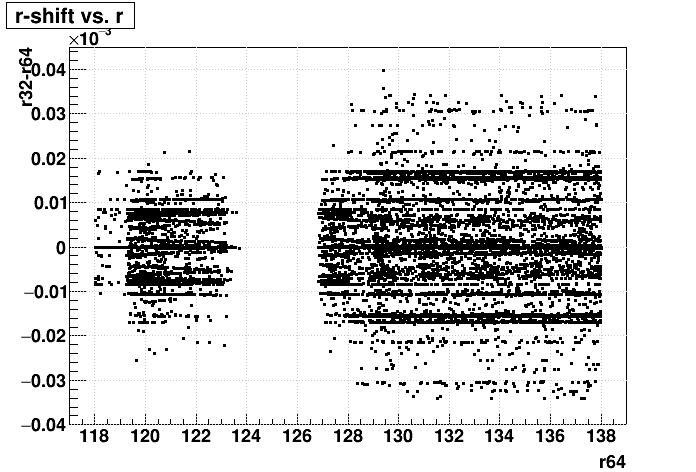
Radial shifts show a clear increase in variance with the radius, and zooming in it appears to happen at 128, a multiple of 2, and probably also at 64; and the order of magnitude of the relative shift is again close to a part in 107:
Azimuthal shifts show a clear increase in variance with phi at multiples of 2 when using [0,2pi], and again at about a part in 107:
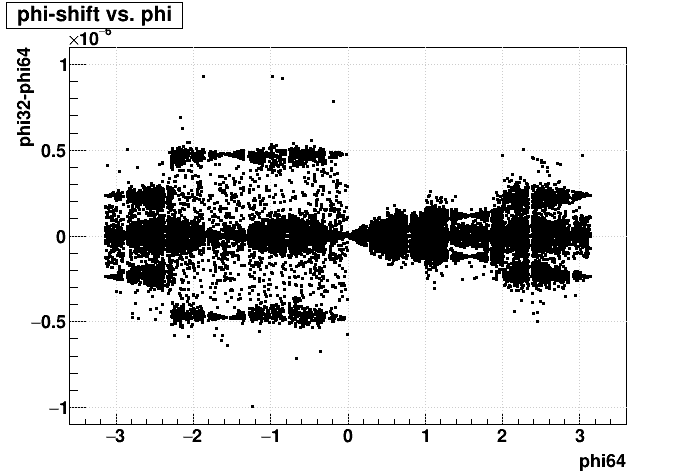
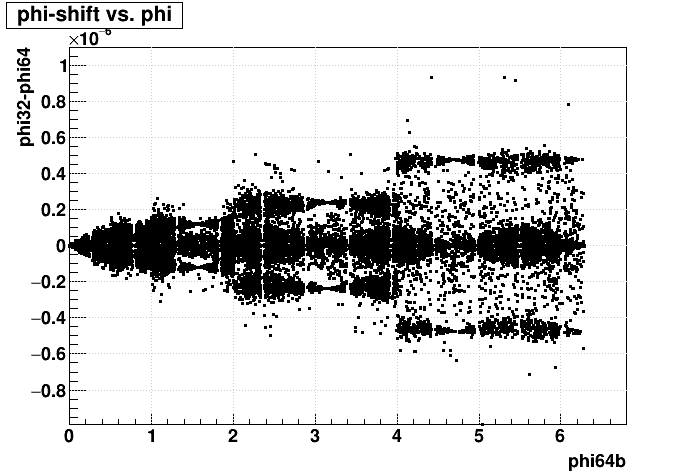
Here are the cross dependencies for r and phi, which don't seem too revealing:
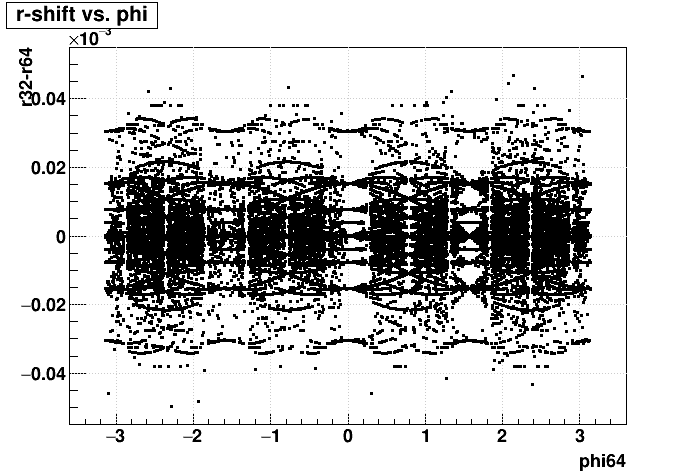
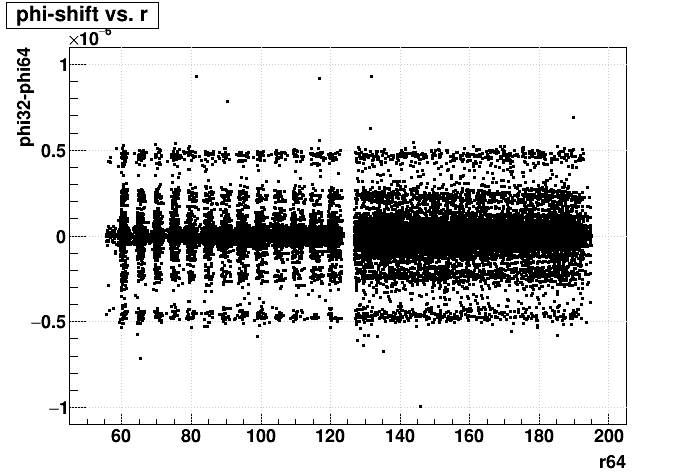
My conclusion from the above plots is that at some time in their history, the hit positions are represented in polar (r,phi) coordinates, and the 24-bit resolution of the float mantissa affects the position in these coordinates. This is in addition to the impacts of the float mantissa resolution while the hit positions are in Cartesian (x,y) coordinates.
____
I then considered what might most affect tracking. Under the assumption that tracks are predominantly radial in orientation, I looked at the actual distance of the shift in the azimuthal direction (orthogonal to a track), using (phi-shift * r) instead of just phi-shift. Here are plots of that quantity, first the profile vs. phi (error bars are standard deviation), then vs. (x,y) but using a profile of the absolute value as a proxy for the variance:
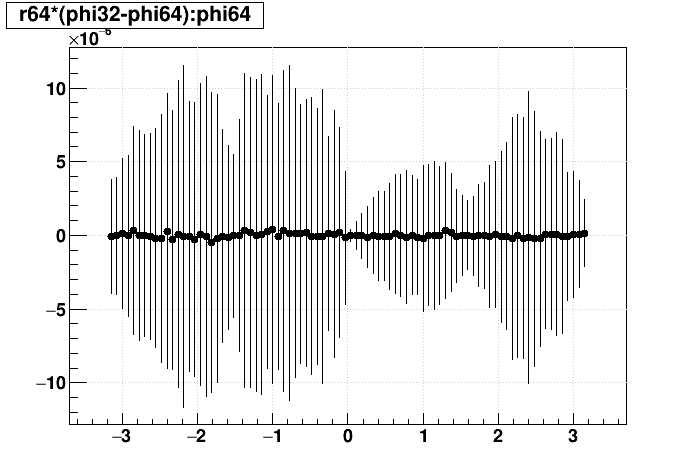
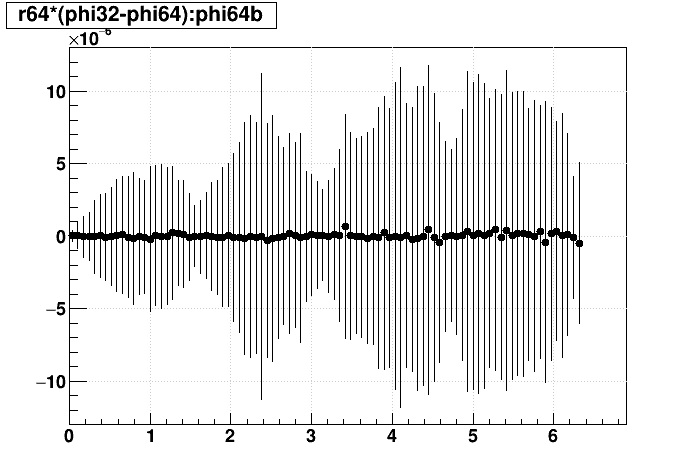
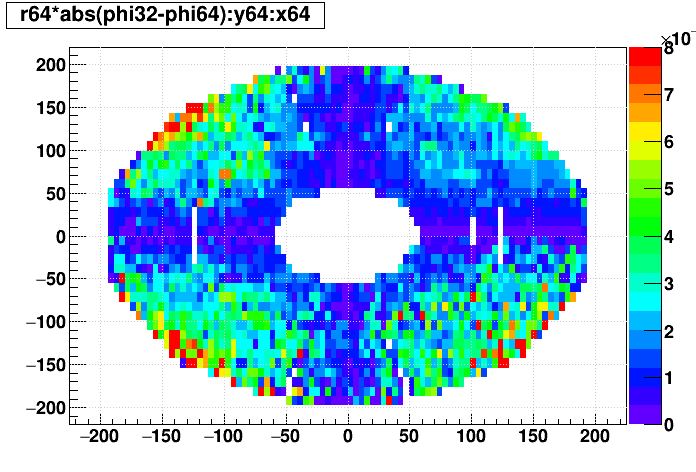
What we see is that the variance increases:
- as radius increases : presumably from the resolution of r when the hit position was in polar coordinates
- in the diagonal corners : presumably from the resolution of x and y when the hit position was in Cartesian coordinates; while the variance in x is maximal where y is near 0, that doesn't contribute to the variance seen in (phi-shift * r); at the diagonal corners the variance in x and y both contribute
- as phi increases : presumably from the resolution of phi when the hit position was in polar coordinates
It appears to me that everything in the hit positions can be understood.
-Gene
»
- genevb's blog
- Login or register to post comments