FGT thermal model
I've just completed the first set of thermal model measurements, which have included two new channels: temperature measurements of the input and exhaust.
This now allows the values to be analyzed relative to the temperature of the input air, which might vary from the lab here at MIT to the STAR hall. And also to note any variations associated with the ambient temperature in the lab.
The first set of measurements is taken with the fan on as low as it will go, which corresponds to roughly 6 liters/ second. This choice was made as a baseline, as having the fan completely off is not as meaningful a comparison.
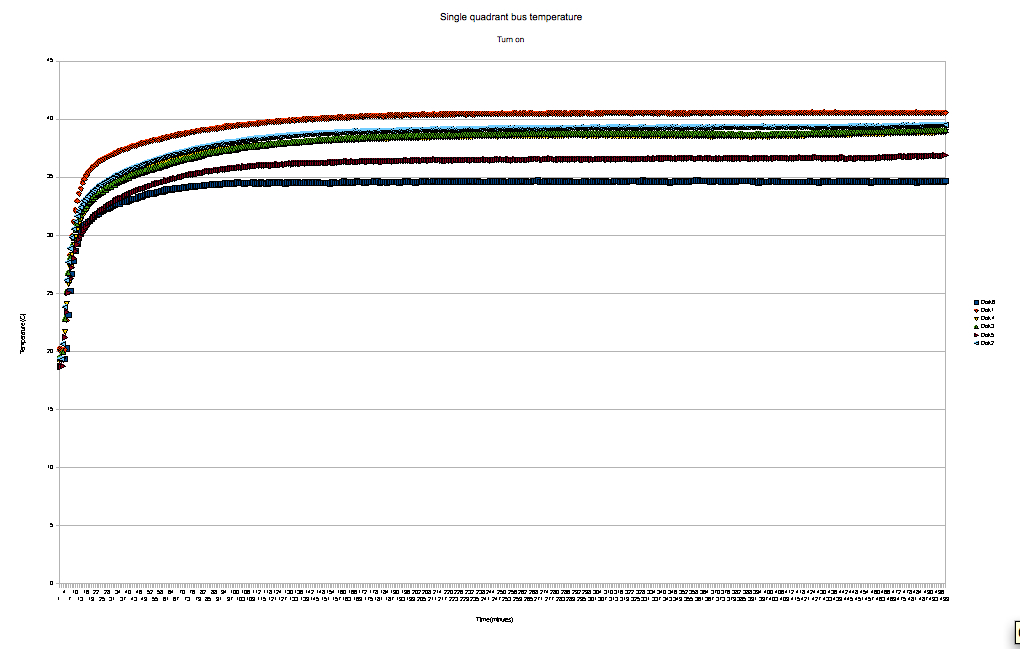
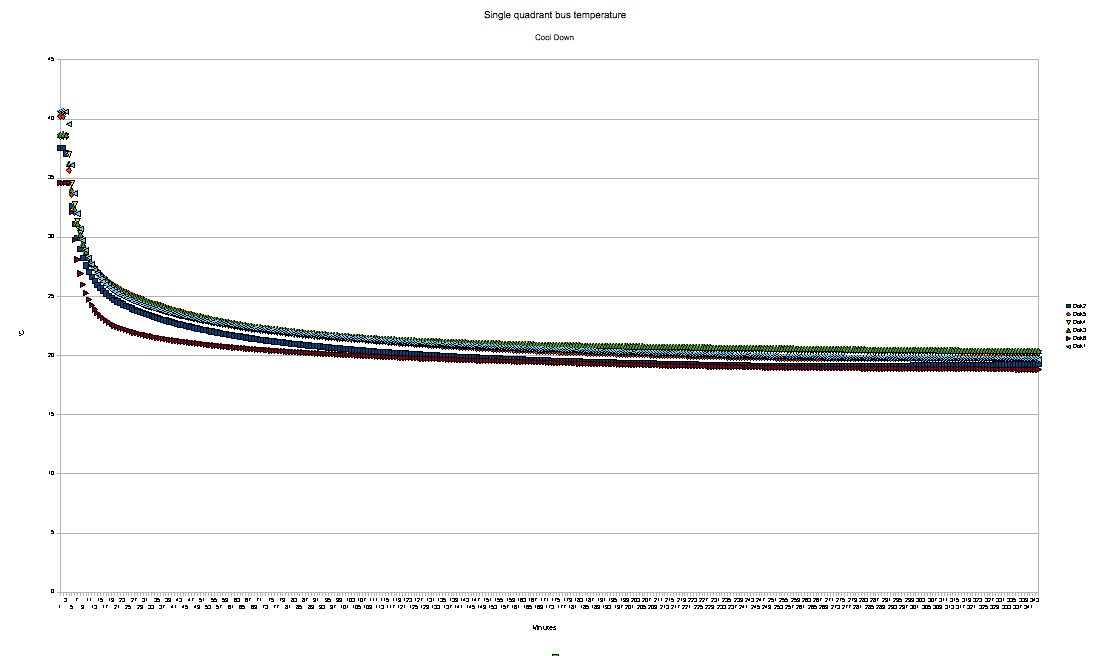
I've presented here the turn-on and cool down curves for each disk. The quantity graphed is the temperature from one quadrant averaged over the three bus-mounted thermocouples (labeled as channels 2, 3, and 4 in the diagram). The primary things to note are that the device reaches an equilibrium in about 3 hours and that the stable temperature rises as a function of the disk's depth. We expect to see this time increase with more airflow, and final temperatures could even out with some creative manipulation of the vents.
I've also provided these measurements formatted as csv files. the new channel (column) listings are:
( See picture for positions)
0 Time in minutes (each row has all measurements in one given minute.)
1 disk A, quad 1 (right), heat source
2 " " outer board bus
3 " " inner board bus
4 " " inner board bus
5 " quad 2 (lower), heat source
6 " " outer board bus
7 " " inner board bus
8 " " inner board bus
(9-16) repeats for quadrants 3(left)&4
17 on disk lower, inner air temp
18 on disk lower, outer air temp
19 on disk upper, inner air temp
20 INPUT AIR
(21-39) repeats for the other disk
40 Exhaust air
The filenames are of the format (disk A).(disk B)_fanSpeed_m.dd (e.g 6.1_minFan_7.23 is a minimum airflow run measuring disks 6 and 1, taken on the 23rd of July)
.png)
- jphw's blog
- Login or register to post comments