Run6 FPD Single Photon Analysis
Related analysis pages
Talk at Berkeley Collaboration meeting, Oct. 09
Single Photon Splitting Filter
For all following simulation analysis, (but not data) we only look at the events where photons landed in the central 5X5. This is to remove any edge effects, which is largely irrelevant to high energy pi0s and single photons when we impose reasonably small center cut. It is also difficult to normalize the edge events with respect to the inner events in the absence of realistic xF-pT spectrum. For present purposes, therefore, we only concentrate on the inner events.
To the existing flat-distribution GSTAR simulation, I've now added digitization efffects and some noise. I've used the gain correction file to calculate the ADC values, and added gaussian noise with sigma=0.9 ADC count. Turns out, this actually makes a very significant difference for the issue of single photon splitting.
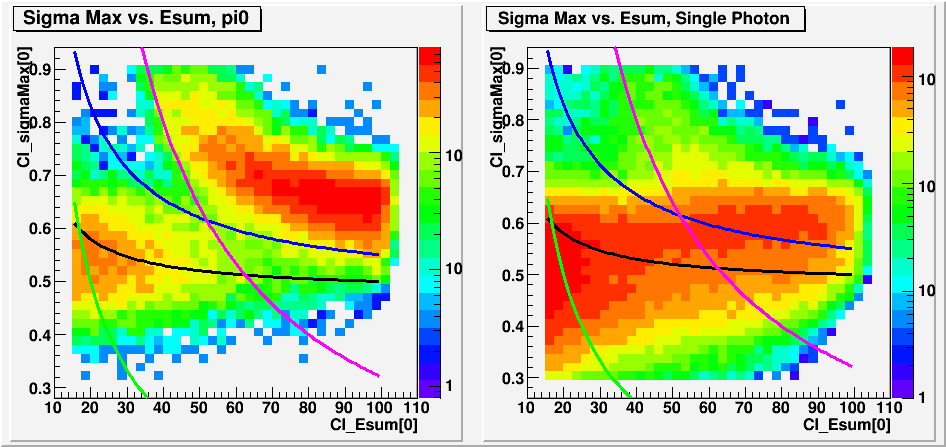
Fig. 1 Pi0 Cluster sigma max distribution for the previous reconstruction (Black) and the current version with digitization and noise (Red)

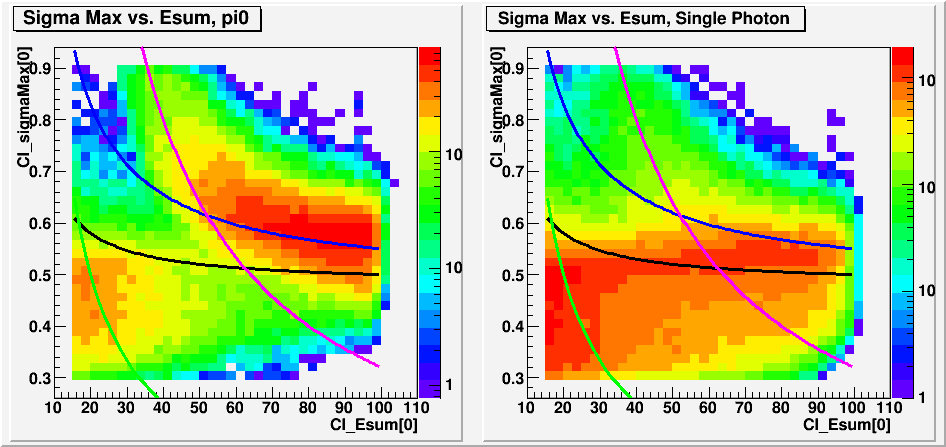
Apparently the removal of very soft towers by digitization reduces the average width of the cluster significantly. With this, the effect of cluster categorization changes as following.
Fig 2. Cluster SigmaMax vs. Cluster Esum, No digitization

Fig 3. Cluster SigmaMax vs. Cluster Esum, with digitization and noise

Now a good fraction of pi0s will fall into category 0, which can be reconstructed to single photons. On the other hand, most of the single photon clusters now avoids category 2. Previously, the mis-categorization of the single photons was the major source of single photon splitting.
With this change, we expect a significant drop in the single photon splitting porbability, which used to be over 50% at E>60GeV. And it does.
Fig. 4
.gif)
Black represents the splitting probability purely due to reconstruction, while Blue is after we apply the Single Photon Splitting Filter.
The filter catches what it thinks is a split single photon by looking at the reconstructed separations and mass in different Zgg regions. With proper Zgg cuts, one can usually identify a peak that is characteristic of split photons. More details about this filter can be found here.
In the actual data analysis, once a photon pair is identified as a split single photon by the filter, it gets merged at photon list level. The obvious side effect of this is that real pi0s can turn into single photons.
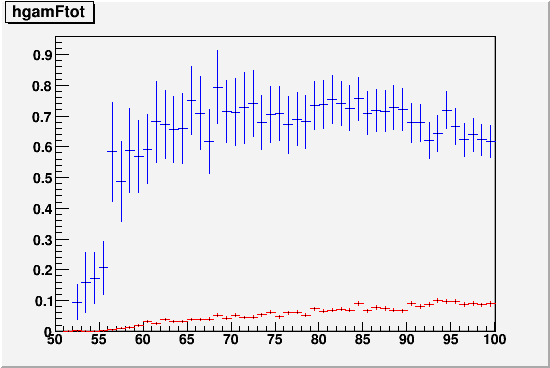
Fig. 5 Probability for the Splitting FIlter to catch split photons (Blue) and to merge real pi0s into fake single photons. (Red)

So the filter can catch about ~70% of the split single photons, but it also falsely identifies ~5% of the real pi0s to be split single photons.
Now we look at the probability of photon pairs turning into a single photon, which gets worse due to the filter.
Fig 6.
.gif)
Here Black represents the 2-to-1 probability purely due to reconstruction. Red is after including the effect of the Splitting Filter.
So it becomes clear that with the digitization reducing the size of clusters, 2-to-1 can actually be more of a problem than 1-to-2. The filtering should do a nice job in getting rid of single photon signals from pi0s, while the negative effect on adding pi0's to single photons is relatively small compared to the normal effect.
Problem is that it is very difficult to catch the pi0's that turned into single photons. Since we only have one photon, the usual kinematic variables like energy sharing, mass, and decay angle are all undefined. We can look at the cluster variables, and while they do show some difference for fake single photons vs. real ones on average, the distibutions tend to largely overlap and I haven't found something that I can cut on yet.
To the extent that the simulation is still limited by the flat distribution of particles, now we know the probability of single photon splitting, two photon merging, and the effect of the filter as functions of energy. Based on this, we can try to do a rough counting exercize to estimate the signal to background for pi0 and single photon events. We define following variables per energy bin.
Npi0=Number of pi0's, including geometrical acceptance. That is, all pi0s that fit in the FPD.
Ngam=Number of single photons, including geometrical acceptance. "Single photon" means simply those events where one and only one photon hit the FPD, regardless of the origin of that photon. It can be direct, half of pi0, half of Eta, etc.
n1=Number of 1 photon events in record, after applying the splittiing filter
n2=Number of 2 photon events in record, after applying the splittiing filter
R12=Fraction of single photons that split into two
R21=Fraction of photon pairs that get merged
Fpi0=Fraction of pi0's that get merged by the splitting filter (Filter side effect)
Fgam=Fraction of split single photons that get caught by the splitting filter (Filter effect)
Then we can express the observed number of 1 and 2 photons events as following.
n1 = Ngam (1 - R12(1-Fgam)) + Npi0 (R21 + Fpi0)
n2 = Ngam * R12 (1-Fgam) + Npi0 (1 - (R21 + Fpi0))
This allows us to estimate the actual number of pi0s and single photons in the detector, and how many of them end up in the wrong box.
For the following plots, the color schem is given by,
Black: Actual observed number of events for the given number of photons.
Green: Estimated number of the signal particles within the geometrical acceptance.
Blue: Estimated number of observed signal particles.
Red: Estimated number of observed background particles.
The difference between Blue and Green is the efficiency for the signal particle. The difference between Blue and Red is the signal to background, and they add up to Black.
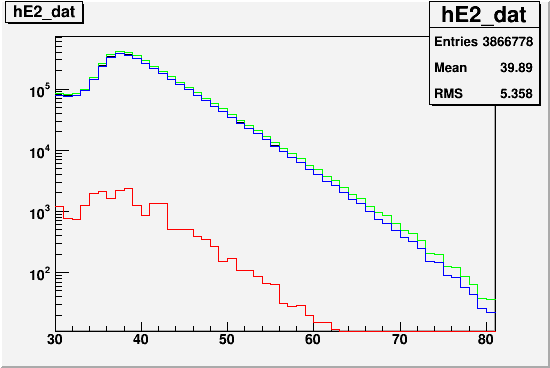
Fig. 7 Estimated number of events for single photon signal(Blue) and merged pi0 background(Red)

Fig. 8 Estimated number of events for pi0 signal(Blue) and split single photon background(Red)

This suggests, to the extent that we trust the current simulation, that "pi0" events at high energy with Splitting Filter applied are probably quite free from single photon background. (contamination on the order of a few percent) This is also consistent with the lack of obvious single photons splitting peaks in the pi0 mass spectrum, which looks very healthy up to 70 GeV. On the other hand, the "single photon" event sample may be contaminated significantly by pi0's. It seems that above ~65GeV, the signal to background is actually worse than 1:1.
Keeping this in mind, here are some asymmetry plots with 60% nominal polarization, no fiducial cut, no min bias, and with the Siplitting Filter in effect. We vary the center cut, which can be viewed as isolation cut for the single photon events. It also changes the importance of the edge events, the effect of which we have overlooked in this analysis. The signal to background estimate above is likely the most relevant to the results with reasonable center cut.
Fig. 9 A_N with No Center Cut

Fig. 10 A_N with Center Cut at r<0.25

Fig. 11 A_N with Center Cut at r<0.15 (What we did for the prelim Eta result)

- leun's blog
- Login or register to post comments
