Coherent Diffraction of rho mesons off Au Nuclei in the STAR detector at RHIC
Abstract:
The STAR Collaboration reports on the photoproduction of π+π− pairs in gold-gold collisions at a center of mass energy of 200 GeV/nucleon. These pairs are produced when a nearly-real photon emitted by one ion scatters from the other. The differential cross-section dσ/dt clearly exhibits a diffraction pattern, compatible with scattering from a gold nucleus, with 2 dips visible. We fit the π+π− mass spectrum to a combination of ρ0 and ω resonances, plus a direct π+π− continuum; the ratio of ρ0 : direct π+π− is consistent with previous measurements in lighter systems. The ω component is considerably larger than is expected from the measured ω photoproduction cross- section and ω → π+π− branching ratio, in accord with previous studies. This may be due to ρ/ω mixing, since ω → π+π− is disallowed by G-parity.
PACS numbers: 25.75.Dw, 25.20.Lj, 13.60.-r
.png)
FIG. 1. The black histogram shows the distribution of the pion pair transverse momentum. The clear peak below 100 MeV/c is from the decay of coherently produced π+π− pairs. The red histogram shows the distribution of the pair momentum for equal sign pion pairs. Both histograms are filled with selected pairs originating from vertices with only two tracks.
.png)
FIG. 2. The π+π− invariant-mass distribution for all selected ππ candidates with pT < 100 MeV/c. The black markers show the data (in 2.5 MeV/c2 bins). The black curve is the modified So ̈ding fit to the data in the range 0.6 < Mππ < 1.3 GeV. The ρ0 Breit-Wigner component of the fitted function is shown with a red-dashed curve and the constant non-resonant pion pair component is displayed with a black-dashed one. The interference between non-resonant pion pairs and the ρ0 meson is shown with a blue-dashed curve and a small third order polynomial shown with a cyan-dashed curve is used to account for a remnant background.
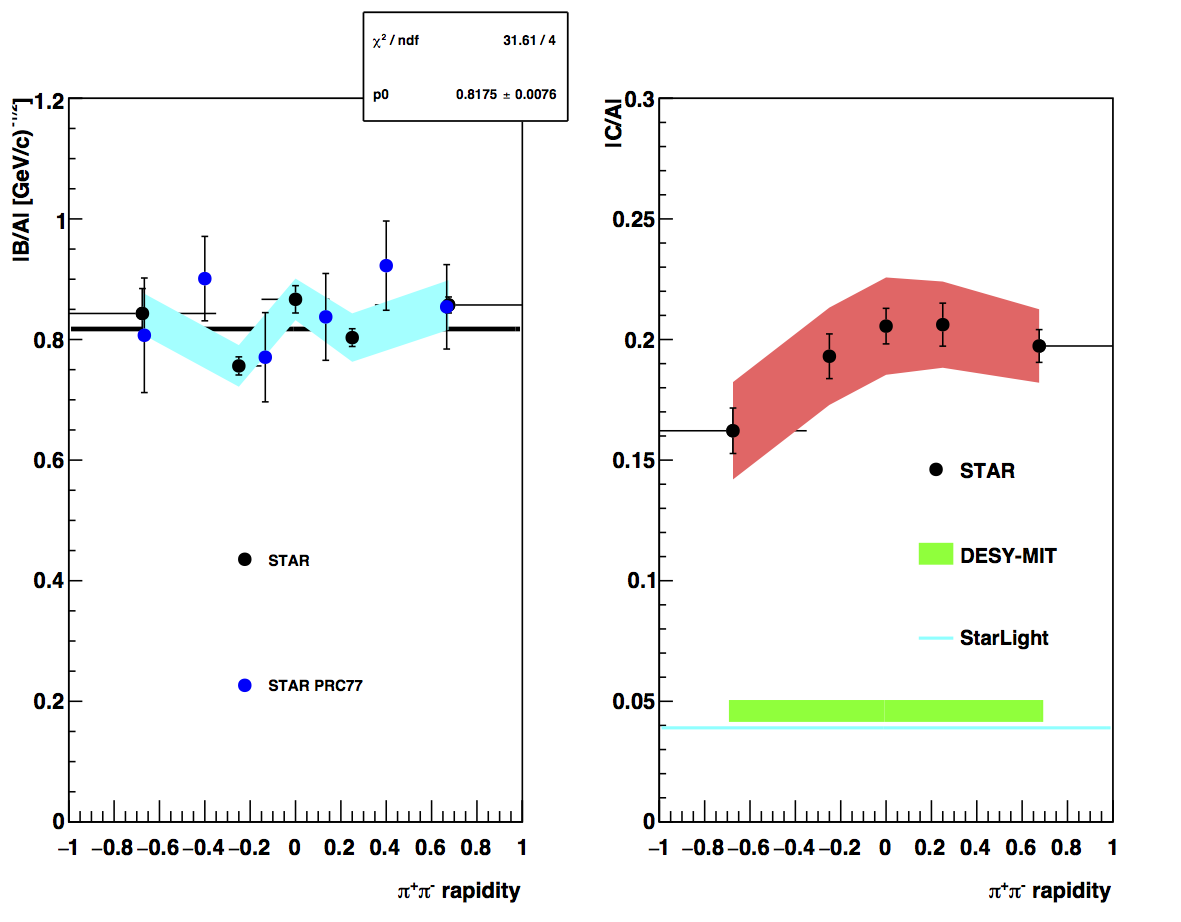
FIG. 3. The left panel shows the B/A ratio of amplitudes of non-resonant π+π−and ρ0 mesons. The STAR published results for that ratio are shown with blue-filled circles. The right panel shows the ratio C/A of the ω and ρ0 amplitudes. The STAR measurement is shown with red markers together with the red band as wide as the allocated systematic uncertainties identified for this measurement. The magnitude of DESY- MIT measurement is shown with a line because the rapidity of these two measuremnts do not overlap. The thin cyan line shows the value of the C/A ratio calculated with cross- sections generated by StarLight and the measured branching ratio for the ω → π+π− decay.
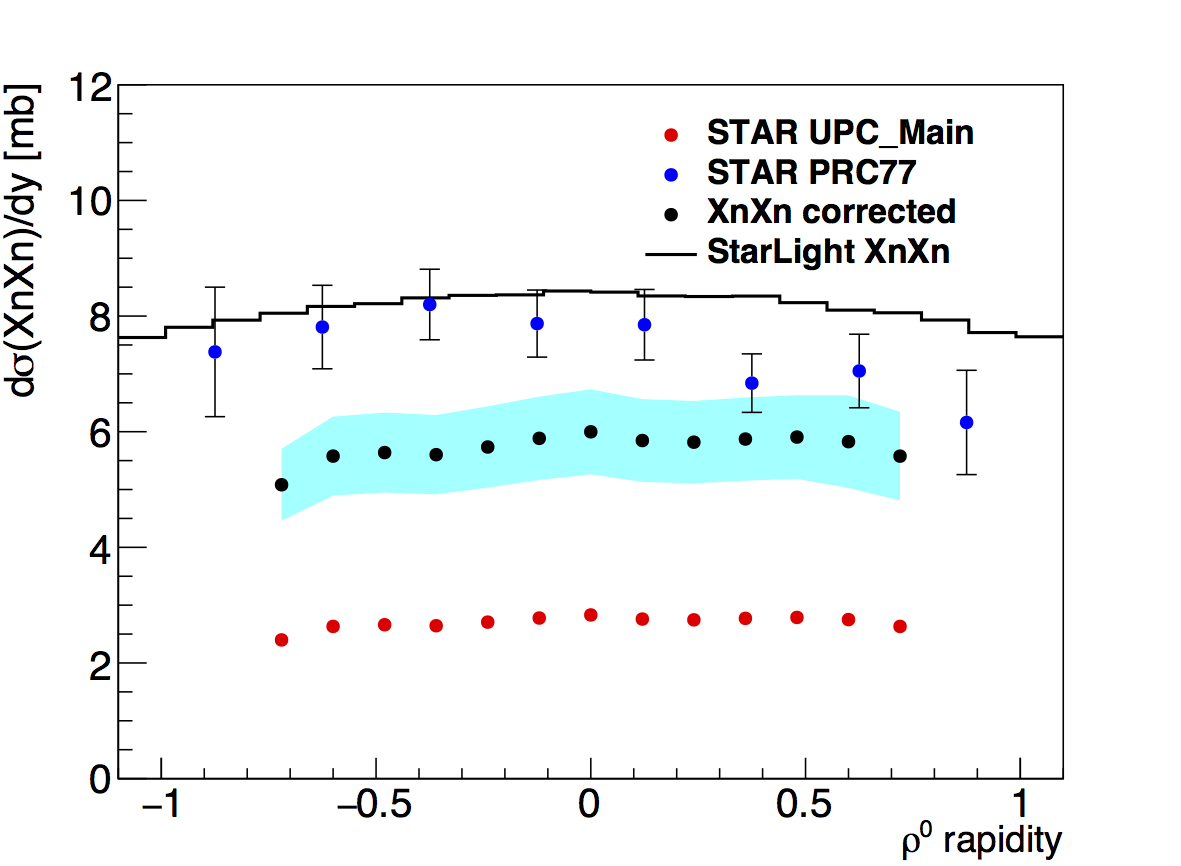
FIG. 4. Red markers show the cross-section as function of rapidity distribution for exclusively photo-produced ρ0 mesons reconstructed in events selected with the STAR UPC Main trigger. The black points show the same distribution scaled up to the full XnXn cross-section. The magnitude of the scaling was obtained using the RELDIS event generator (see text for details [26]). Statistical errors are shown with black vertical lines. The sum in quadrature of all systematic un- certainties identified for this measurement is shown with the cyan band. The blue markers show the same measurement performed by STAR in 2004 [10] The rapidity distribution of XnXn StarLight events is shown with the black histogram.
.png)
FIG. 5. The high t part of the distribution, which is dominated by the contribution from incoherent interactions is fit to a power law shape. The black points are proton-dissociation events measured by the ZEUS experiment at γ−proton center of mass energy of 78 GeV [28].
.png)
FIG. 6. Fully normalized coherent diffraction pattern for ρ0 mesons detected in exclusive XnXn events within a window in the vertex z coordinate of |Vz| < 50 cm. The filled band shows the sum in quadrature of all systematic uncertainties listed in table II, the statistical errors are shown as vertical lines. The insert shows, with finner binning, the effects of the interference ocurring in these UPC interactions as each ion is a source of ρ0 mesons.
![]()
FIG. 7. The black histogram shows the Fourier transfom of the diffraction pattern shwon in Fig. 6 (integrated over azimuth angle and the finite rapidity window of this measure- ment). A Wood-Saxon distribution with Au nuclei parameters extracted from electron scattering experiments, scaled to the match the histogram, is displayed with the blue curve. The FWHM of both distributions agrees well and confirms the coherent diffraction of ρ0 mesons off an object as big as the Au nuclei.
References:
- ramdebbe's blog
- Login or register to post comments