Run 9 EEMC TCD Phase and Effective Gains
EEMC TCD Phase and Effective Gains
Abstract: During Run 9 the TCD phase was set incorrectly for ETOW (run < 10114054) and ESMD (run < 10140030). Below I am trying to quantify what effect this had on the gain for the different TCD phases. I used "Scott's Method" to compute "slopes" (ie. exponential decay constant) for each channel and see how they change between running periods.
Data: zdc_polarimetry runs with eemc and esmd included (minbias events) with raw histograms straight from .daq files.
| Set # | Runs | nEvents | ESMD TCD phase | ETOW TCD phase | Comments |
| 0 | 10114001 | 999889 | 25 | 5 | bad card in ETOW crate 5 |
| 1 | 10114069 | 338342 | 25 | 21 | bad card in ETOW crate 5 |
| 2 | 10138003, 10138045 | 351342 | 25 | 21 | |
| 3 | 10141007, 10142010, 10146068 | 271207 | 63 | 21 | |
| 4 | 10151014, 10151033, 10151055 | 261611 | 63 | 21 | |
| 5 | 10146072,10147123,10148065,10149003 | 383934 | 63 | 21 | |
| 6 | 10136056 | 322838 | 25 | 21 |
ETOW
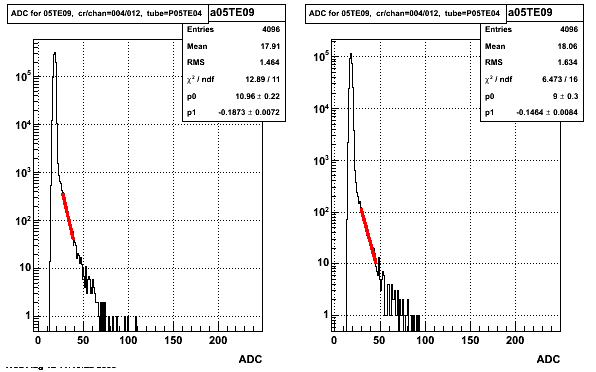
Define fitting ranges by integrating from the maximum ADC down to a fraction of the total number of entries (xLow=0.0027*nEntries and xHigh=0.00036*nEntries). A sample of these fits is shown below.
Figure 1.1: Example ADC distribution for an ETOW channel with Set 0 TCD Phase=5 (left) and Set 1 TCD Phase=21 (right)
Different TCD phase Comparison:
Comparison of Set 0 and Set 1: A plot of each tower's slope for both Set 0 and Set 1 and the percent difference between the two slopes. The percent difference is calculated as ((Set 0 Slope) - (Set 1 Slope))/(Set 1 Slope).
Comparison of Set 0 and sum of Set1,2,3,4: In hopes of decreasing the spread tower by tower, we decided to sum over multiple sets to increase stastics. So in the link above you will find a comparison of Set0 and the sum of Set1,2,3, and 4. This is simply a comparison with more statistics of the two different TCD phase settings. This increase in statistics doesn't do much to decrease the tower by tower spread, which tells us these variations are probably real.
Same TCD phase Comparison:
Comparison of Set 1 and Set 2: To test the robustness of our method, I made a comparison of Set 1 and Set 2 to see what difference we would find for 2 samples with the same TCD phase. The percent difference points are centered around 0, as they should be, but there is a statistical spread about 0.
Comparison of sum of Set1,2 and sum of Set3,4: To convince ourselves that at the tower by tower spread around 0 in the percent difference plot is truely statistical I compared the sum of Set1,2 with the sum of Set3,4 to see that the width of the percent difference decreases by roughly a factor of sqrt(2), since these summed sets have a factor of ~2 larger statistics.
Summary:
Combining Scott's analysis and this analysis: Scott has done another analysis calculating the same percent differences via the timing scan data from the beginning of the 500 GeV portion of the run. He calculates slopes for every tower at each timing point. Then for each tower, the slopes calculated can be fit so he can extrapolate to find the slopes for the two timing points where we actually took data (ie. TCD phase = 5 and 21). A comparison of our two methods is given in the link above, and the agreement is very good considering how different the two methods are.
ETOW Gains: Using an error weighted avarage of these two different methods, the slope ratios were calculated and applied to the 2008 gains to produce a set of gains when the TCD phase = 5. This assumes that the gains when TCD phase = 21 are the same as the gains found in 2008.
ESMD
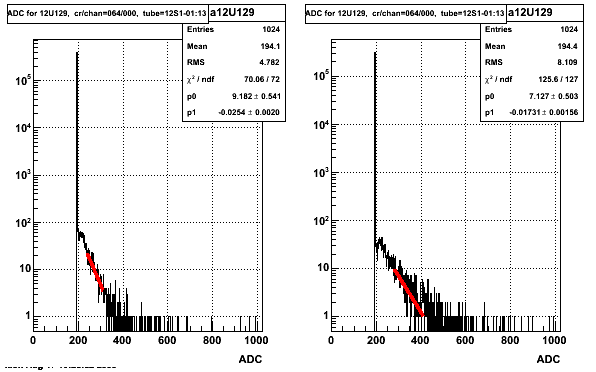
Define fitting ranges by integrating from the maximum ADC down to a fraction of the total number of entries (xLow=0.0015*nEntries and xHigh=0.0003*nEntries). Also if xLow < ped+25, I set xLow = ped+25 so the the single photo-electron peak wouldn't be included in the fitting range. For small strips (ie. high strip #) this often results in to small a fitting range. A sample of these fits is shown below.
Figure 2.1: Example ADC distribution for an ESMD strip with Set1,2 TCD Phase=25 (left) and Set 3,4 TCD Phase=63 (right)
Different TCD phase Comparison:
Comparison of Set 1,2,6 and Set 3,4,5 By Crate or By Strip # : A plot of each channel's slope for both the sum of Set 1,2,6 and the sum of Set 3,4,5 and the percent difference between the two slopes. The percent difference is calculated as ((Set 1,2 Slope) - (Set 3,4 Slope))/(Set 3,4 Slope). Slopes are plotted by crate (ie. channel #) and SMD plane (ie. strip #). Note: At high (andl low) strip # the strips are getting smaller, thus there are less counts outside of the pedestal, so the fitting becomes more difficult and often fails to find an accurate slope. So I have removed the channels with strip # > 220 and strip # < 11 and plotted the slopes by crate in By Crate (Strip # 11-220) and zoomed in version By Crate (Strip # 11-220) ZoomIn. This shows that most of the outliers have strip # > 220 or < 11, and we should probably deal with them separatly. So to find the correction factor for these smaller strips and channels that were failed in the DB, I calculated the error weighted average for each crate using only the strips within this 11-220 region for each crate. I gave these strips and failed channels an error of 25% for the smd and preshower channels and an error of 50% for the postshower channels. This approximately covers the spread in the distribution for each crate.
Same TCD phase Comparison:
Comparison of Set 1 and Set 2 By Crate or By Strip # : To test the robustness of our method, I made a comparison of Set 1 and Set 2 to see what difference we would find for 2 samples with the same TCD phase. The percentage difference points are centered around 0, as they should be, but there is a large statistical spread.
Comparison of Set 3 and Set 4: By Crate or By Strip # : Another test that 2 samples (Set 3 and Set 4) with the same TCD phase have the same slopes.
Summary:
Final plots of the correction factors are here: By Crate Final and By Crate Final ZoomIn. In the EEMC gain ~ 1/slope, so I used the ratio of slopes found above to convert the 2006 gains to new effective gains for when the TCD phase was mis-set to 25. Note: this assumes that the gains when the TCD phase was set correctly to 63 are the same as the 2006 gains.
- stevens4's blog
- Login or register to post comments