- yuxip's home page
- Posts
- 2015
- 2014
- December (2)
- November (1)
- October (2)
- September (6)
- August (2)
- July (1)
- June (3)
- May (4)
- April (1)
- March (2)
- 2013
- December (1)
- November (1)
- October (3)
- September (3)
- August (2)
- July (1)
- June (2)
- May (1)
- April (3)
- March (1)
- February (1)
- January (1)
- 2012
- 2011
- My blog
- Post new blog entry
- All blogs
Forwad jet simulations on FCS
I have produced ~ 1M filtered Monte Carlo events in 4 partonic pT bins to study the kinematic coverage of forward jets on FCS, and to prepare for further investigations
of hadron-jet correlations. A general description of FCS and related simulation setup can be found in my talk at UCLA upgrade workshop last December.
Accroding to Len's studies, we chose Pythia6.4 + TuneA ( pp@200GeV ) with Gaussian width of primordial <kT> = 0.5 GeV to generate MC events. A forward jet filter was applied before pushing events through GSTAR. The filtering process consists of running an anti-kT jet finder on Pythia particles and requesting that there is a least one jet in pseudorapidity
2.0 to 5.0 and with pT > 1.0 GeV. In order to enrich the proportion of high pT jet events the MC sample was divided into 4 partonic pT bins, with 250K events in each bin.
2.0 4.0 9.413 1.474e4
4.0 8.0 0.4674 837.1
8.0 16.0 1.516e-2 23.82
16.0 32.0 2.634e-4 0.3151
Table.1 MC data set
order for CKIN(3) and CKIN(4) cuts to work. But I have expicitly checked that these two processes together produced ~2% of the jets after the final reconstruction and they
all ended up in very low pT bins (<2 GeV).
Particle/Detector jet matching
A reconstructed detector jet is matched to a particle jet if delta_R < 0.5 where delta_R = Sqrt[(etaDet-etaPar)^2 + (phiDet-phiPar)^2]. Figure 1 a). shows the cross section of the
MC events that contain at least one pair of matched particle/detector jets, as a function of partonic pT. Figure 1 b). shows the pT distributions of matched particle and detector jets
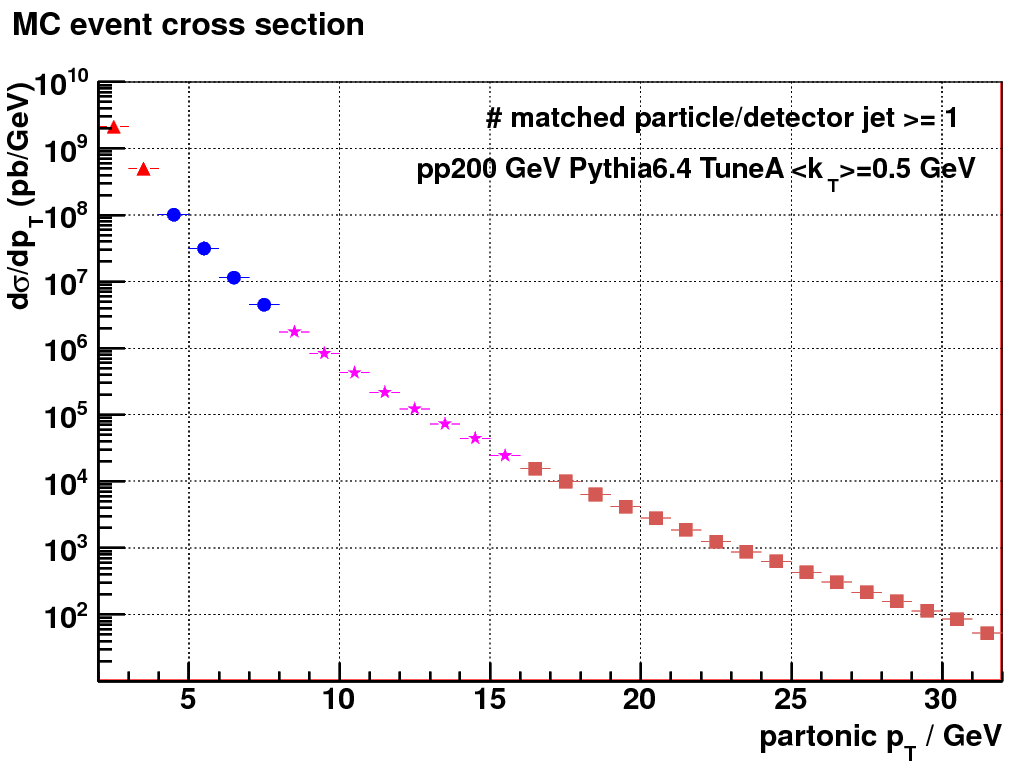
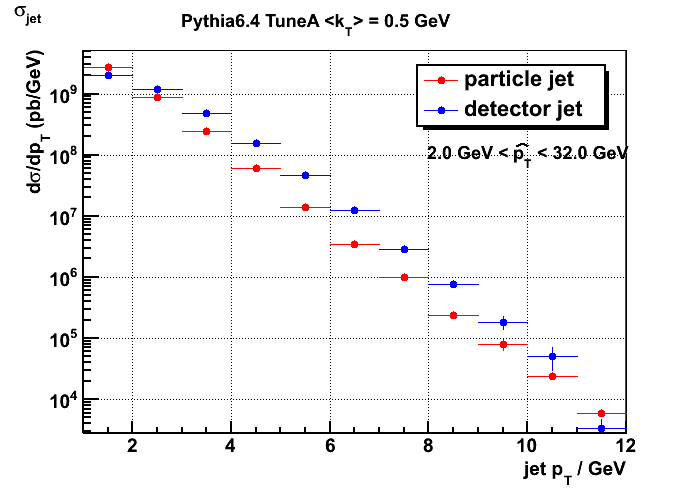
Figure 1 a). MC event cross section vs partonic pT Figure 1 b). jet pT spectra
The above distributions do not have any restrctions on the fiducial area of the detector therefore edge effect could be present. In order to define a relatively reasonable acceptance range, I looked at the efficiency of finding a matched detector jet for a given particle jet at certain pseudorapidity and pT, as shown in Figure 2.
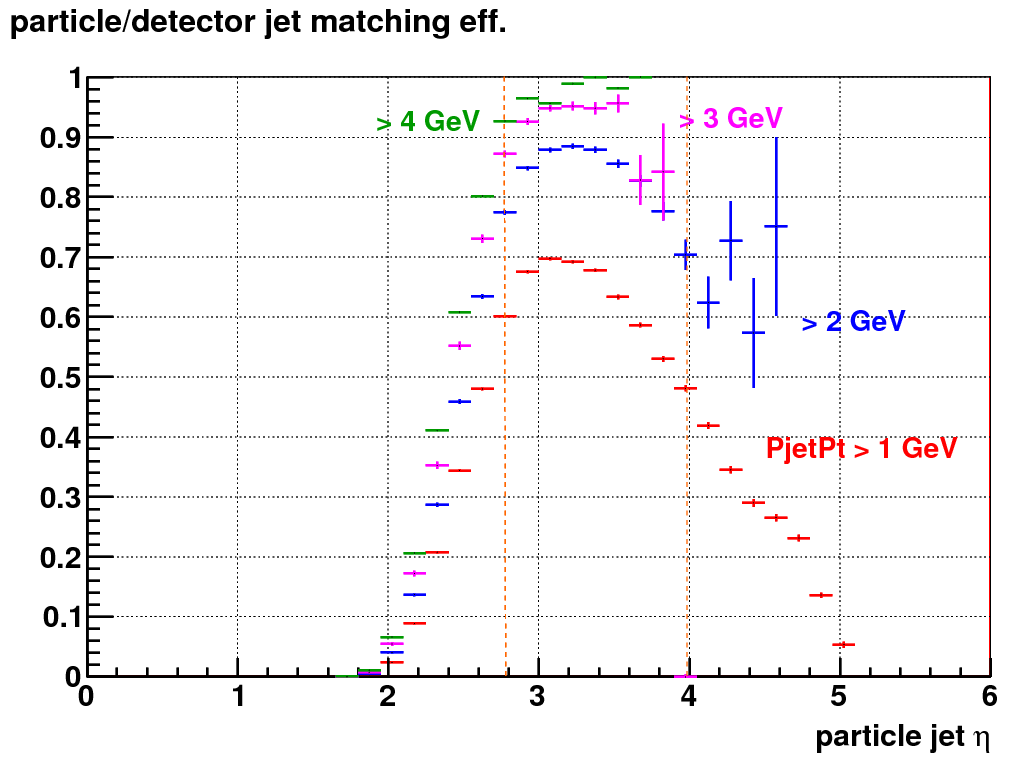
Figure 2. particle/detector jet matching efficiency
The reason that this matching eff. is quite low for low pT jets is because I have a pT cut > 1 GeV in the detector jet reconstructions. Therefore for particle jet ~ 1 GeV the partner
detector jet sometimes would lie below this threshold. Furthermore the reconstruction efficiency of detector jet will tend to increase as a function of pT since jet becomes well defined
at higher pT. From Figure 2. I chose eta between 2.8 and 4.0 as the fiducial are of the detector since the matching eff. is above 80% for pT > 2 GeV. Note that the physical boundary of FCS is ~ 2.6 at top and bottom and ~ 2.2 at left/right side. Figure 3 shows the differences in eta and phi between matched particle and detector jets.
.gif)
.gif)
Figure 3 a). eta matching Figure 3 b). phi matching
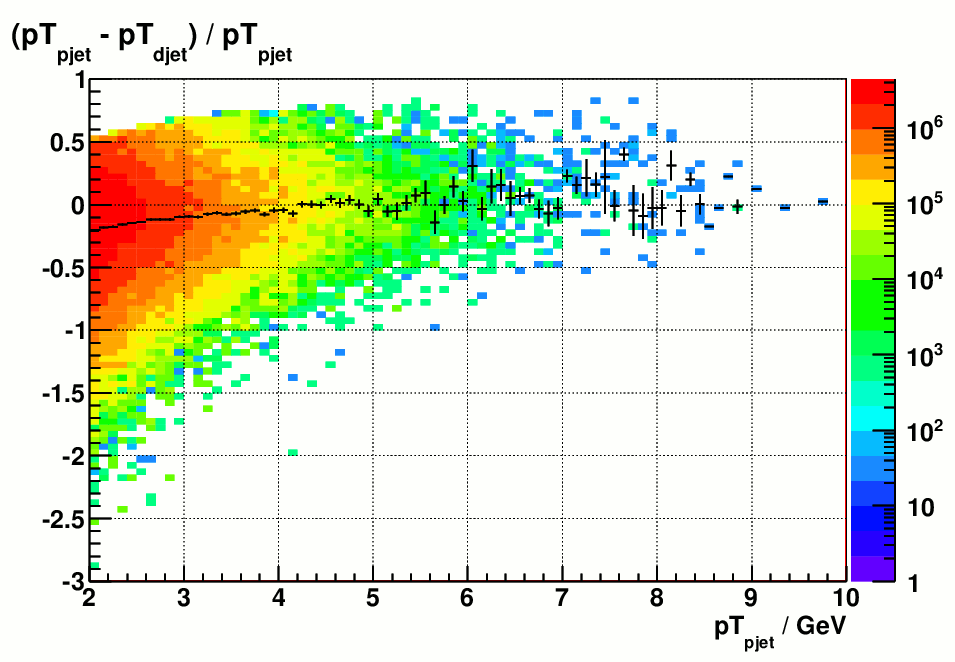
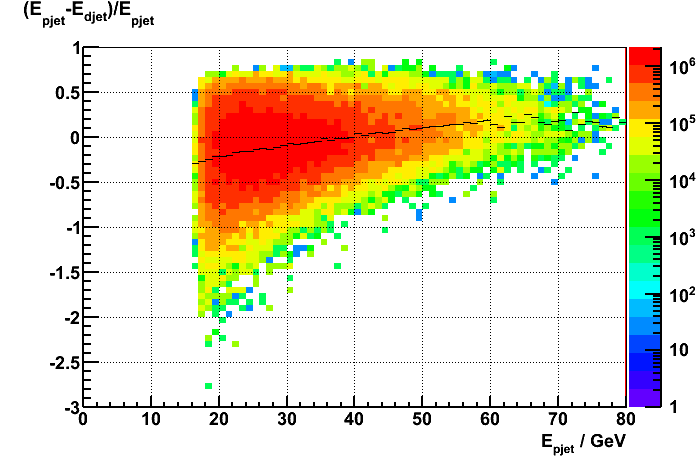
Figure 3 c) particle/detector jet pT differences Figure 3 d). particle/detector jet E dffrerences
Since there is no restrictions in eta and phi when ensembling pythia particles into particle jets, the pseudorapidity of particle jet is going to be systematically
lower than that of the partner detector jet in regions where the detector could not catch all of the generated particles, most notably at lower eta. That's why
the distribution of eta difference is heavily skew towards negative value when there is no fiducial area cut.
Figure 3. shows the jet pT distributions with 2.8 < eta < 4.0 cut.
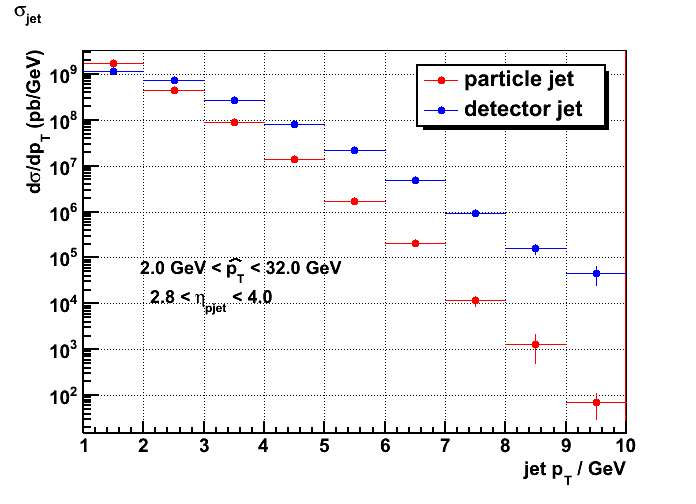
Figure 4. jet pT spectra with fiducial area cut
It's also interesting to look at the jet pT coverage at eta = 3.3 because it can be directly compared with predictions from Phys.Rev. D 83, 034021 (2011). Figure 4 a). is taken
from FIG. 7 of this article, which shows the predicted Siver asymmetry (@ eta = 3.3 ) as a function of jet pT based on two different SIDIS data sets and the respective parameterized
Sivers functions therein. Due to limited acceptance of the available SIDIS data different parameterizations could lead to quite different pT depdence of the asymmetry.
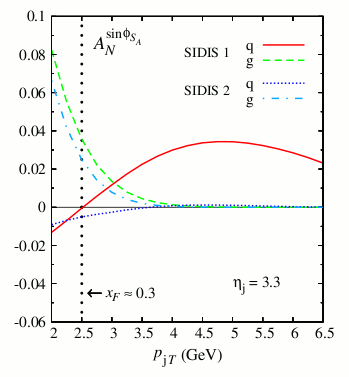

Figure 5 a). estimated quark and gluon Sivers contributions to forward Figure 5 b). FCS jet cross section at eta = 3.3
SSA of inclusive jet at pp200 GeV From Phys.Rev. D 83, 034021 (2011)
Figure 5 b). shows the simulated jet pT spectra in FCS at the same pseudorapidity eta = 3.3. It can be seen that we can extend the jet pT up to 6 GeV in this
region therefore providing very important constrants on the parameterizations of the Siver function.
In the next step we are hoping to get the single partilce clustering code up and running, so that we can study how well we can reconstruct leading hadrons
inside these jets.
- yuxip's blog
- Login or register to post comments
