05 May
May 2009 posts
2009.05.03 LDA: varying pt and eta cut
Cut optimization with Fisher's LDA classifier
ROOT implementation for LDA:
Application for cuts optimization in the gamma-jet analysis
LDA configuration: default
LDA input parameters Set0:
- Set0:
- Energy fraction in 3x3 cluster within a r=0.7 radius:
E_3x3/E_0.7 - Photon-jet pt balance:
[pt_gamma-pt_jet]/pt_gamma - Number of charge tracks within r=0.7 around gamma candidate:
Ncharge - Number of Endcap towersL fired within r=0.7 around gamma candidate:
NtowBarrel - Number of Barrel towers fired within r=0.7 around gamma candidate
NtowEndcap
- Energy fraction in 3x3 cluster within a r=0.7 radius:
- Set1:
- All from Set0
- Shower shape analysis: distance to 80% cut line:
distance to cut line
- Set2:
- All from Set1
- Energy fraction in E_2x1 and E_2x2 witin E_3x3:
E_2x1/E_2x2 and E_2x2/E_3x3
- Set3:
- All from Set2
- Energy in post-shower layer under 3x3 tower patch:
E_post^3x3
The number of strips in SMD u or v planes is required to be greater than 3
Pre-shower sorting (energy in tiles under 3x3 tower patch):
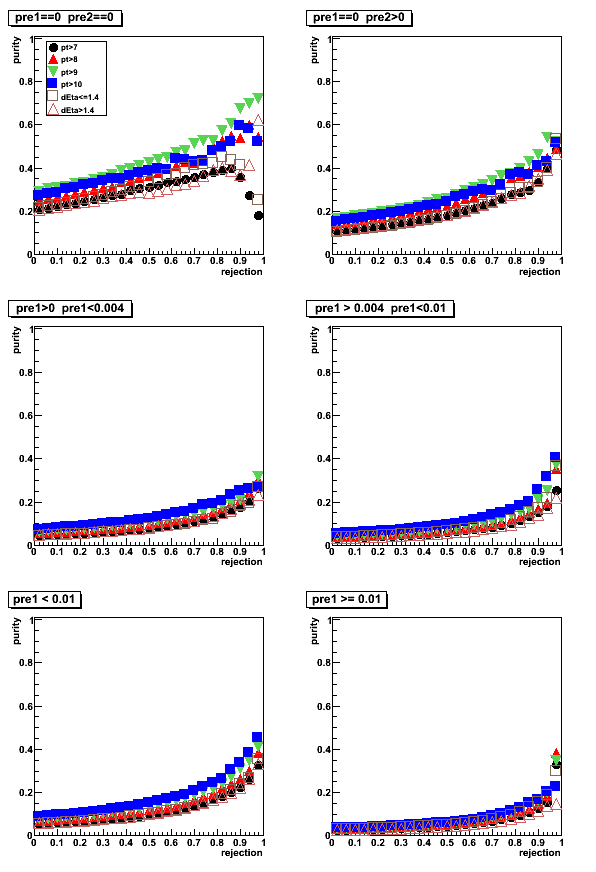
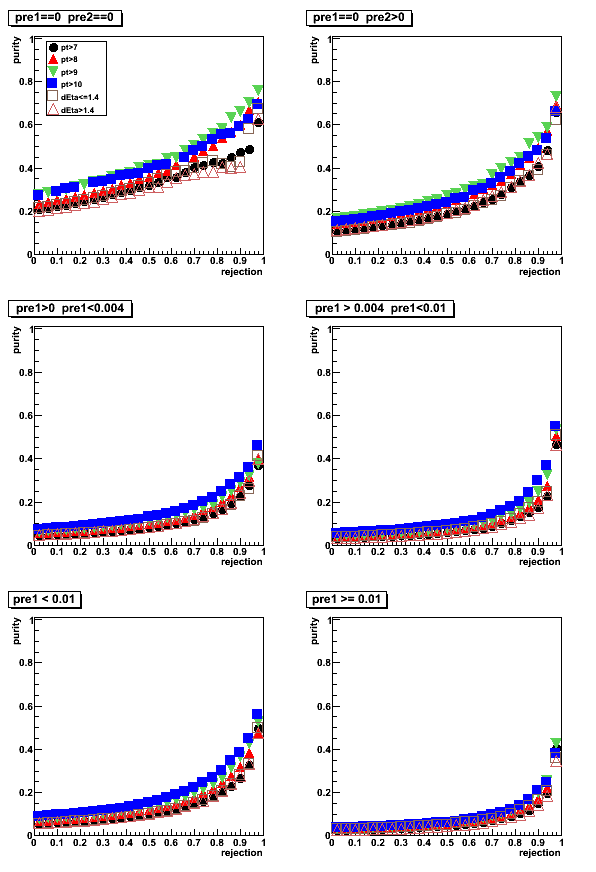
- pre1=0, pre2=0
- pre1=0, pre2>0
- 0 < pre1 < 0.004
- 0.004 < pre1 < 0.01
- pre1 < 0.01
- pre1 >= 0.01
Photon pt and rapidity cuts:
- pt>7GeV
- pt>8GeV
- pt>9GeV
- pt>10GeV
- detector eta <1.4 (pt>7GeV)
- detector eta > 1.4 (pt>7GeV)
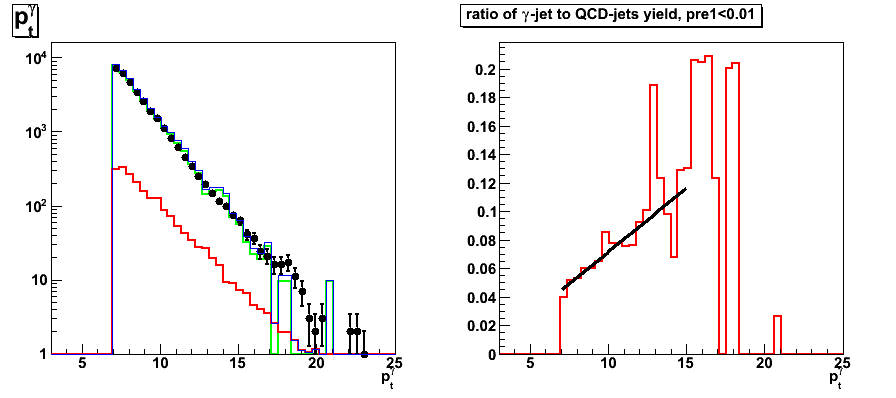
Figure 0: photon pt distribution for pre-shower1<0.01
Colour coding:
black pp2006 data, red gamma-jet MC, green QCD MC, blue gamma-jet+QCD
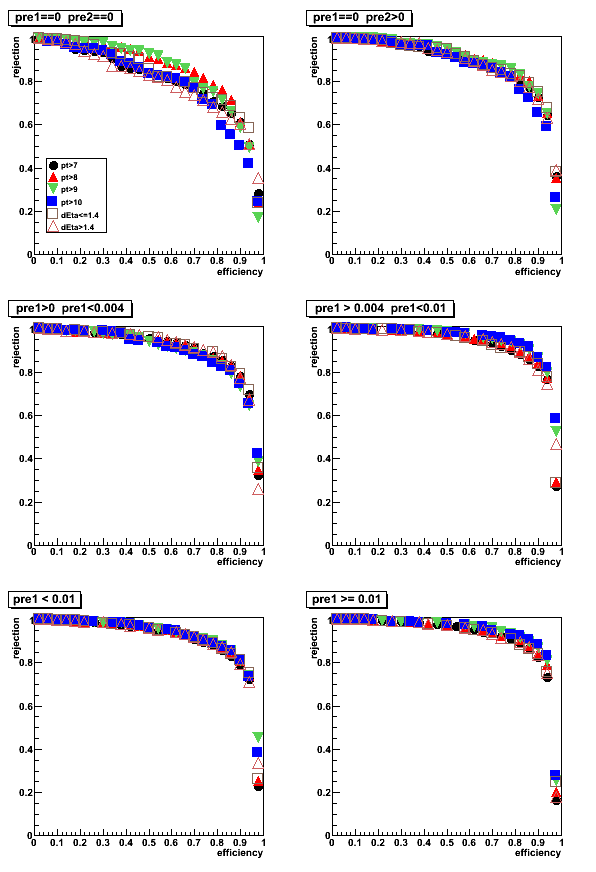
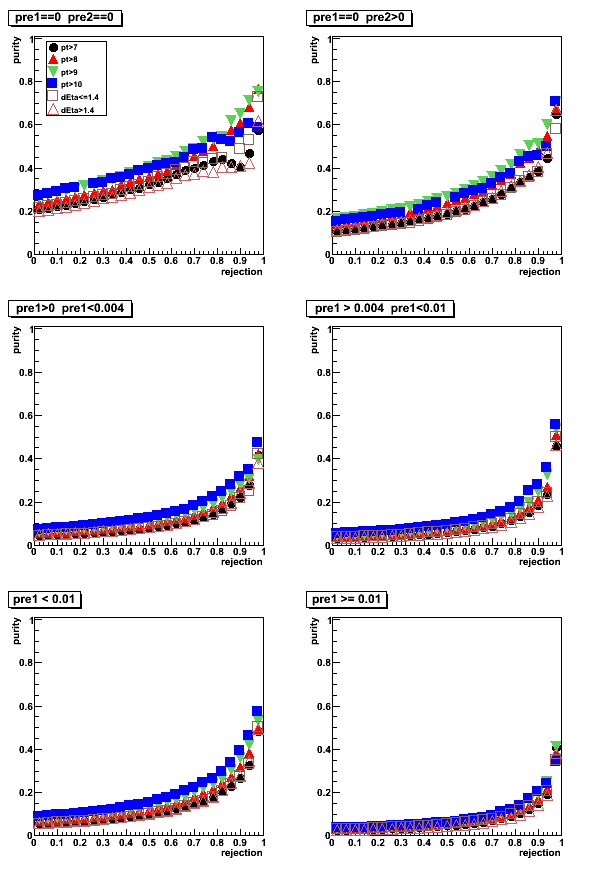
LDA Set0
Figure 1: LDA discriminant with Set0: Data to Monte-Carlo comparison (pt>7GeV cut)
Right plot for each pre-shower condition shows the ratio of pp2006 data to sum of the Monte-Carlo samples
Colour coding:
black pp2006 data, red gamma-jet MC, green QCD MC, blue gamma-jet+QCD
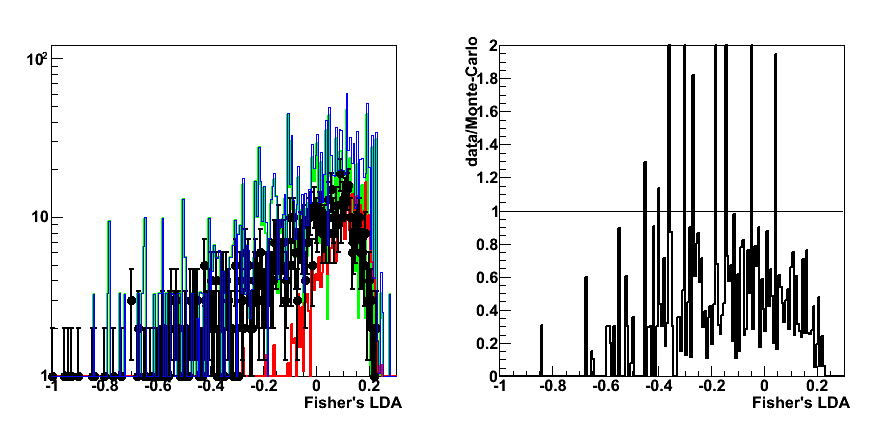
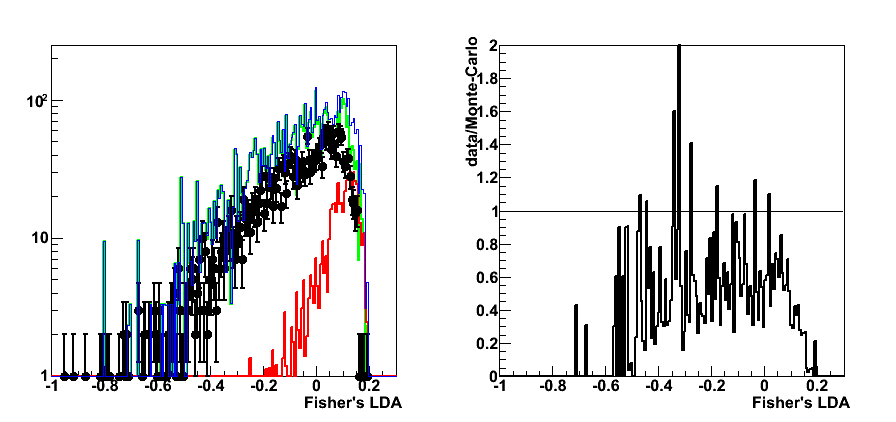
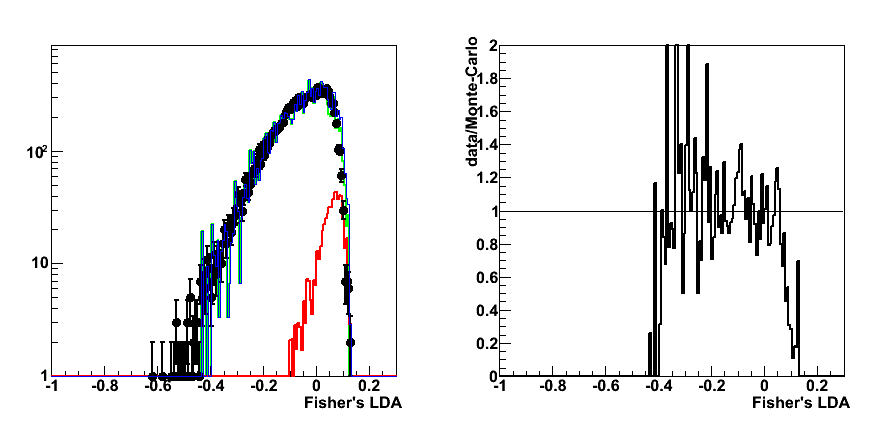
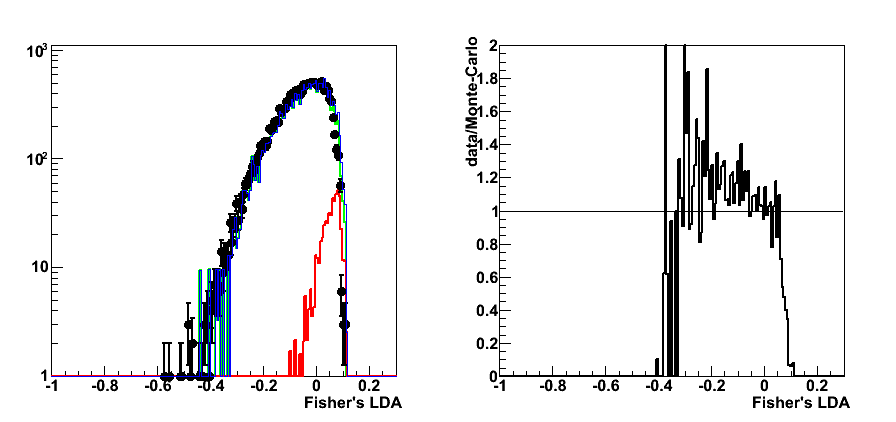
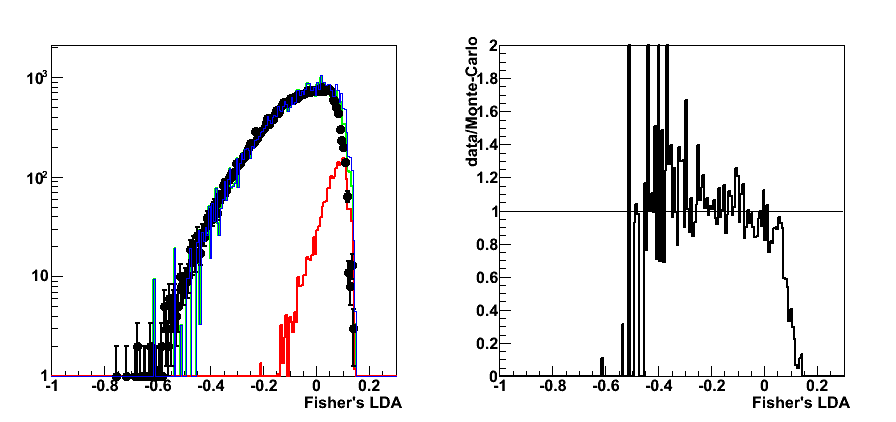
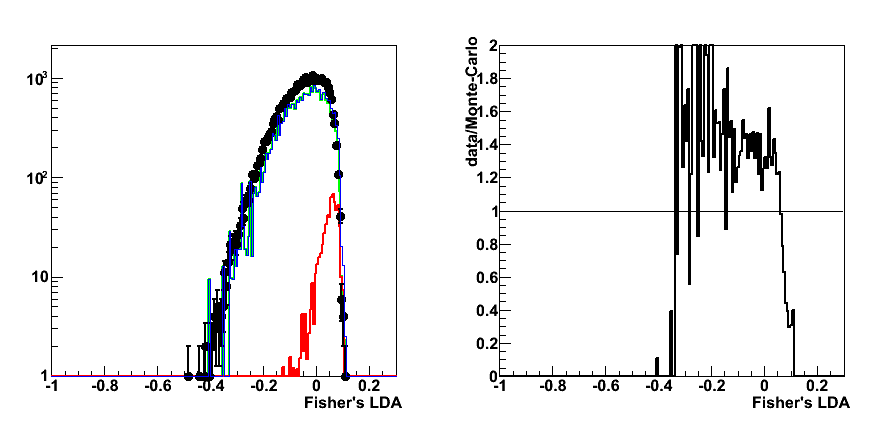
Figure 2: efficiency, purity, rejection vs. LDA discriminant (pt>7GeV cut)
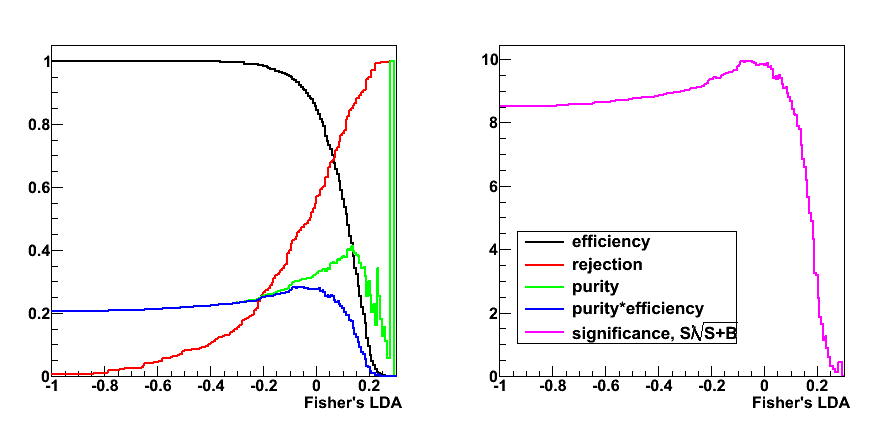
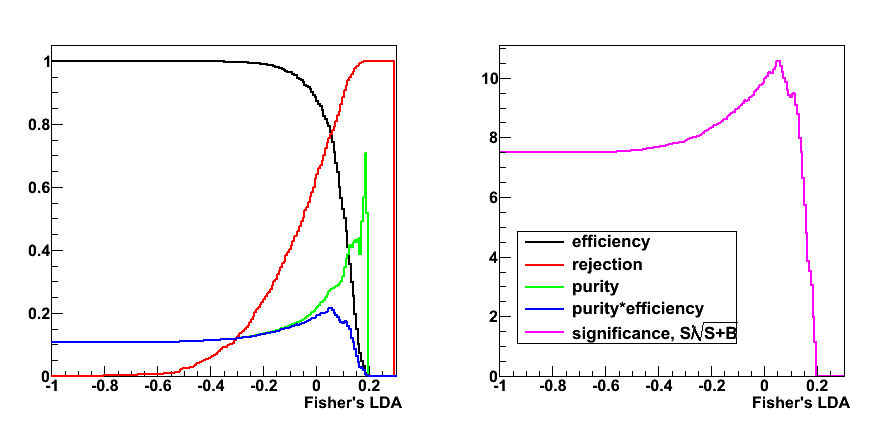

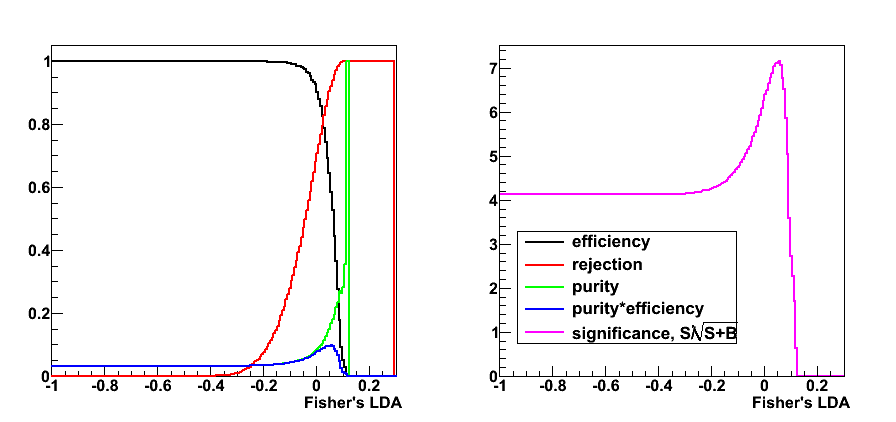
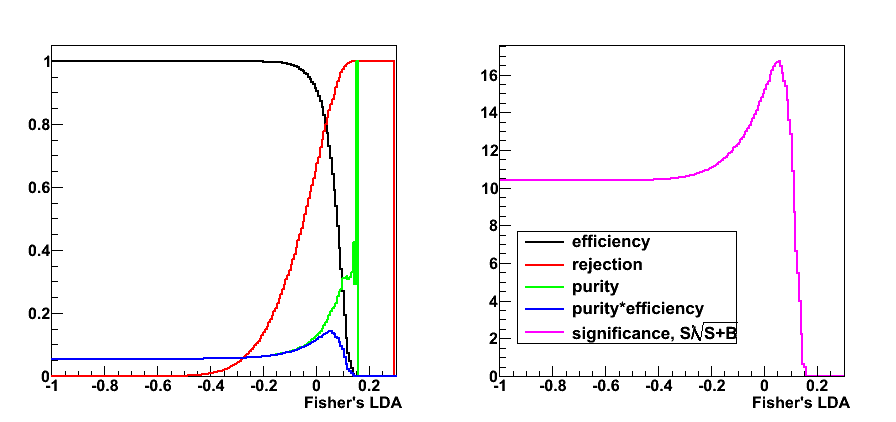
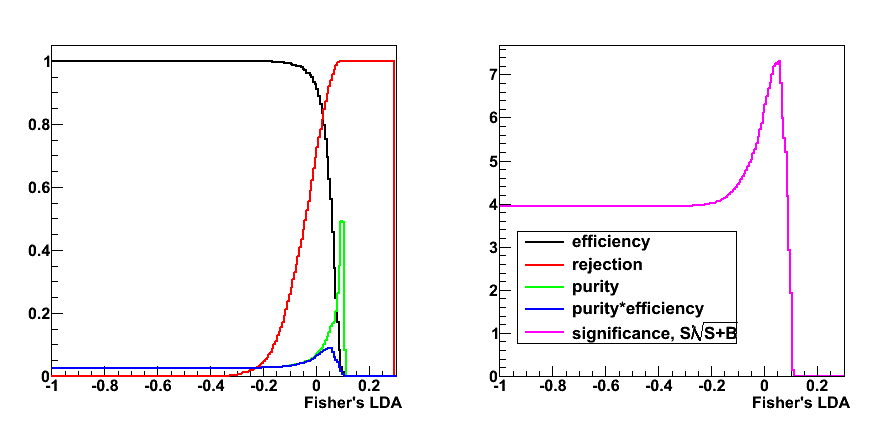
Figure 3: rejection vs. efficiency
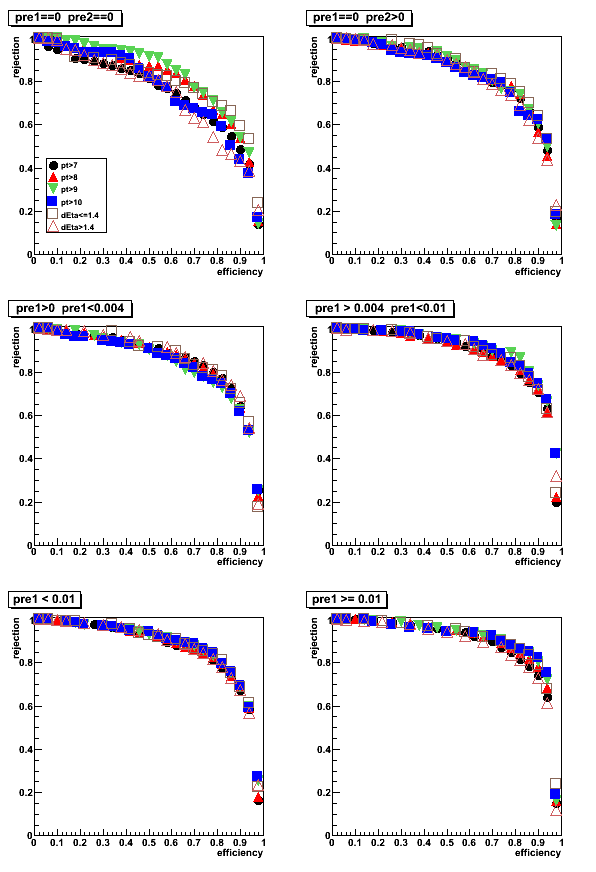
Figure 4: purity vs. efficiency
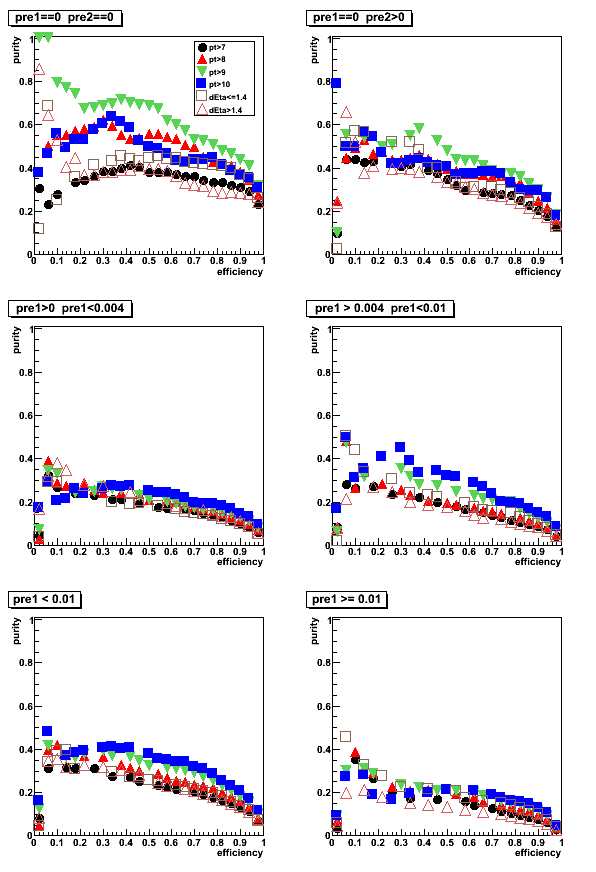
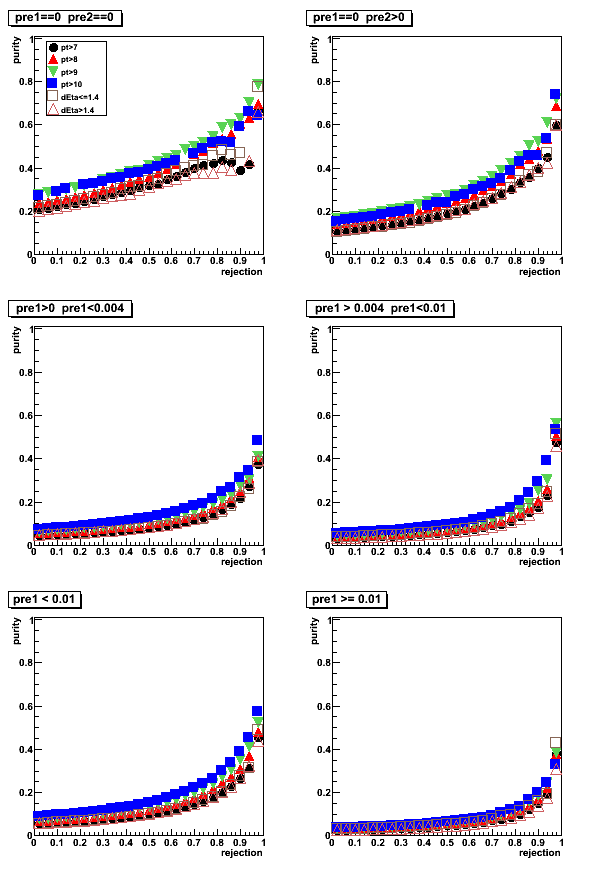
Figure 5: purity vs. rejection
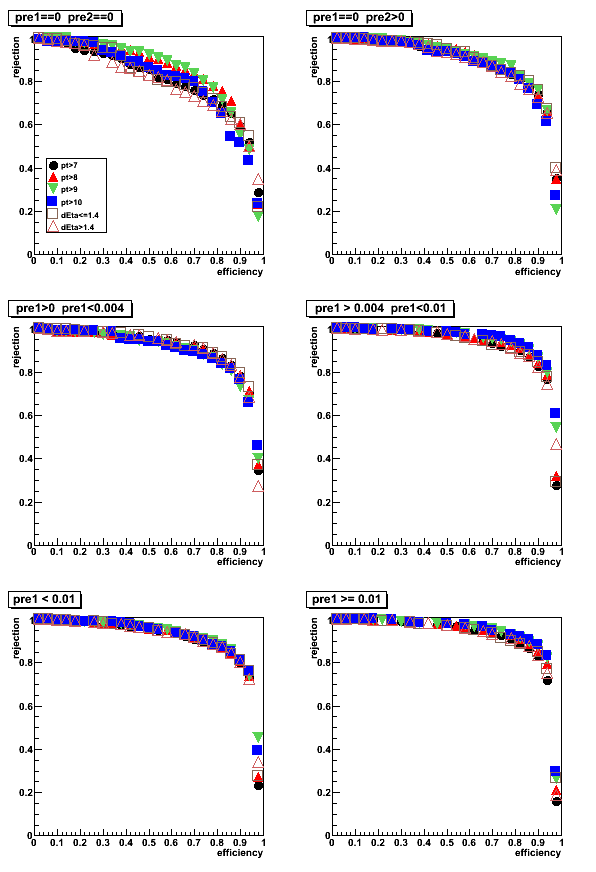
LDA Set1
Figure 6: LDA discriminant with Set1: Data to Monte-Carlo comparison
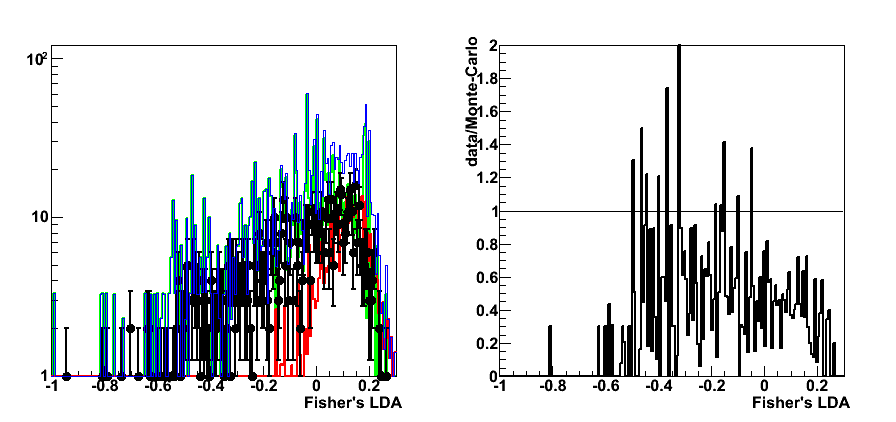
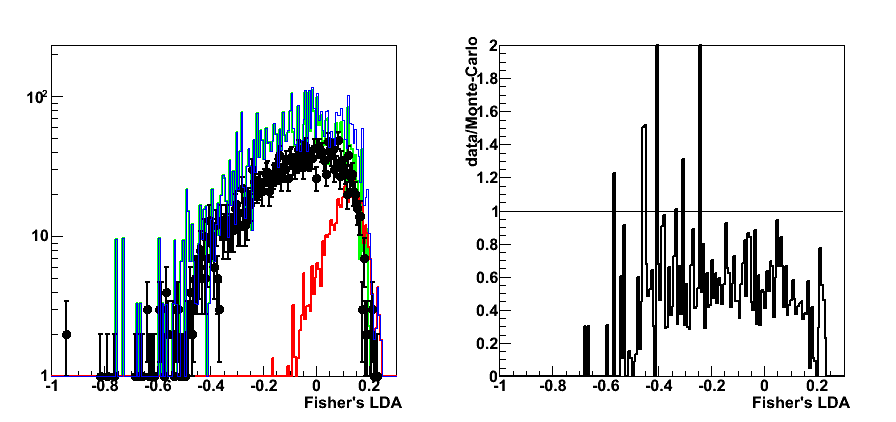
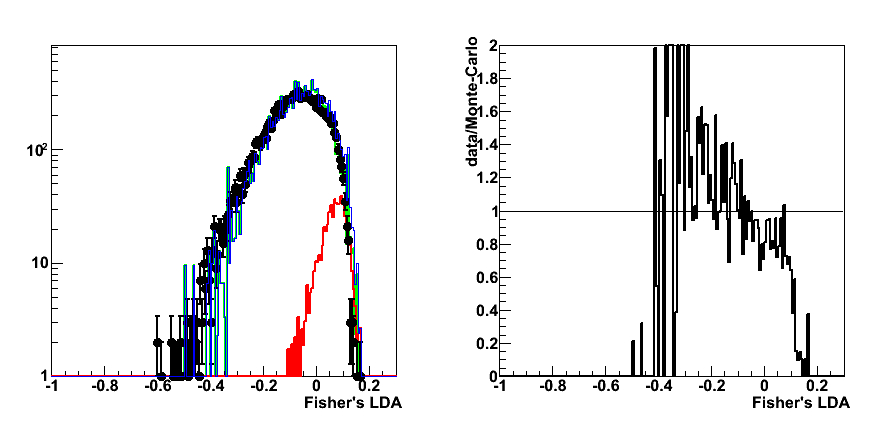
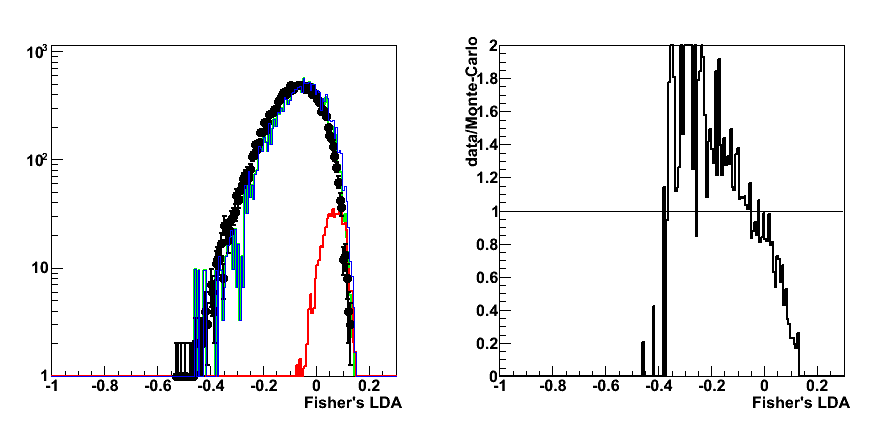
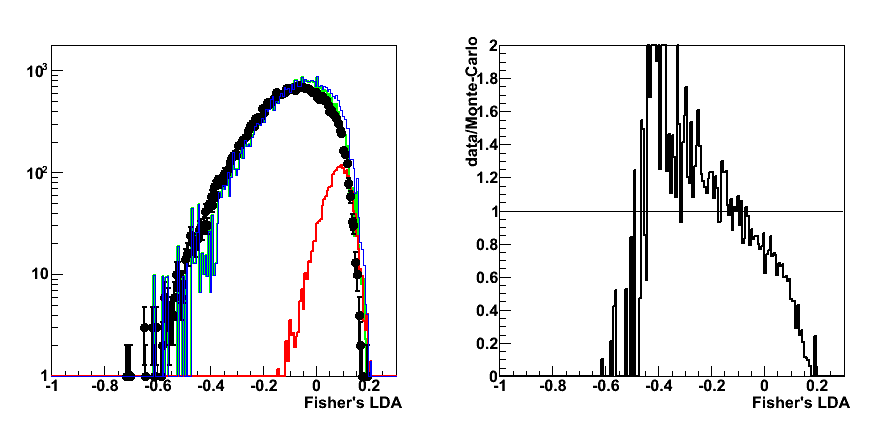
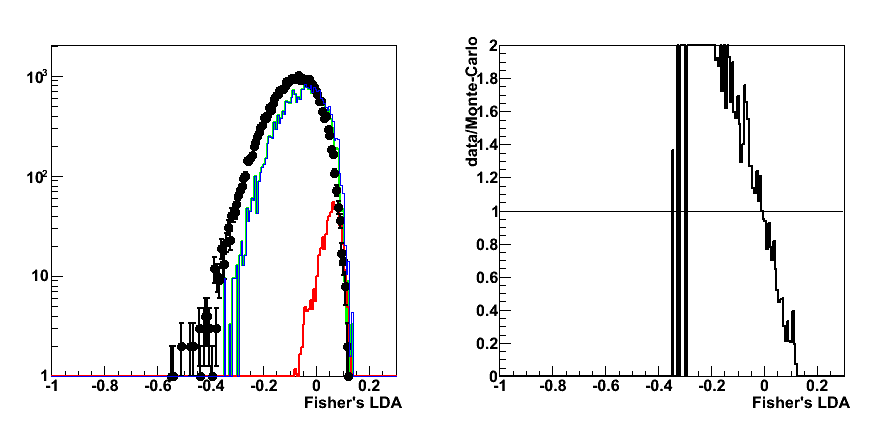
Figure 7: rejection vs. efficiency
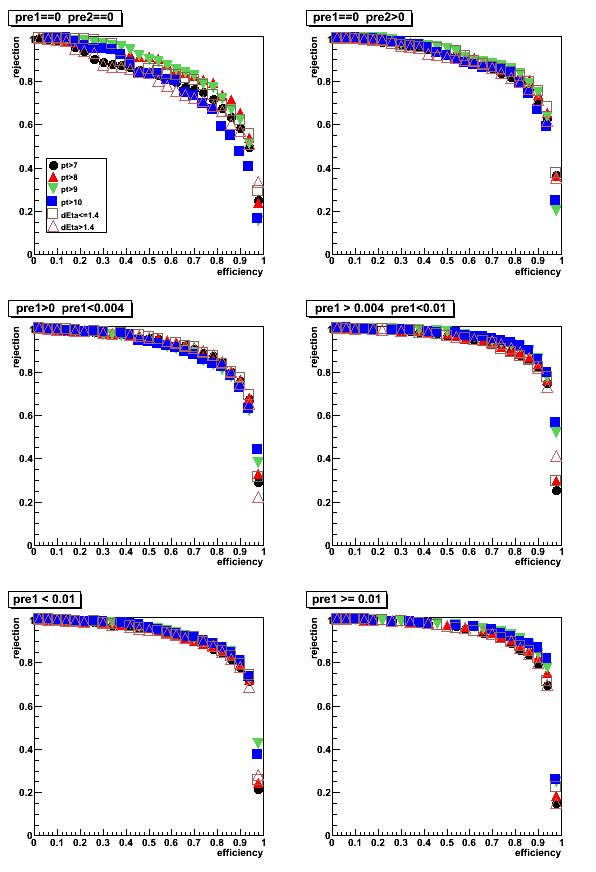
Figure 8: purity vs. efficiency
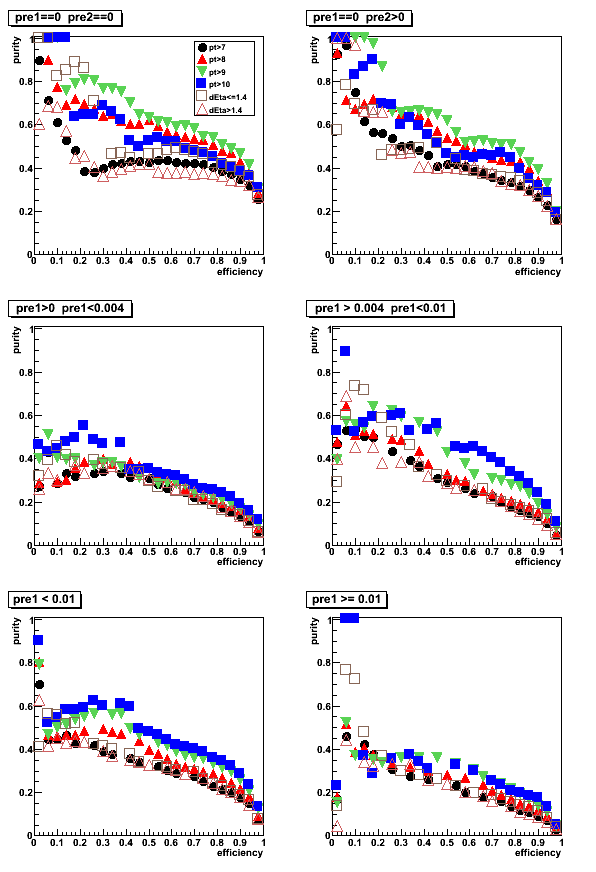
Figure 9: purity vs. rejection (click link to see the figure)
LDA Set2
Figure 10: rejection vs. efficiency (click link to see the figure)
Figure 11: purity vs. efficiency
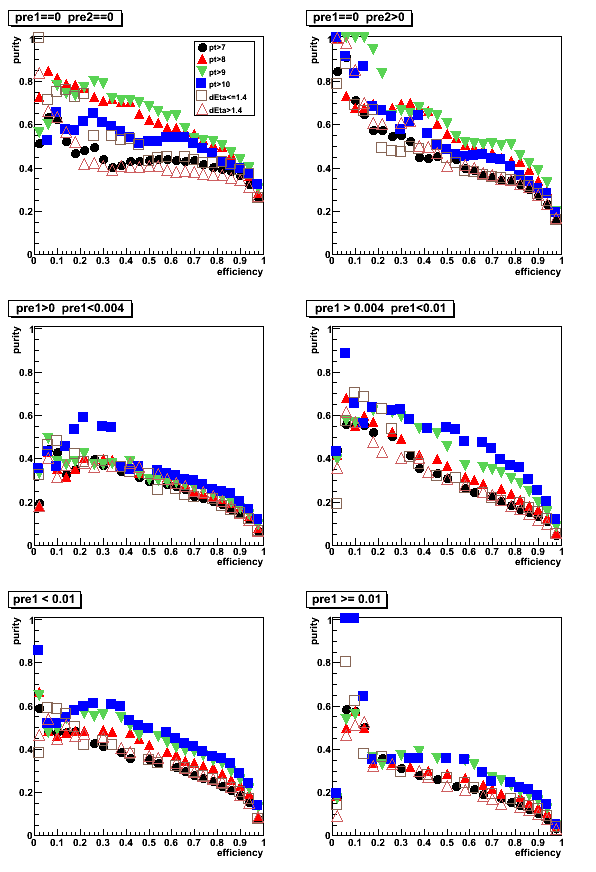
Figure 12: purity vs. rejection (click link to see the figure)
LDA Set3
Figure 13: rejection vs. efficiency (click link to see the figure)
Figure 14: purity vs. efficiency
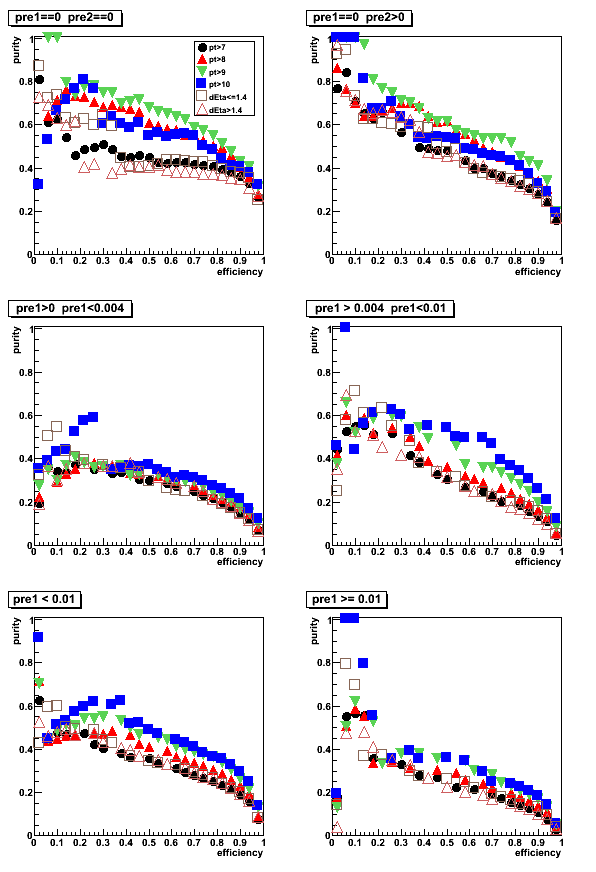
Figure 15: purity vs. rejection (click link to see the figure)
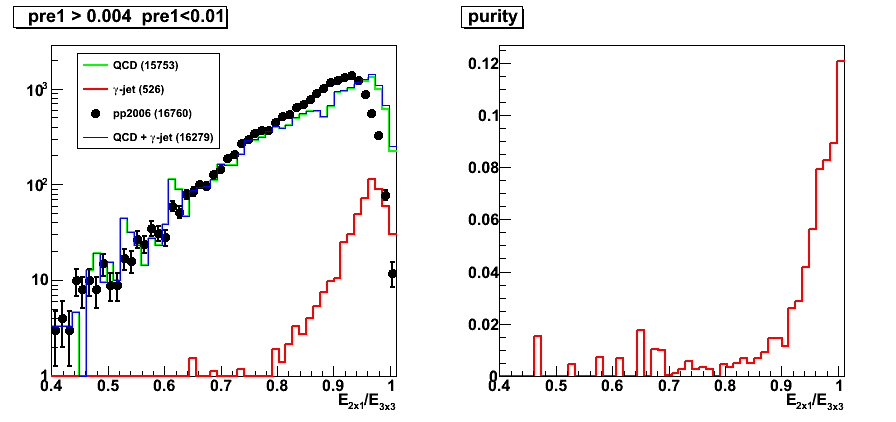
2009.05.04 LDA: More SMD info, 3x3 tower energy, correlation matrix
Cut optimization with Fisher's LDA classifier
ROOT implementation for LDA:
Application for cuts optimization in the gamma-jet analysis
LDA configuration: default
LDA input parameters Set0:
- Set4 (link for results with LDA Set0-Set3):
- Energy fraction in 3x3 cluster within a r=0.7 radius:
E_3x3/E_0.7 - Photon-jet pt balance:
[pt_gamma-pt_jet]/pt_gamma - Number of charge tracks within r=0.7 around gamma candidate:
Ncharge - Number of Endcap towersL fired within r=0.7 around gamma candidate:
NtowBarrel - Number of Barrel towers fired within r=0.7 around gamma candidate
NtowEndcap - Shower shape analysis: distance to 80% cut line:
distance to cut line - Energy fraction in E_2x1 and E_2x2 witin E_3x3:
E_2x1/E_2x2 and E_2x2/E_3x3 - Energy in post-shower layer under 3x3 tower patch:
E_post^3x3 - Tower energy in 3x3 patch:
E_tow^3x3 - SMD-u energy in 25 central strips:
E_smd-u^25 - SMD-v energy in 25 central strips:
E_smd-v^25 - SMD-v peak energy (in 5 central strips):
E_peak
- Energy fraction in 3x3 cluster within a r=0.7 radius:
The number of strips in SMD u or v planes is required to be greater than 3
Pre-shower sorting (energy in tiles under 3x3 tower patch):
- pre1=0, pre2=0
- pre1=0, pre2>0
- 0 < pre1 < 0.004
- 0.004 < pre1 < 0.01
- pre1 < 0.01
- pre1 >= 0.01
Integrated yields per pre-shower bin:
| sample | total integral | pre1=0,pre2=0 | pre1=0, pre2>0 | 0 < pre1 < 0.004 | 0.004 < pre1 < 0.01 | pre1 < 0.01 | pre1 >= 0.01 |
| photon-jet | 2.5640e+03 | 3.5034e+02 | 5.2041e+02 | 5.6741e+02 | 5.2619e+02 | 1.9644e+03 | 5.9994e+02 |
| QCD | 5.6345e+04 | 1.3515e+03 | 4.3010e+03 | 1.2289e+04 | 1.5759e+04 | 3.3701e+04 | 2.2644e+04 |
| pp2006 | 6.2811e+04 | 6.8000e+02 | 2.4310e+03 | 1.2195e+04 | 1.6766e+04 | 3.2072e+04 | 3.0739e+04 |
Photon pt and rapidity cuts:
- pt>7GeV
- pt>8GeV
- pt>9GeV
- pt>10GeV
- detector eta <1.4 (pt>7GeV)
- detector eta > 1.4 (pt>7GeV)
LDA Set4
Figure 1: LDA discriminant with Set0: Data to Monte-Carlo comparison (pt>7GeV cut)
Right plot for each pre-shower condition shows the ratio of pp2006 data to sum of the Monte-Carlo samples
Colour coding:
black pp2006 data, red gamma-jet MC, green QCD MC, blue gamma-jet+QCD
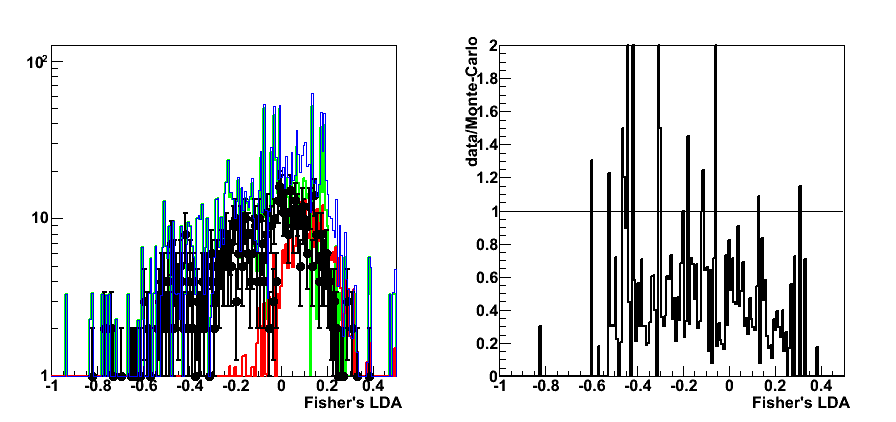
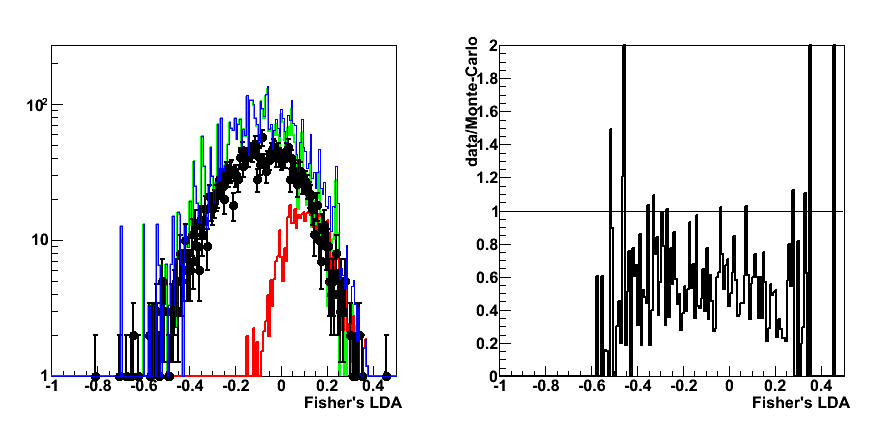
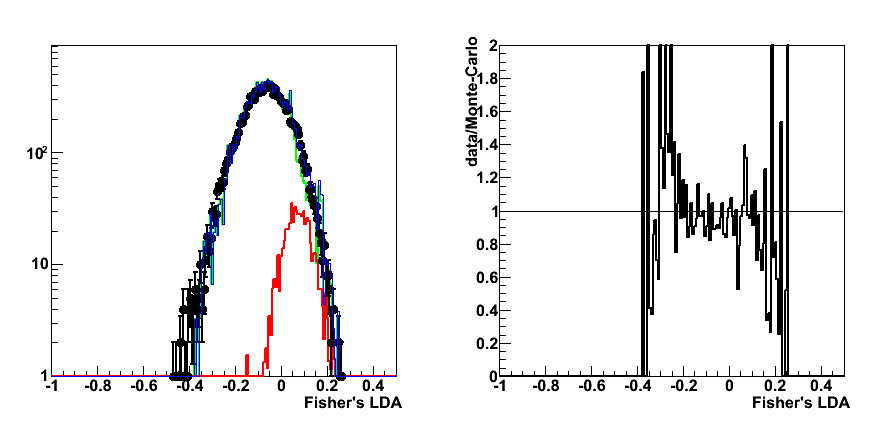
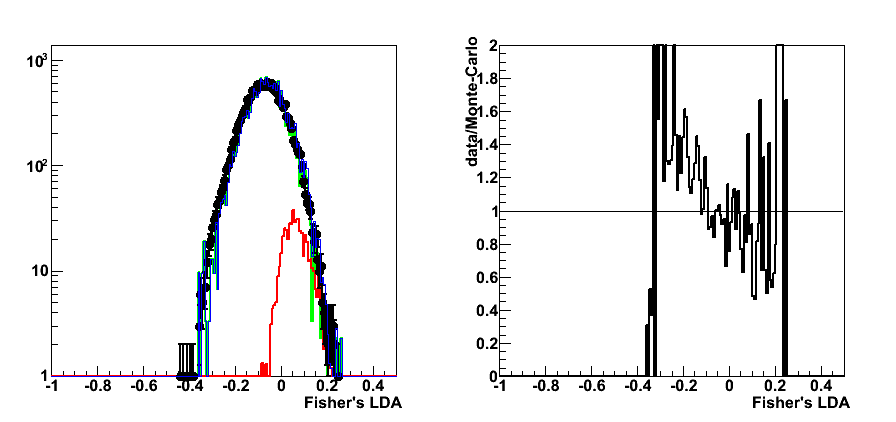
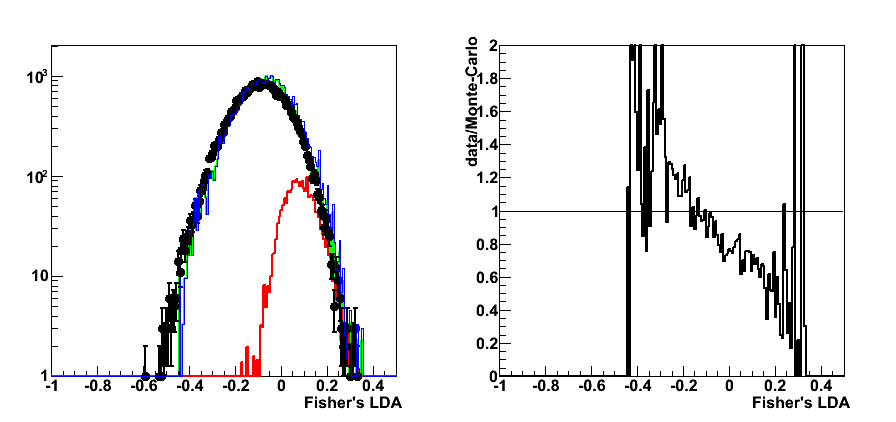
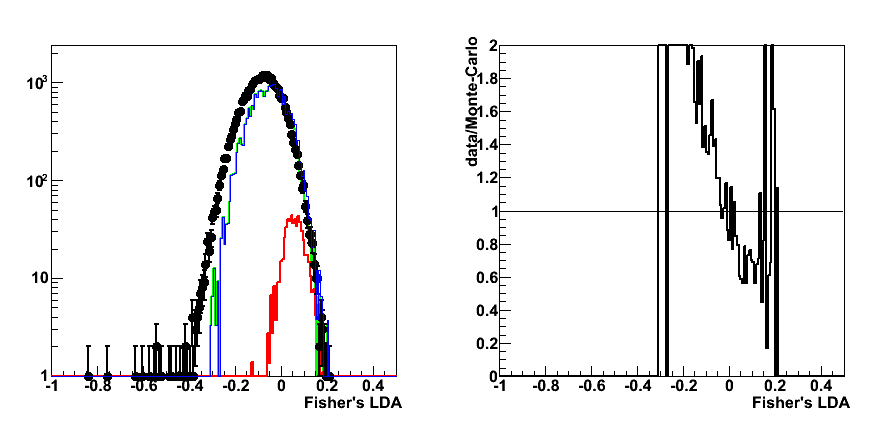
Figure 2: rejection vs. efficiency
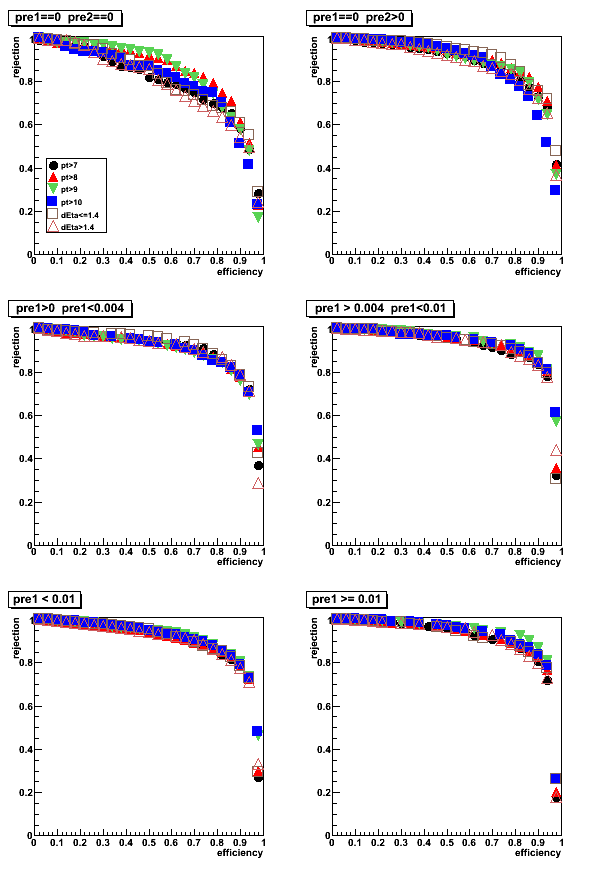
Figure 3: purity vs. efficiency
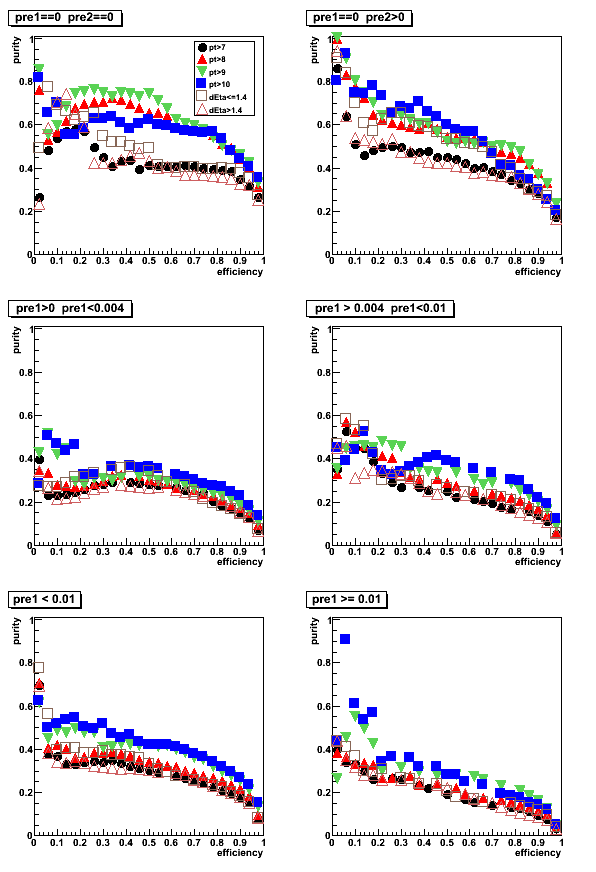
Figure 4: purity vs. rejection
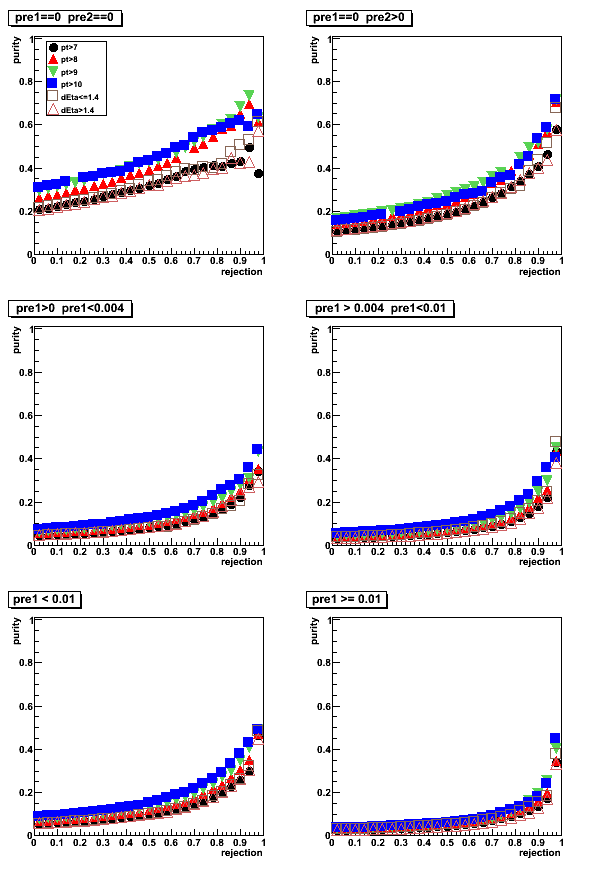
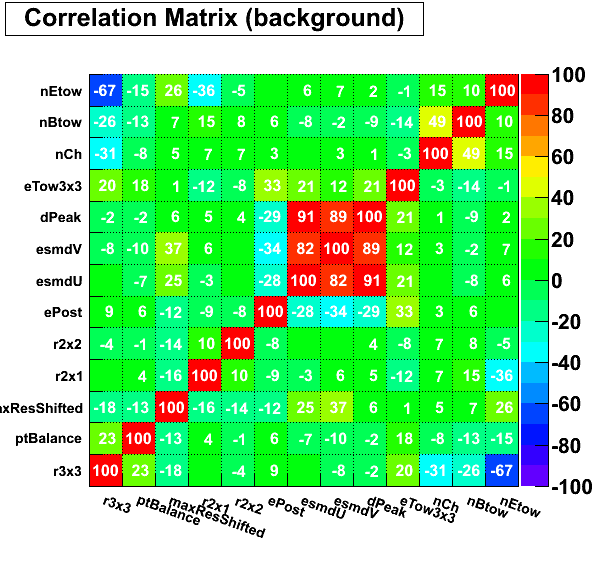
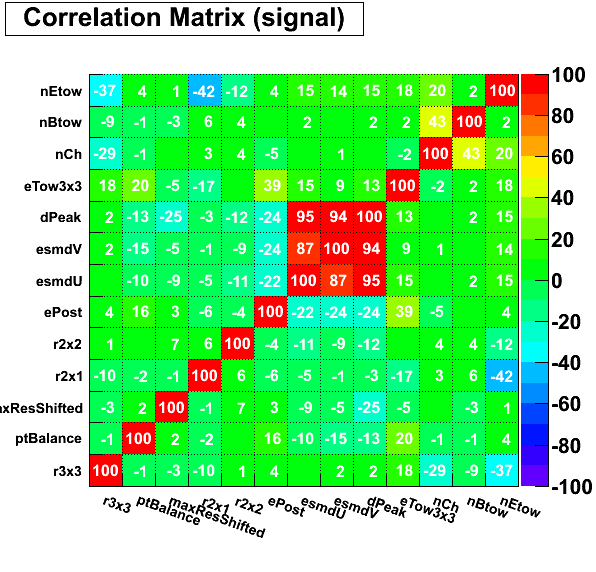
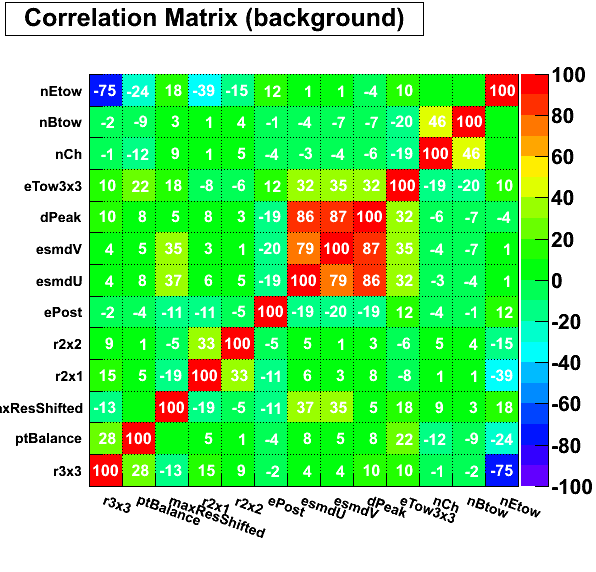
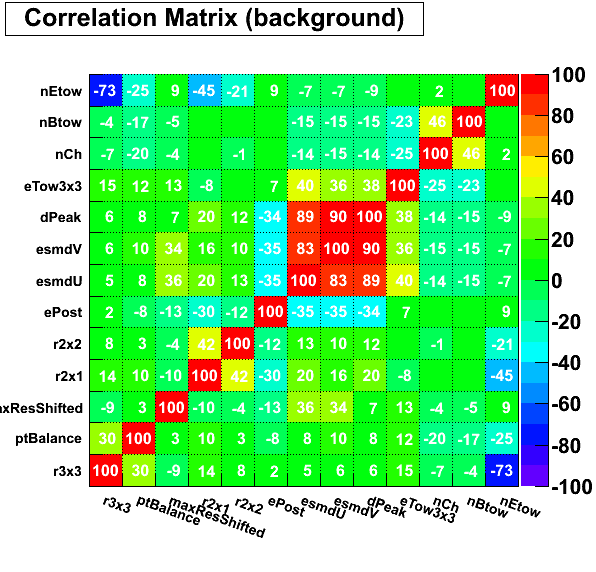
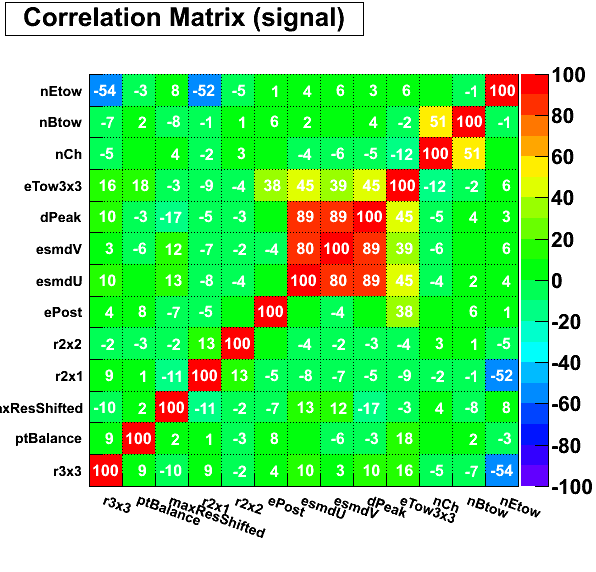
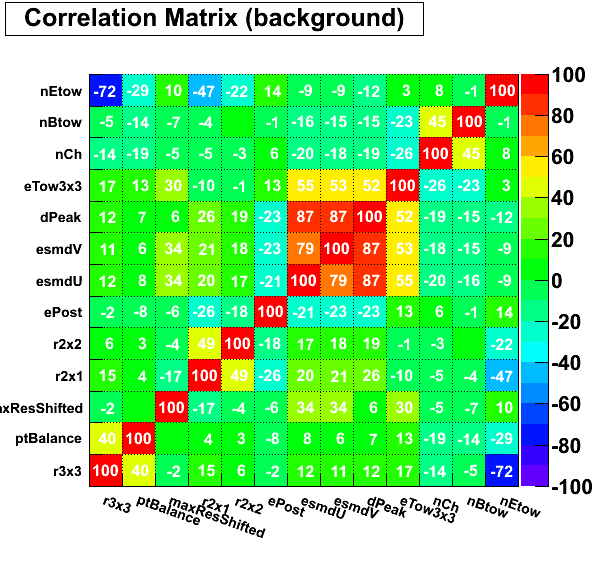
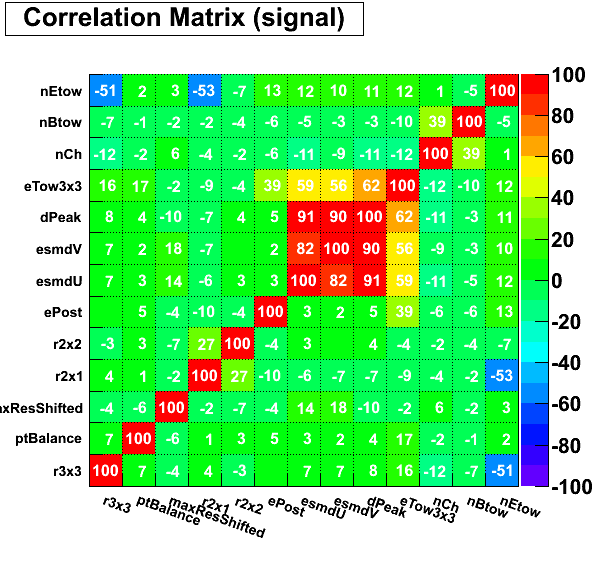
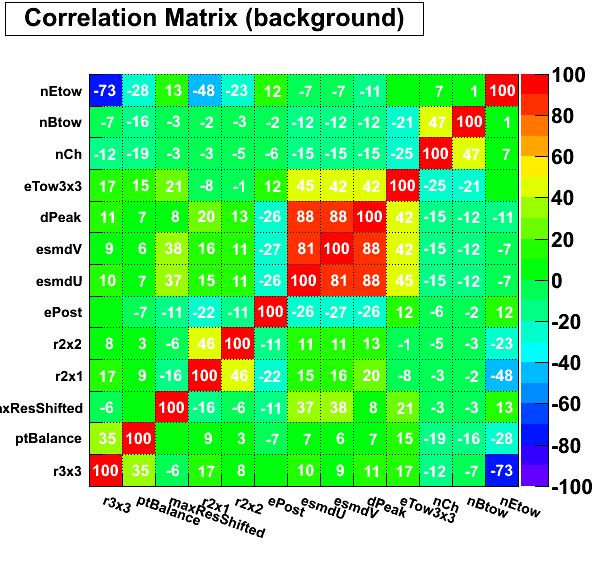
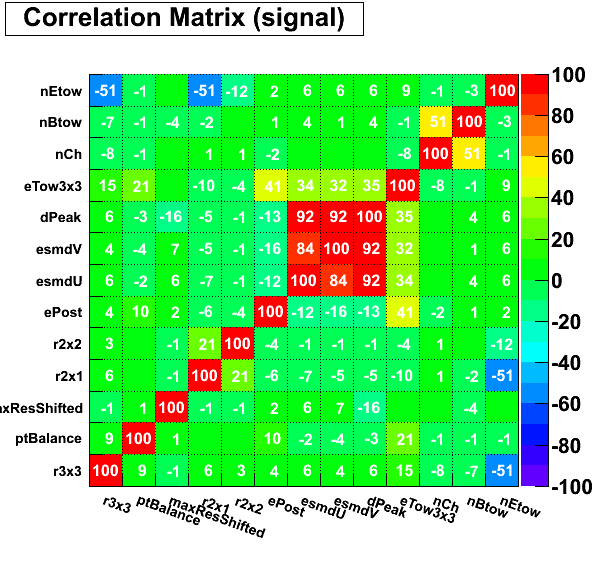
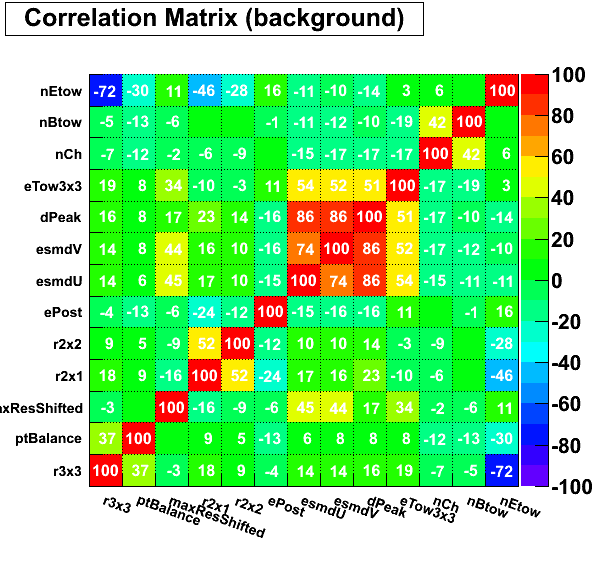
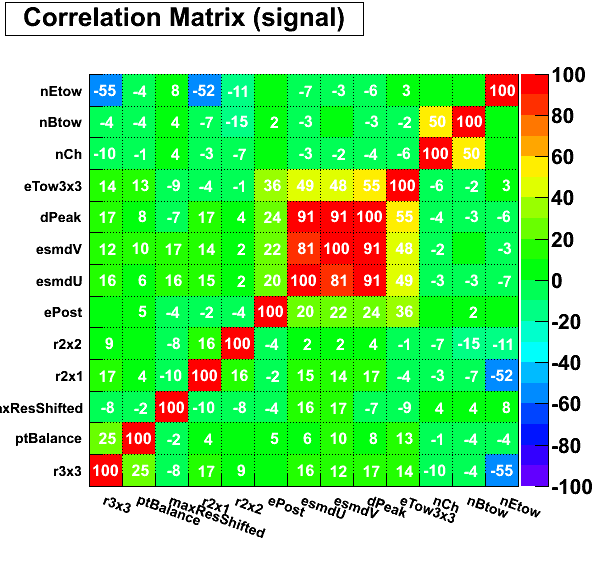
Figure 5: Correlation matrix (pt>7GeV cut)
pre1=0, pre2=0
pre1=0, pre2>0

0 < pre1 < 0.004
0.004 < pre1 < 0.01
pre1 < 0.01
pre1 >= 0.01
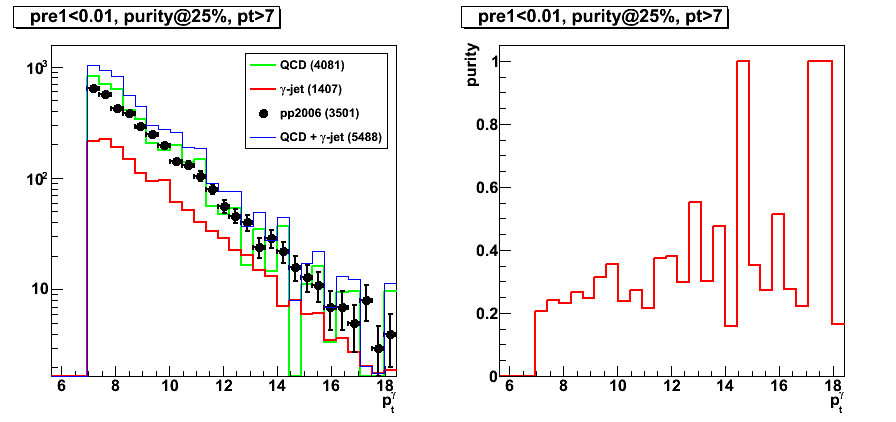
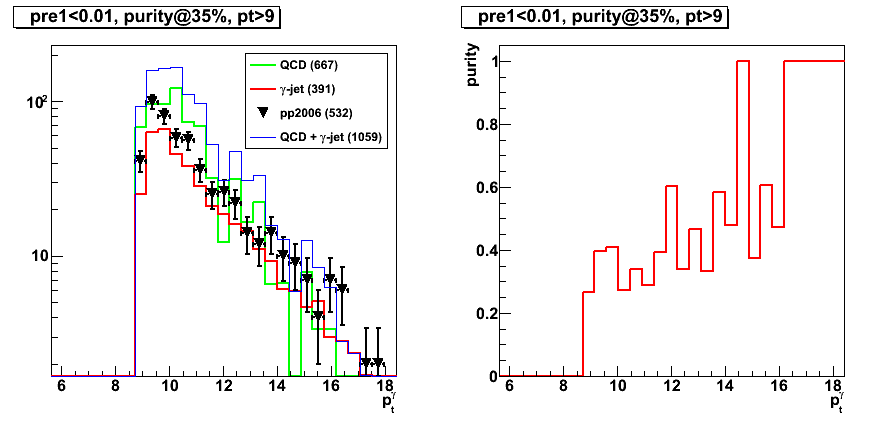
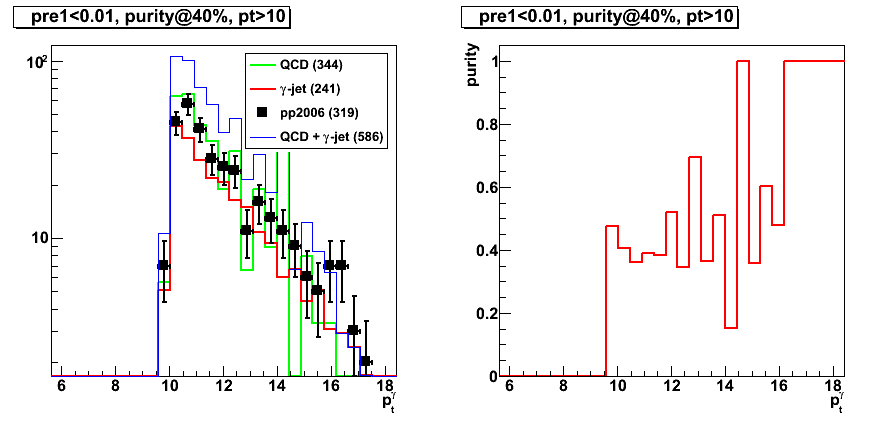
2009.05.06 Applying cuts on LDA: request minimum purity or efficiency
Cut optimization with Fisher's LDA classifier
For this post LDA input parameters Set4 has been used
LDA for various pre-shower bins is trained independetly,
and later results with pre-shower1<0.01 are combined.
There are a set of plots for various photon pt cuts (pt> 7, 8, 9 10 GeV)
and with different selection of cutoff for LDA
(either based on purity or efficiency).
Number in brackets shows the total yield for the sample.
Link to all plots (16 total) as a single pdf file
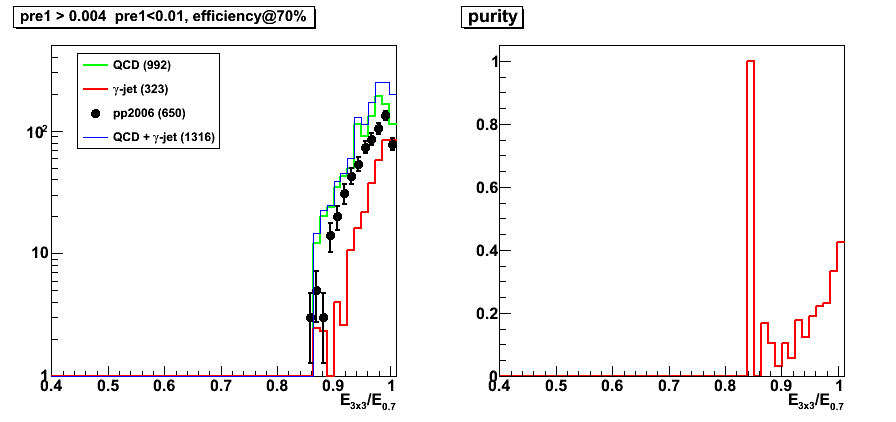
pt > 7GeV
Figure 1: pt > 7GeV, efficiency@70
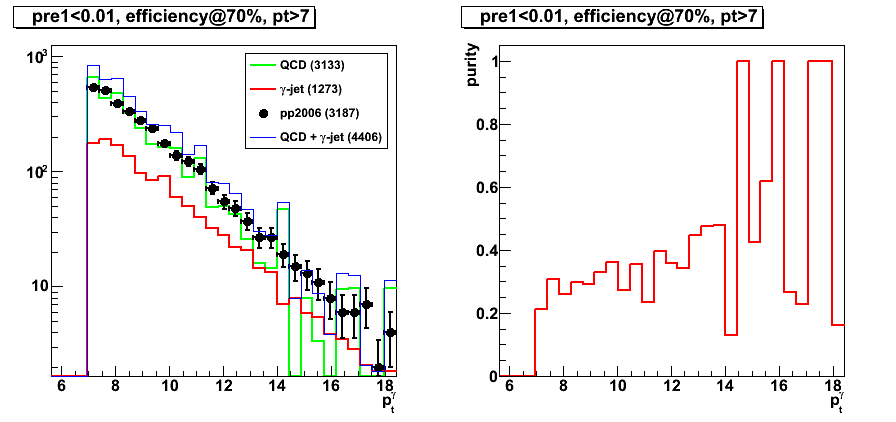
Figure 2: pt > 7GeV, purity@35
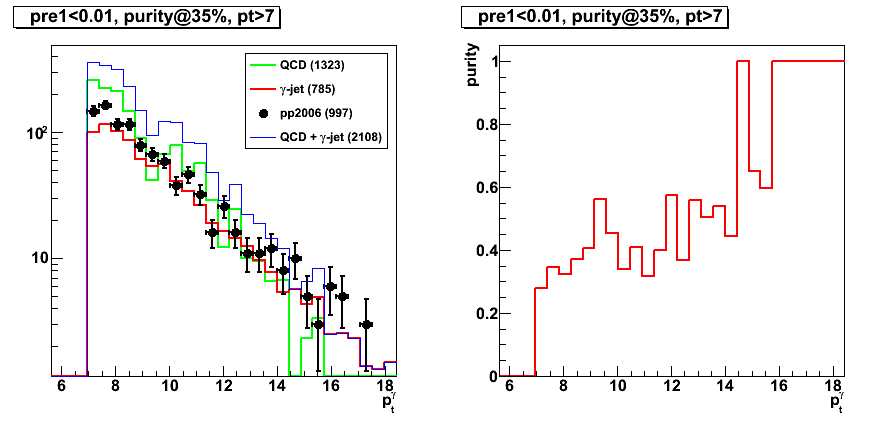
Figure 3: pt > 7GeV, purity@40
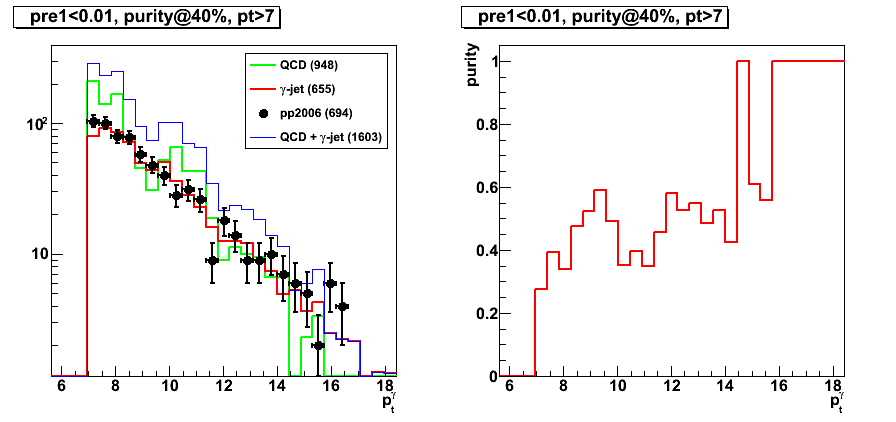
Figure 4: pt > 7GeV, purity@25 (Note: very similar to results with efficiency@70)
pt > 9GeV
Figure 5: pt > 9GeV, efficiency@70
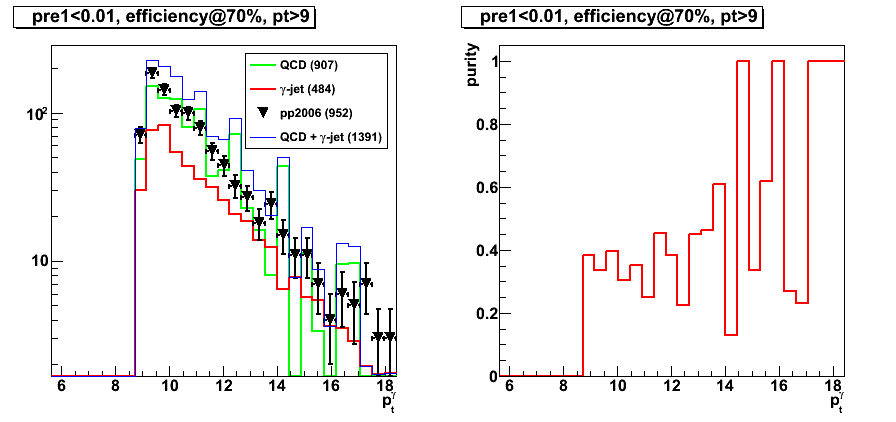
Figure 6: pt > 9GeV, purity@35
pt > 10GeV
Figure 7: pt > 10GeV, efficiency@70
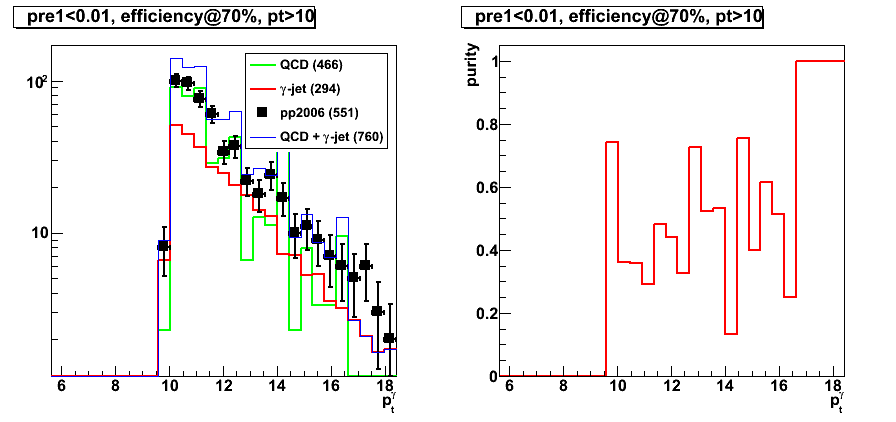
Figure 8: pt > 10GeV, purity@40
2009.05.07 Photon-jets analysis with the Endcap Calorimeter
Photon-jets with the Endcap Calorimeter
(analysis status update for Spin PWG)
Slides in pdf format:
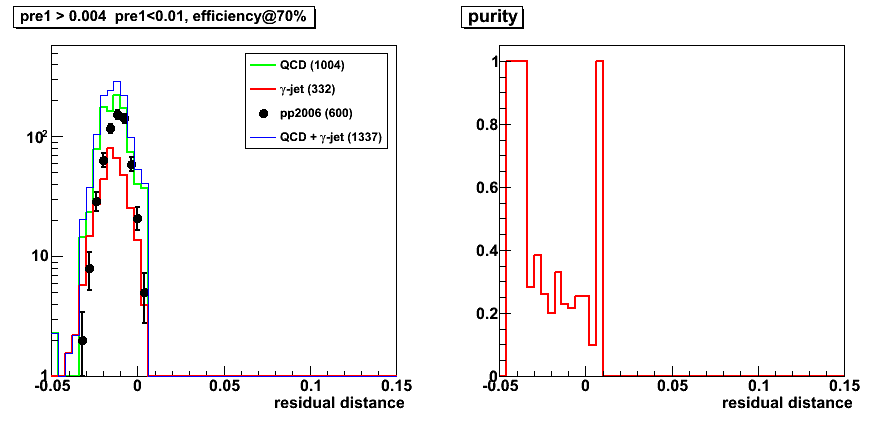
2009.05.12 Variable distributions after LDA at 70% efficiency
Cut optimization with Fisher's LDA classifier
For this post LDA results with Set1 and Set2 has been used
Note, that LDA for various pre-shower bins is trained independetly
pdf-links with results for pre1=0 and pre2=0 (pre-shower bin 1):
- before LDA cut (figures are not sorted)
- after LDA cut @70% efficiency for Set 2 (figures are not sorted)
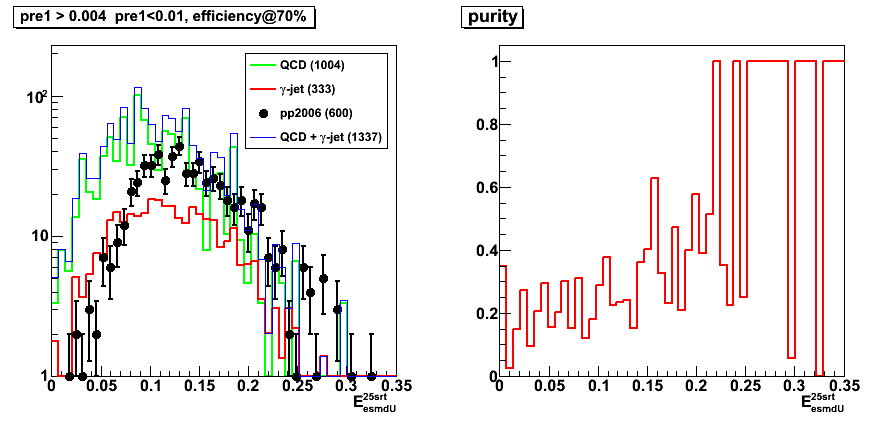
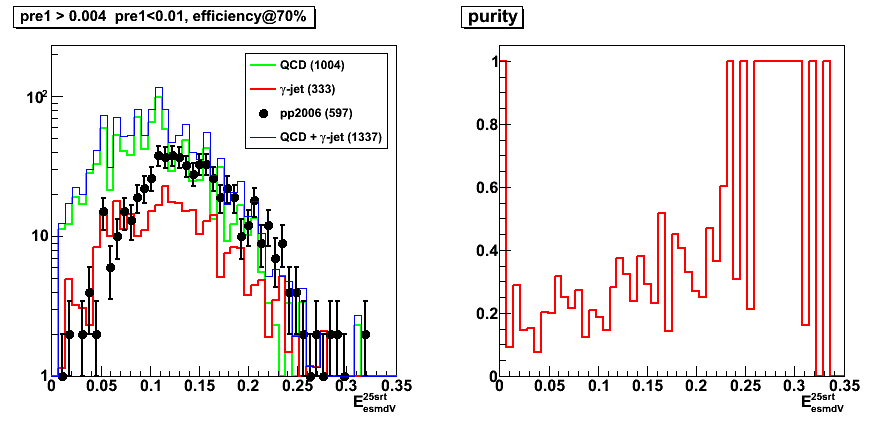
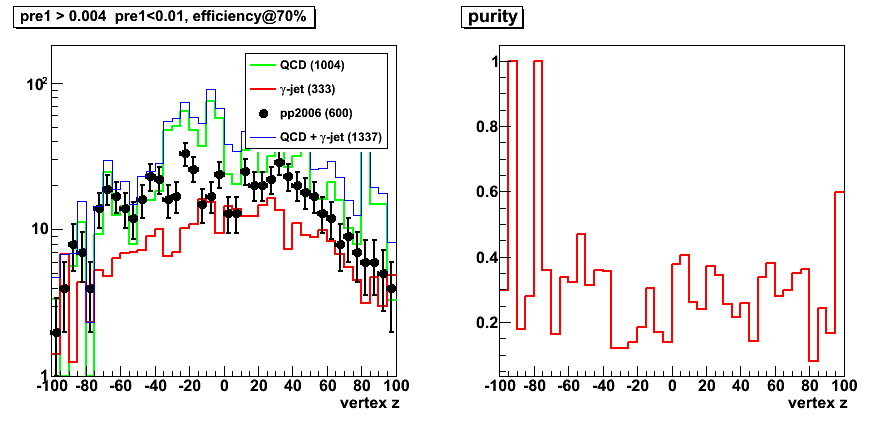
Figures below are for 0.004<pre-shower1<0.01 (pre-shower bin 4).
Photon pt cut: pt> 7, pre-shower bin: 0.004 < pre1 < 0.01
LDA cut with efficiency @ 70%
Set1 vs. Set2
What is added in Set2 compared to Set1:
smaller cluster size information (r2x1, r2x2), post-shower energy
Figure 1: r2x1
before LDA cut
LDA cut for Set1

LDA cut for Set2
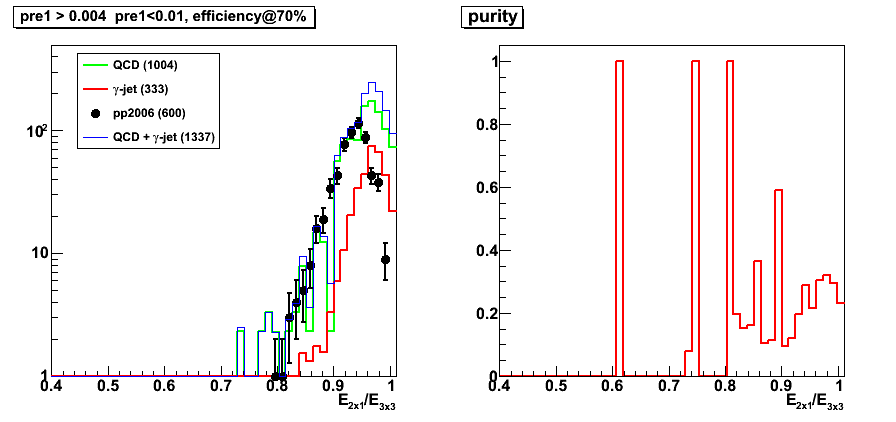
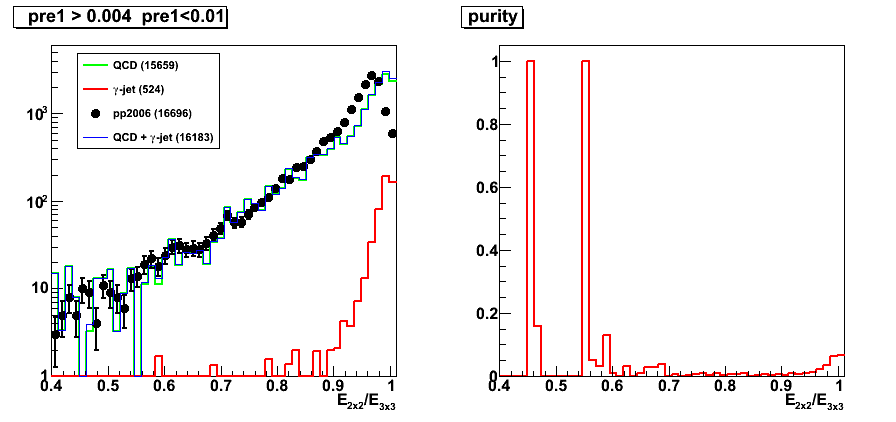
Figure 2: r2x2
before LDA cut
LDA cut for Set1
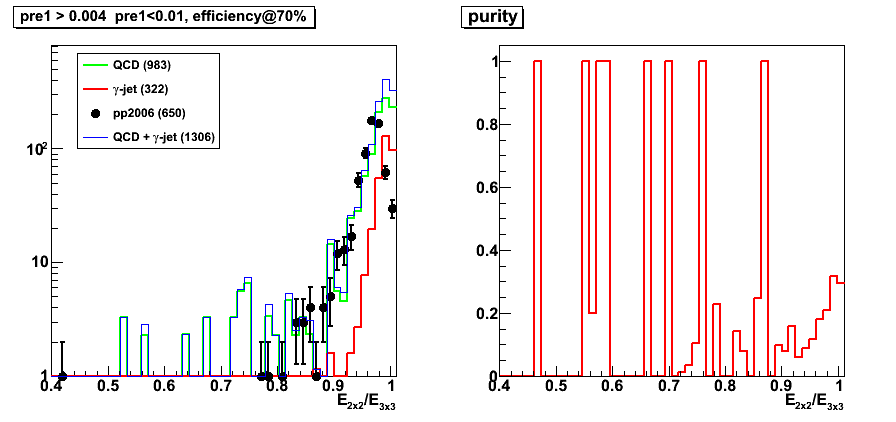
LDA cut for Set2
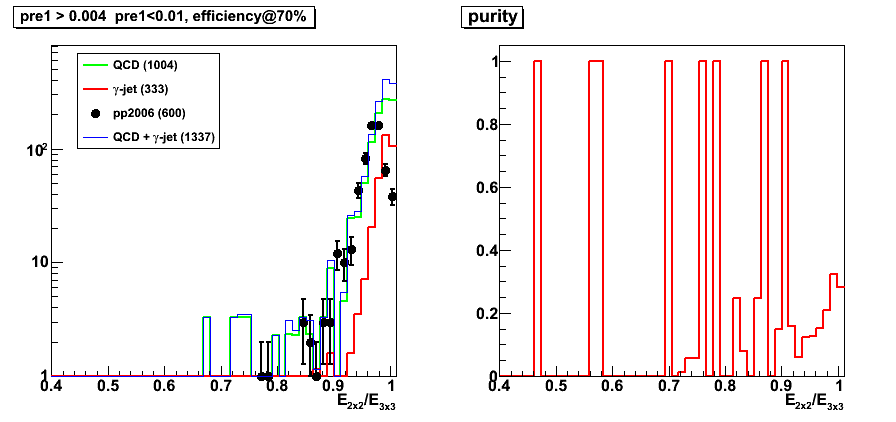
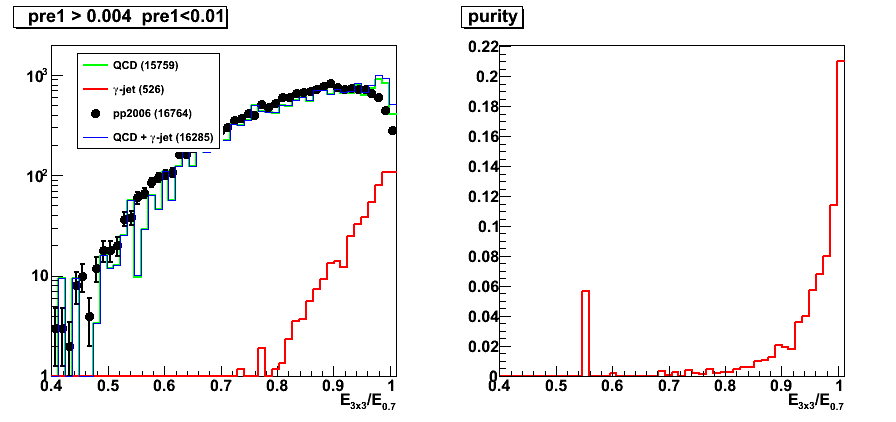
Figure 3: r3x3
before LDA cut
LDA cut for Set1
LDA cut for Set2
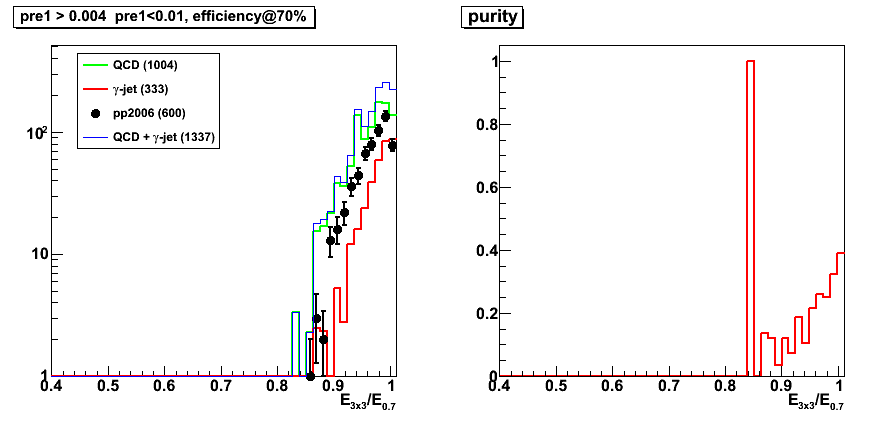
Figure 4: Residual distance
before LDA cut
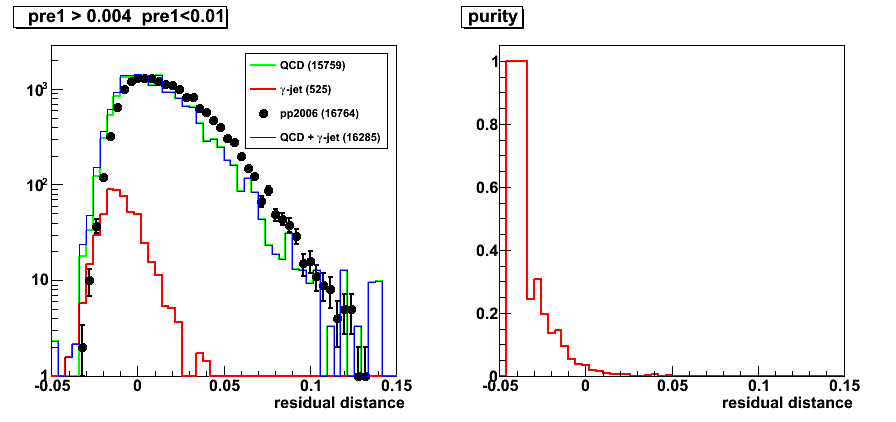
LDA cut for Set1
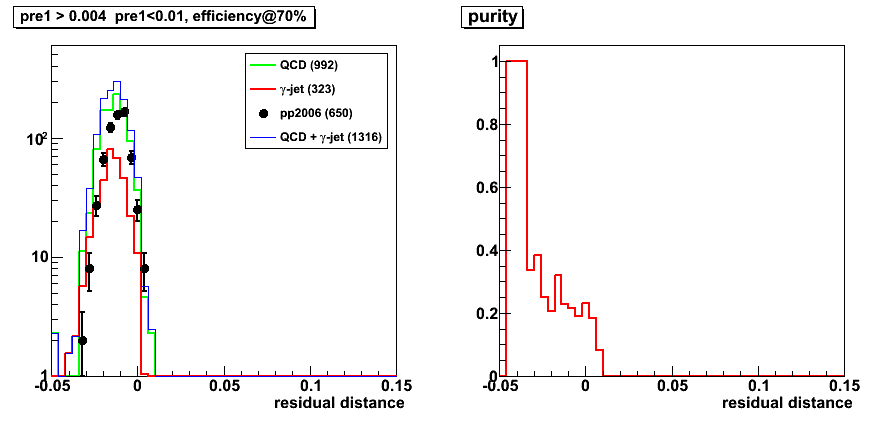
LDA cut for Set2
Other variables with LDA Set2 cut
Note: Only plos for LDA cut @70 efficiency for Set2 are shown
Figure : number of charge particles around photon
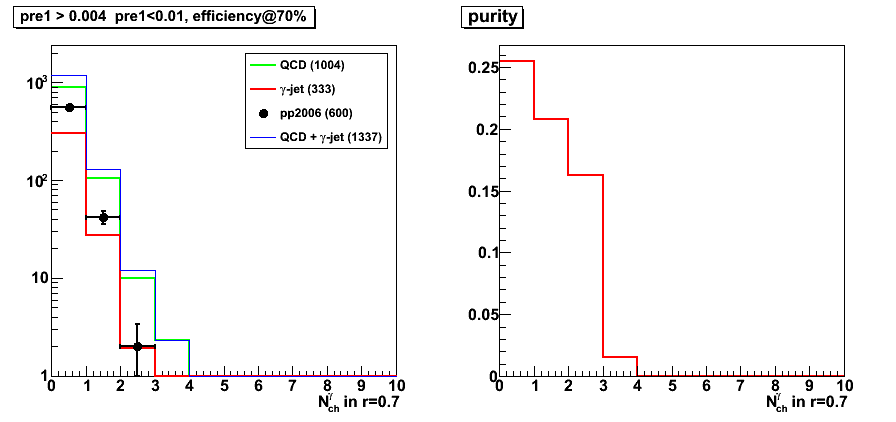
Figure 5: number of EEMC tower around photon
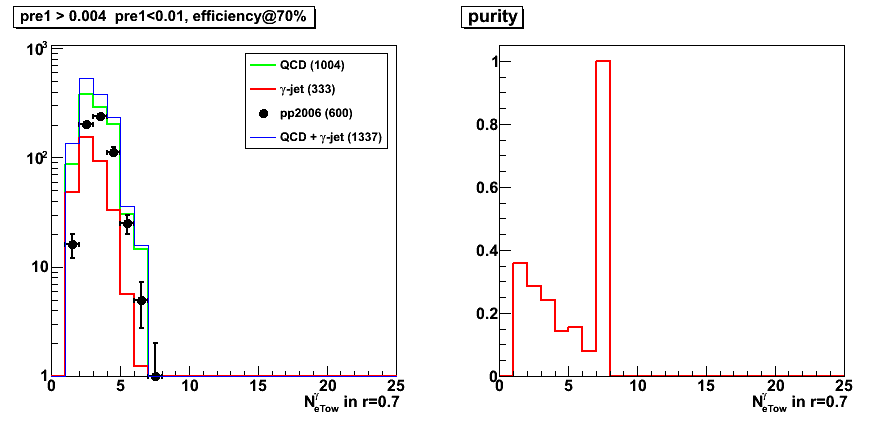
Figure 6: number of BEMC tower around photon
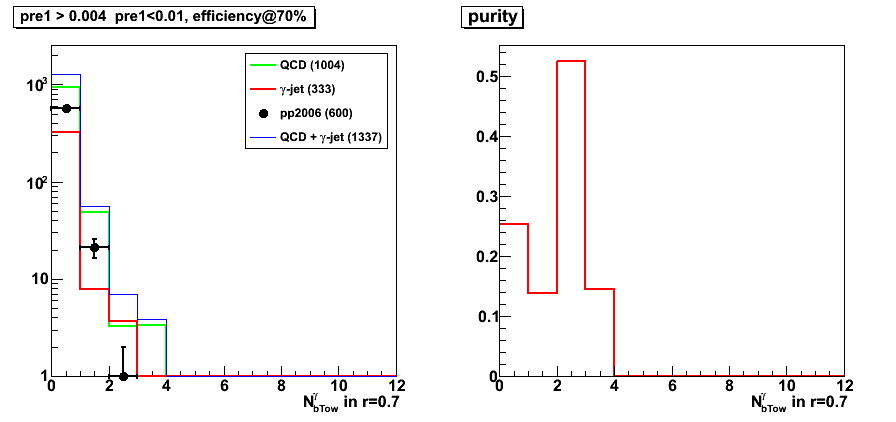
Figure 7: photon-jet pt balance
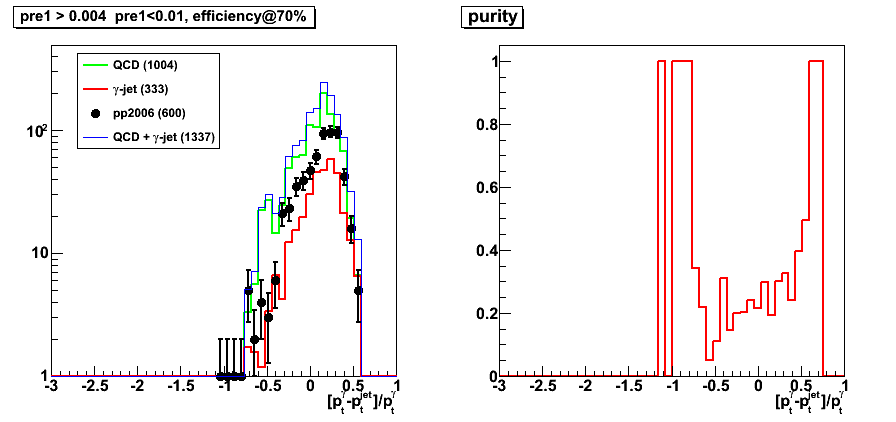
Figure 8: SMD energy in 5 centrapl strips
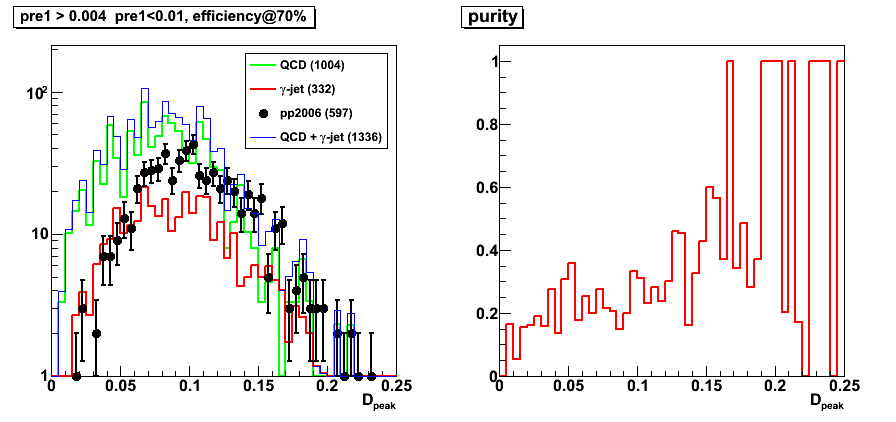
Figure 9: SMD energy in 25 central strips: u and v plane separately (plot for V plane)
Figure 10: 2x1 cluster energy
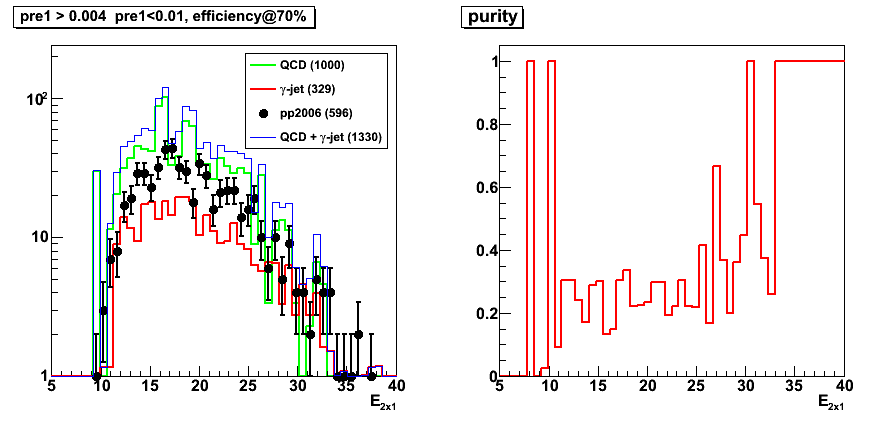
Figure 11: 2x2 cluster energy
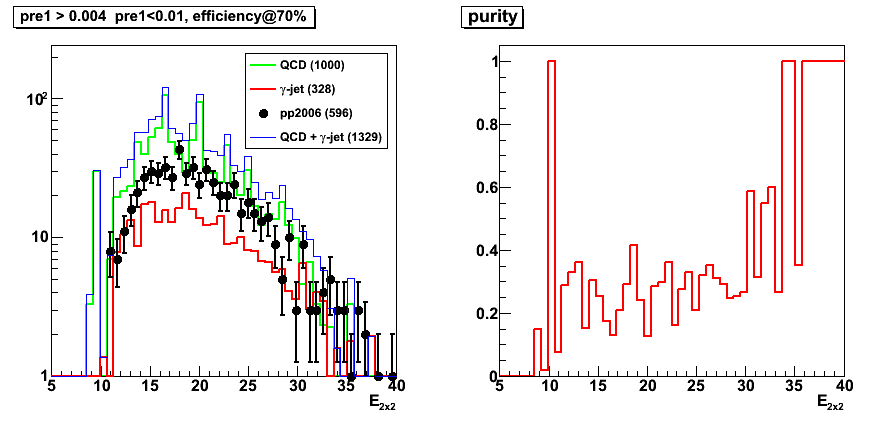
Figure 12: 3x3 cluster energy
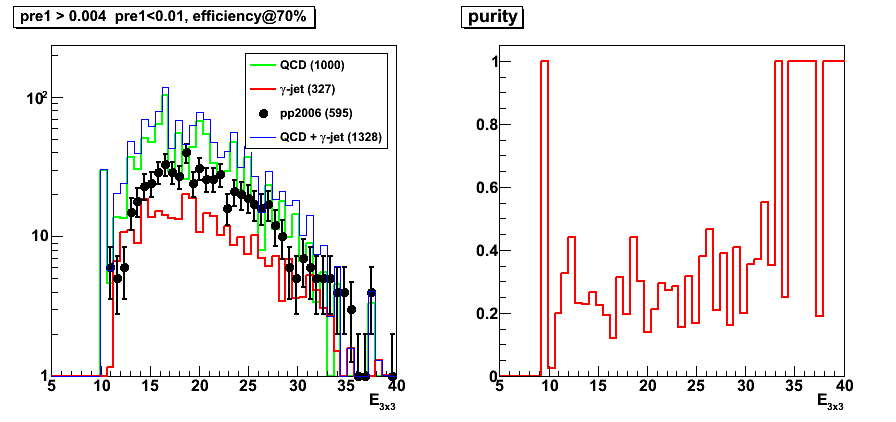
Figure 13: tower energy in r=0.7 radius
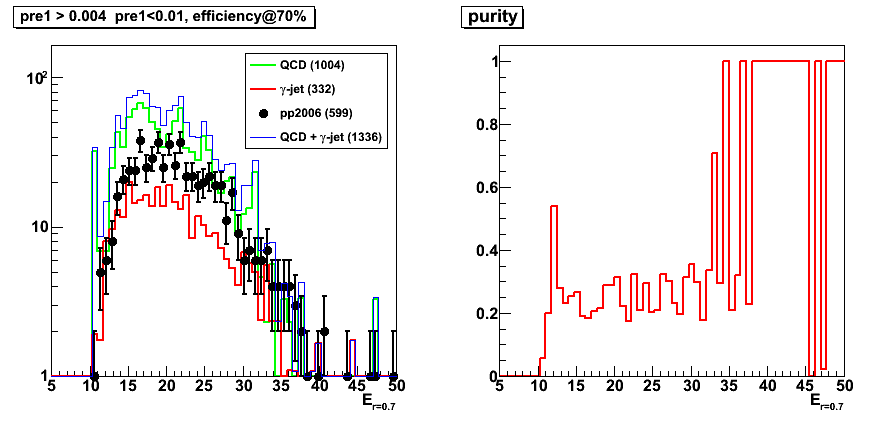
Figure 14: 3x3 pre-shower1 energy
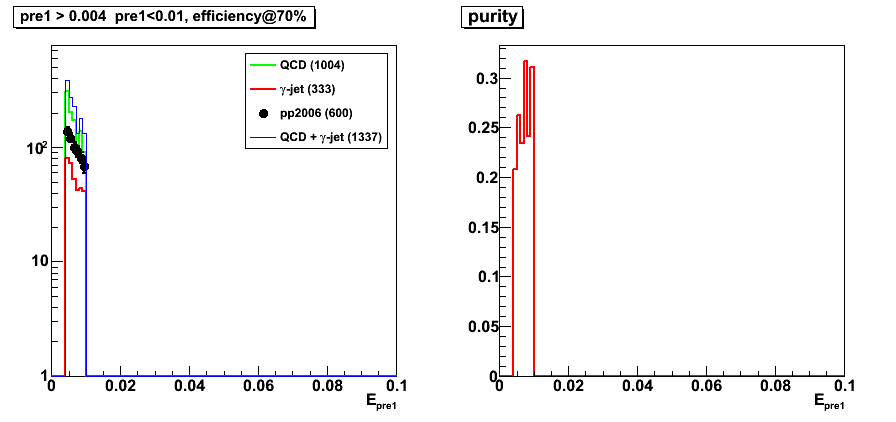
Figure 15: 3x3 pre-shower2 energy
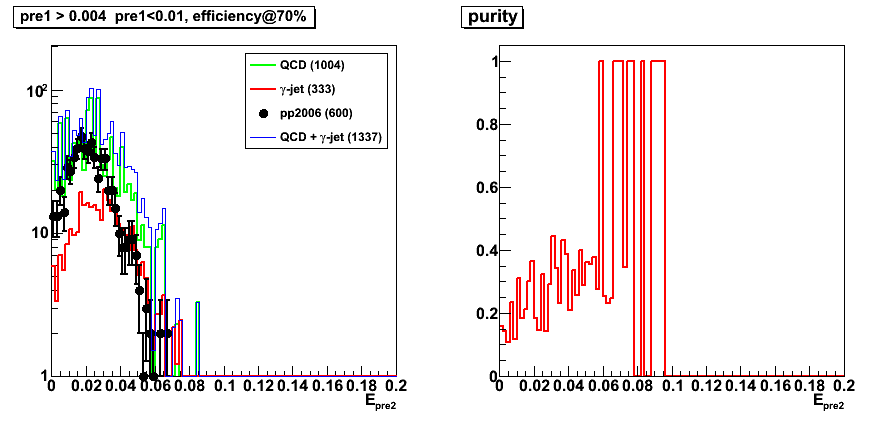
Figure 16: 3x3 post-shower energy
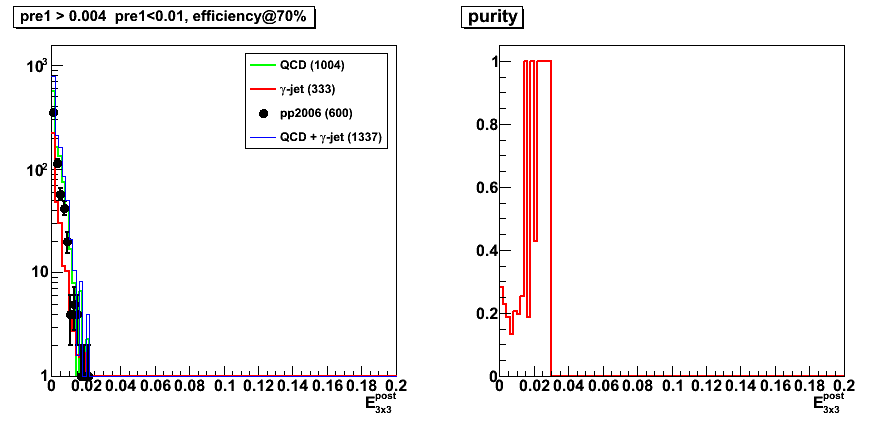
Figure 17: photon pt
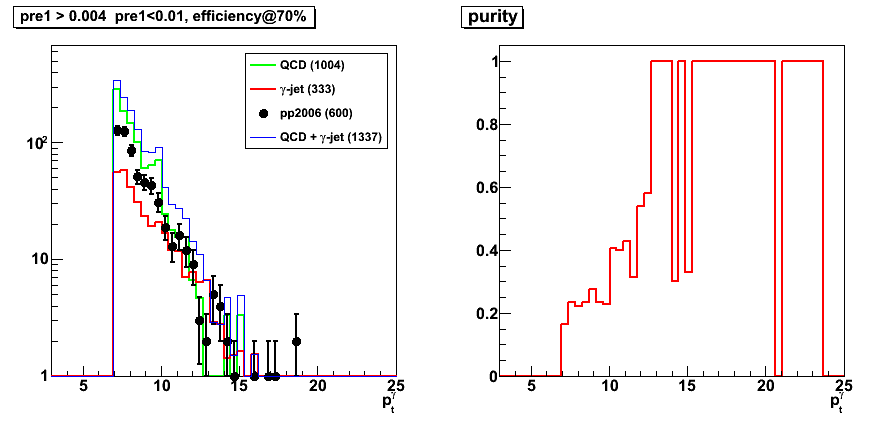
Figure 18: jet pt
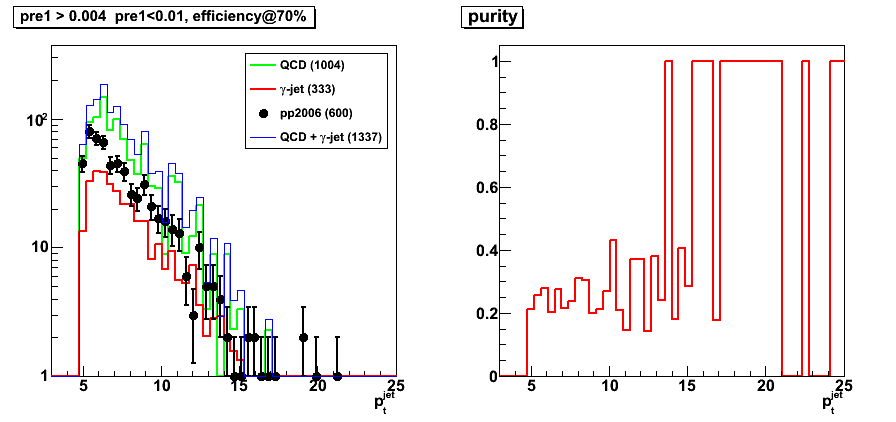
Figure 19: z vertex
2009.05.31 CIPANP 2009 photon-jet presentation
CIPANP 2009 presentation on photon-jet study
Title:
"Photon-jet coincidence measurements
in polarized pp collisions at sqrt{s}=200GeV
with the STAR Endcap Calorimeter"
- Presentation in pdf format
- Older versions: 0, 1, 2 3, 4, 5, open office file: odp
- Submitted abstract
- Conference link: CIPANP 2009