- BEMC
- BEMC Detector Operator Manual
- Calibrations
- Database
- Hardware
- Mapping
- Service Tasks
- Software
- Useful Documents
- EEMC
- ETOF
- FCS
- FGT
- FPD & FMS & FPS
- FTPC
- FTT
- HLT
- L3
- PMD
- PP2PP
- RICH
- Roman Pot Phase II*
- SSD
- SVT
- Slow Controls
- TPC
- TRG
- Trigger Detectors
- VPD
- test
Run 6 BTOW Calibration
Updated on Thu, 2009-09-03 16:42 by mattheww. Originally created by kocolosk on 2006-10-23 10:18.
Under:
Introduction
This is not the final calibration for the 2006 data, but it's a big improvement over what's currently in the DB. It uses MIPs to set relative gains for the towers in an eta ring, and then the absolute scale is set by electron E/p.
Isolation Cut Failures
This is a problem that we encountered in 2005, where several pairs of towers had good-looking spectra until the isolation cut was applied, and then quickly lost all their counts. Well, all of the towers that I had tagged with this problem in 2005 still have it in 2006, with one exception. Towers 1897 and 1898 seem to have miraculously recovered, and now towers 1877 and 1878 appear to have isolation failures. Perhaps this is a clue to the source of the isolation failures?
Dataset:
everything I could find on nov07:
<input URL="catalog:star.bnl.gov?production=P06ie,sanity=1,tpc=1,emc=1,trgsetupname= ppProduction||ppProductionTrans||ppProductionLong||pp2006MinBias||ppProductionJPsi||ppProduction62||ppProductionMB62, filename~st_physics,filetype=daq_reco_mudst" nFiles="all" />
Cuts:
Same as 2005. All MIP fits are basic Gaussians over the range 5..250 ADC-PED. Electron fits are Gaussian + linear in a very crude attempt to estimate hadronic background.
Working Directory:
/star/u/kocolosk/emc/offline_tower_calibration/2006/nov07/
Plots:
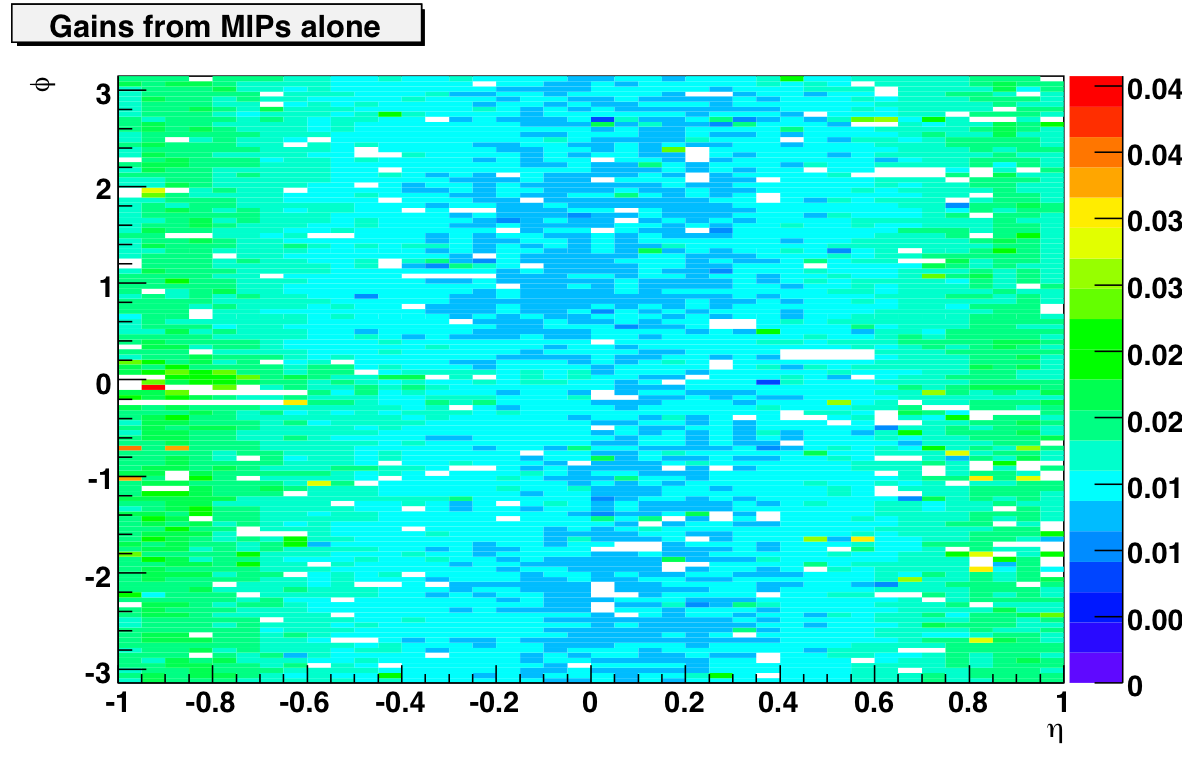
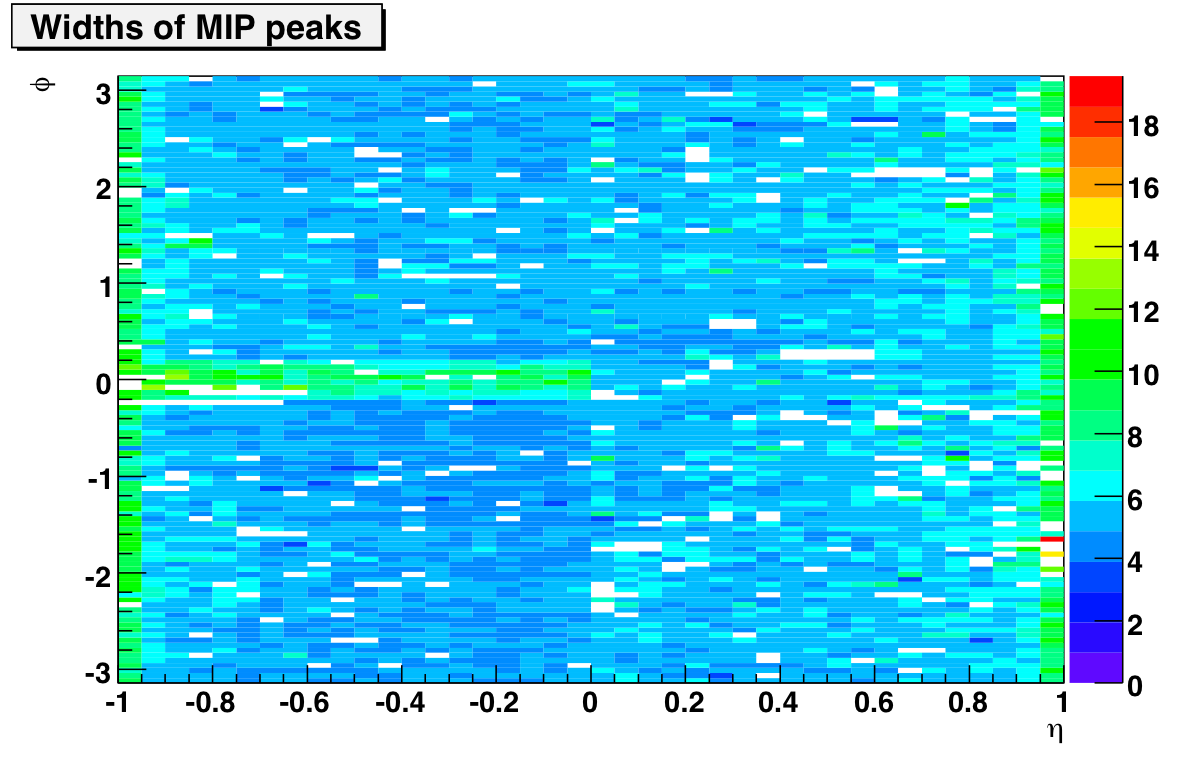
The gains look pretty balanced on the east side and west side. Note that I didn't multiply by sin(theta), so we expect an eta-dependence here. The widths plot is interesting because it picks out one very badly behaved crate on the east side at phi=0. I believe it is 0x0C, EC24E (towers 4020-4180). The tower fits are attached below if you're interested. Bad towers are marked in red.
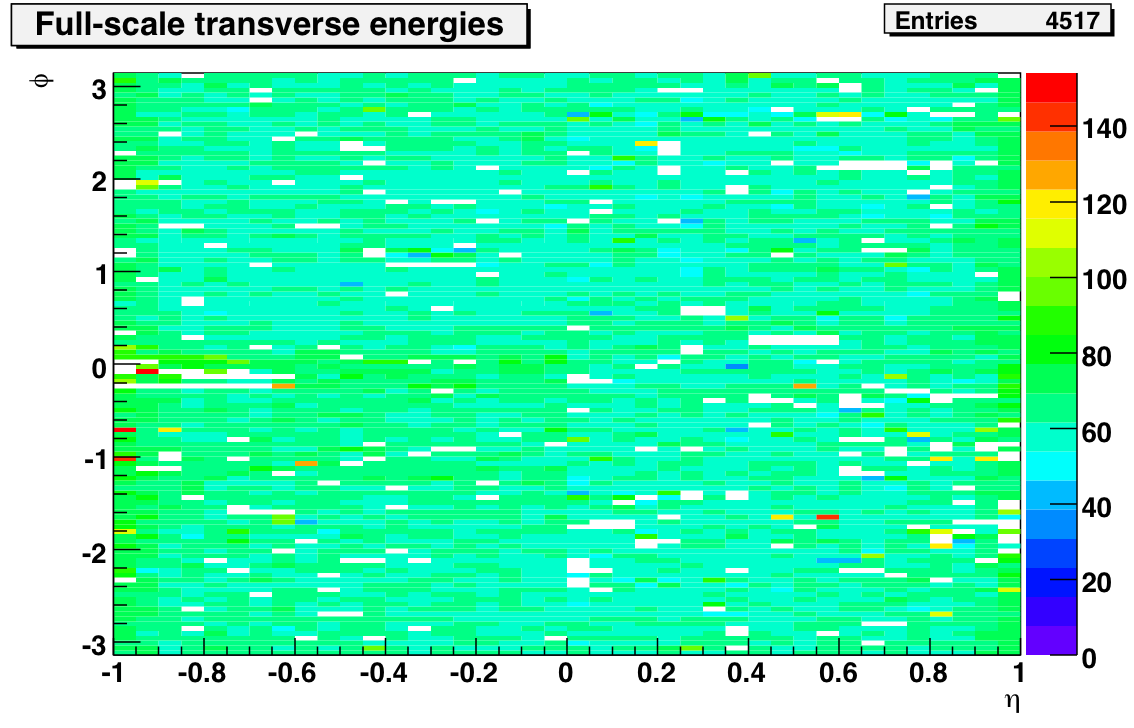
Electron Normalization:
E/p plots for all 40 eta-rings (first 20 on west side, 21-40 on east side) are attached below. In general, the electrons indicate a 9-10% increase in the MIP gains is appropriate. In the last two eta rings on each side, that number jumps to 20% and 40%. This is more or less consistent with the scale factors found in the 2003 calibration (the last time we used a full-scale energy of 60 GeV. If I scale the MIP gains and plot the full-scale E_T I get the plot on the left. Fitting the eta dependence with a pol0 over the middle 36 eta rings results in a ~62 GeV scale and a nasty chi2.
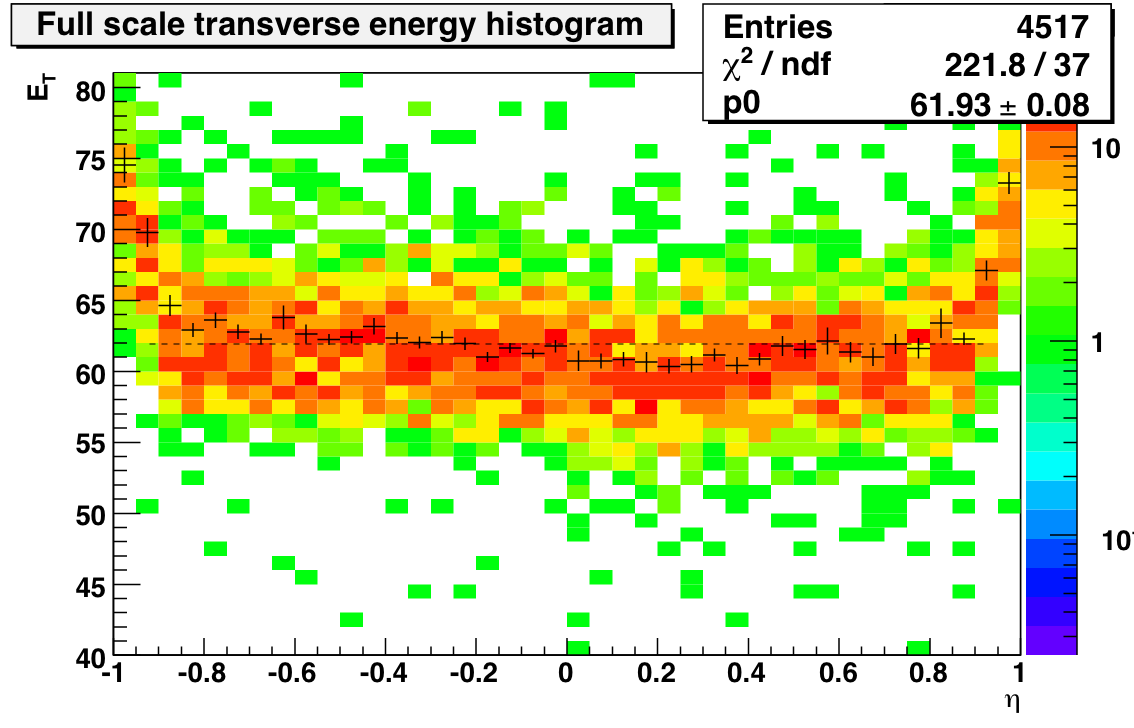
So after scaling with the electrons it looks like we are actually a couple of GeV high on the absolute scale. I'll see if this holds up once I've made the background treatment a little more sophisticated there. I also have to figure out what went wrong with the electrons out at the edges. I didn't E/p would be that sensitive to the extra material out there, but for some reason the normalization factors out there are far too large. Next step will be to comapre this calibration to one using electrons exclusively.
Calibration Uncertainty:
Here are some links that address different parts of the calibration uncertainty that are not linked from this page:
drupal.star.bnl.gov/STAR/subsys/bemc/calibrations/run6/btow/calibration-uncertainty-calculation
drupal.star.bnl.gov/STAR/blog-entry/mattheww/2009/apr/09/2006-calibration-uncertainty
drupal.star.bnl.gov/STAR/blog-entry/mattheww/2009/apr/27/crate-systematic-2006
»
- Printer-friendly version
- Login or register to post comments