SpaceCharge studies
Studies of SpaceCharge in the TPC.
Potential distortions at projected luminosities for different species
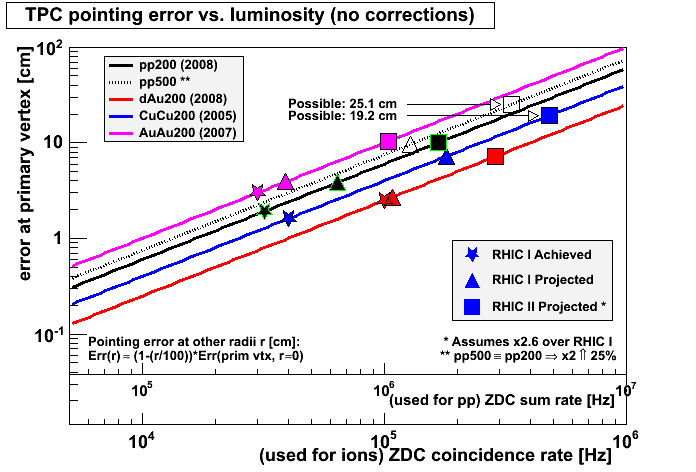
Here I show the expected distortions in the STAR TPC as represented by the pointing error of tracks to the primary vertex (otherwise known as the DCA) due to experienced (star symbols) and projected luminosities (triangle and square symbols) at RHIC. One can think of these distortions as being caused by the accumulated ionization in the TPC due to charged particles traversing it from collisions (ignoring any background contributions), or the charge loading of the TPC.
These measurements and projections are current as of November 2008 with the exception of the pp500 (pp collisions at √s = 500 GeV) projections (open symbols) [1,2]. In 2005 the expectation was that RHIC II could achieve pp200 peak luminosities of 150 x 1030 cm-2sec-1 and pp500 peak luminosities of 750 x 1030 cm-2sec-1 [3]. Presently (2008), the pp200 peak luminosity estimate at RHIC II has dropped to 70 x 1030 cm-2sec-1, and this is what is used in my plot. I have found no current estimate for pp500. The 2005 estimate indicated a factor of x5 more peak luminosity from the 500 GeV running than 200 GeV; I do not know if that is still possible, but I have chosen to use only a factor of x2 (should be conservative, right?) in the plot shown here.
I have also had to estimate the conversion of luminosity into load in the TPC for pp500 as we have not yet run this way. We did run at √s of approximately 405 GeV in June 2005, which showed a 17% increase in load over pp200 per the same BBC coincidence rate [pp400 (2005)]. I have roughly estimate that this means approximately a 25% increase in TPC load going from pp200 to pp500, with no serious basis for doing so.
Finally, the documented projections show that RHIC II will achieve approximately a factor of x2.6 increase over RHIC I for both AuAu200 and pp200 [2]. I have taken the liberty to apply the same factor of x2.6 to CuCu200, dAu200, and pp500.
(Note: The pp data use a different horizontal axis which was adjusted to lie amidst the ion data for ease of comparison, not for any physically justified reasons.)

Of the data we've taken so far, AuAu collisions have presented the highest loading of the TPC. However, CuCu collisions have the potential to introduce the highest loading for ions, and the RHIC II projections lead to pointing errors close to 20 cm! Actually, SiSi may be even worse (if we ever choose to collide it), as the luminosity is expected to achieve a factor x4.2 higher than CuCu, while the load per collision may be in the 40-50% ballpark of CuCu [2,3].
Loading due to pp collisions at 200 GeV are generally similar to AuAu collisions at 200 GeV, but 500 GeV pp collisions will load the TPC much more severely. Even in RHIC I, we may have pointing errors between 5-10 cm using my conservative estimate of x2 for the luminosity increase over pp200. If the factor of x5 is indeed possible, then use of the TPC in pp500 at RHIC II seems inconceivable to me, as the simple math used here would completely break down (the first TPC padrows are at 60cm, while 2.5*25.1 cm is larger than that)**. Even with a factor of x2, things may be quite problematic for pp500 in RHIC II.
References:
Some additional discussions from 2005 regarding the TPC and increased luminosities are documented at Long term life time and future of the STAR TPC.
Note: This is an update of essentially the same plot shown in the 2007 DAQ1000 workshop (see page 27 of the S&C presentation).
** Actually, a rather major point: we never get full length tracks with DCAs to the primary vertex of more than a couple cm anyhow, due to the GridLeak distortion. These tracks get split and the DCAs go crazy at that point. Since GridLeak distortion corrections are only applied when SpaceCharge corrections are, an roughly appropriate SpaceCharge+GridLeak correction must be applied first to even find reasonably good tracks from which to determine the calibration.
SpaceCharge in dAu
In Run VIII, dAu data was acquired at high enough luminosities to worry about SpaceCharge (it was ignored previously in the Run III dAu data (2003)). Attached is initial work by Jim Thomas to determine the charge distribution in dAu.