FGT. . . . . . . . . . S O F T W A R E
Current Software task list. Manpower and results
docs.google.com/spreadsheet/ccc
Database Access
How to access database:
- Instantiate StFgtDbMaker -> StFgtDbMaker *myStFgtDbMaker=new StFgtDbMaker();
- Then get tables -> StFgtDb * fgtTables = myStFgtDbMaker->getDbTables();
- Now you can go get whatever geometry stuff you might need from StFgtDb. For example:
- fgtTables->getPhysicalCoordinateFromGeoId(geoId, &disc, &quad, &layer, &ordinate, &lower, &upper);
- fgtTables->getGeoIdfromElecCoord(rdo, arm, apv, ch);
Electronic ID Formula:
if ( apv > 11 ) apv = apv - 2;
ElectId = channel + 128 * ( apv + 20 * (arm + 6 * ( rdo - 1) ) );
General Database Info (from Dmitry)
1. For real .daq files processing, timestamp is taken from event - it cannot be set by user. For example, if event timestamp is XYZ, then db maker will get db entries with time validity spanning from [XYZ - some_time_1] to [XYZ + some_time_2] where some_time1 is the beginTime of the db entry received, and some_time_2 is the beginTime of the next db entry with beginTime > XYZ.
2. DBV option (in chain) only freezes validity range, which means "do not consider calibrations uploaded later than DBVXXYYZZ". This allows to reproduce any past conditions. So, if you set DBV to today's date, you will get latest calibration dataset. If you set it to some past date (e.g. 2010-01-01) then you will get only those datasets which were uploaded before 2010-01-01. So, tables are read using both beginTime and entryTime..
FGT Pedestal Maker, Reader, and Plotter
See Renee's instructions how to create and upload pedestals/status attached
-----------------
I had hoped to write this tutoral once all code was in CVS and I had automated all of the loading and writing scripts. Unfortunately these conditions are only partially fullfilled at this time, so this procedure describes how to make pedestal and status files needed to load to the database:
- mkdir FgtPed
- cd FgtPed
- stardev
- cvs co StRoot/StFgtPool/StFgtRawDaqReader
- cvs co StRoot/StFgtPool/StFgtCosmicTestStandGeom
- cvs co StRoot/StFgtPool/StFgtPedMaker
- cvs co StRoot/StFgtPool/StFgtStatusMaker
- cvs co StRoot/StFgtPool/StFgtQaMakers
- cons
- cvs co StRoot/StFgtPool/StFgtQaMakers/macro/makeFgtPedAndStat.C
You will need to open makeFgtPedAndStat.C and set the database time manually (next step is to automate this). This timestamp is used to get the correct mapping:
- dbMkr->SetDateTime(20121108,000000);
- Filename.FGT-ped-DB.dat
- Filename.FGT-ped-stat-info.txt
- Filename.FGT-ped-stat.pdf
- Filename.FGT-ped-stat.ps
- Filename.FGT-ped-stat.root
- Filename.FGT-ped-stat.txt
- Filename.FGT-stat-DB.dat
- fgtMapDump.csv
- cvs co StRoot/StFgtUtil/database/macros/write_fgt_pedestal.C
- cvs co StRoot/StFgtUtil/database/macros/write_fgt_status.C
- cvs co StRoot/StFgtUtil/database/macros/fgtPedestal.h
- cvs co StRoot/StFgtUtil/database/macros/fgtStatus.h
Software for computing (making), reading (from file or DB) and plotting pedistals has been written. The DB functionality is not fully implemented as of Jan 10, 2012.
Files
The current code for reading and writing pedistals is contained in the following files
$CVSROOT/offline/StFgtDevel/StRoot/StFgtPedMaker/StFgtPedMaker.h
$CVSROOT/offline/StFgtDevel/StRoot/StFgtPedMaker/StFgtPedMaker.cxx
$CVSROOT/offline/StFgtDevel/StRoot/StFgtPedMaker/StFgtPedReader.h
$CVSROOT/offline/StFgtDevel/StRoot/StFgtPedMaker/StFgtPedReader.cxx
An example of using the pedistal maker is in the file
$CVSROOT/offline/StFgtDevel/StRoot/StFgtPedMaker/macro/makeCosmicPeds.C
An example of using the pedistal reader is in the file
$CVSROOT/offline/StFgtDevel/StRoot/StFgtPool/StFgtPedPlotter/macro/plotPedsFromFile.C
An auxillary class to make a nice plot of pedistals is found in the files
$CVSROOT/offline/StFgtDevel/StRoot/StFgtPool/StFgtPedPlotter/StFgtPedPlotter.h
$CVSROOT/offline/StFgtDevel/StRoot/StFgtPool/StFgtPedPlotter/StFgtPedPlotter.cxx
After the software review, it is expected to move these files to StRoot instead of offline/StFgtDevel/StRoot
StFgtPedMaker
The StFgtPedMaker is designed to use the FGT online containers in StEvent. The pedistals are the mean ADC value over all events processed by the chain, while the "RMS" is actually the standard deviation. Running sums are computed in the StFgtPedMaker::Make function, and the final values are computed in ::Finish member function. The values can then be written to a file, which contains four columns: (1) geoId of the strip (2) timebin (3) pedistal, i.e. mean ADC (4) RMS, i.e. st. dev.
The pedistal maker has the following user functions to modify the options:
   void setToSaveToFile( const Char_t* filename );
   void setToSaveToDb( Bool_t doIt = 1 );
   void setTimeBinMask( Short_t mask = 0xFF );
To save to file, one uses the "setToSaveToFile" function and passes the filename to which the information should be saved. The "setToSaveToDb" function is not yet implemented. It was decided not to allow this functionality in this class, but rather have a decidated macro to upload a text file generated by this class into the DB. The time bin mask is set via the "setTimeBinMask" function. All time bins which are flagged "false" in the mask will be ignored. Note: time bin 0x01 is the 0th time bin, 0x10 is the 4th time bin, etc.
The status of the strips (e.g. dead, broken, and/or hot strips) is not considered in making the pedistals. All pedistals are computed for the time bins specified in the time bin mask. As status of the strips is given by the StFgtStatusMaker/Reader, it is expected that the code querying the StFgtPedReader for a pedistal will also query the StFgtStatusReader for a status of the strip, and then choose to act accordingly. In this manner, the status does not have to be computed before computing the pedistals, but instead should be computed before using the pedistal information.
StFgtPedReader
It was anticipated that all calls for pedistals, in all software, would use the StFgtPedReader. The StFgtPedReader initially either loads the pedistals from file, or from the database, and holds them in an associative array, allowing both sparse data and for fast look ups. In future versions, one could change the implimentation to a static array, if one desired faster processing but a larger memory imprint. The code has the following accessor function, to read the time bine for a given geoId and time bin:
   // accessor: input is geoId and timebin, output is ped and
   // st. dev. (err).  Returns error if pedistal not found for given geoId and timebin
   Int_t getPed( Int_t geoId, Int_t timebin, Float_t& ped, Float_t& err ) const;
One can also set a time bin mask via
void setTimeBinMask( Short_t mask = 0xFF );
Time bins with bits set to false will be ignored. The fewer time bins loaded, the faster the initial load and the faster the look up time for each individual geoId afterwards.
The DB interface still needs to be programmed as of Jan 10, 2012.
StFgtPedPlotter
This produces a nice plot of the pedistals for a given quadrant (10 APVs). The procedure is straight forward. See the macro and the code for an example of how this is done. Note: the ped. plotter gives an example of how to use the ped. reader.
Comments
Usually 2,000 are used to compute pedistals. The amount of time taken by the StFgtPedReader/Maker is significantly less than the amount of time used by the RawMaker to create the FGT containers in the StEvent and read the DAQ file from disk, and therefore can be considered negligible for the present.
An example pedistal file is attached. This file is from the cosmic test stand, when quadrants 008, 018, 007 were on the top, middle, and bottom possition, respectively. Plots of typical pedistal RMS can be found on page 1 of the QA plots produced during the cosmic test stand. The base directory is http://www.star.bnl.gov/protected/spin/sgliske/fgtCosmicQA/, from which you can then select a quadrant, and then select a .pdf file. The files are named via the quandrant and the time the data was taken.
FGT Simulation
Random notes from email exchanges:
A bfc that produces muDsts from simulation files looks like this
root4star -b bfc.C'(10,"MakeEvent,ITTF,NoSsdIt,NoSvtIt,Idst,VFPPVnoCTB,logger,-EventQA,-dstout,tags,Tree,EvOut,analysis,dEdxY2,IdTruth,useInTracker,-hitfilt,tpcDB,TpcHitMover,TpxClu,McAna,fzin,y2012,tpcrs,geant,geantout,beamLine,eemcDb,McEvOut,bigbig,emcY2,EEfs,bbcSim,ctf,-CMuDST,sdt20120501.060500","pp200_QCDprodMBc.fzd")' -q > & Log1
There is an fzd file in avossen/tmp/4jason/
The code is available at
StRoot/StFgtSimulator/
and should also be available as
The bfc to run it is in StRoot/StFgtSimulator/macros/bfc.C
You can run it from the StFgtDevel dir with the following
command line:
%root4star -b
StRoot/StFgtSimulator/macros/bfc.C'(10,"MakeEvent,ITTF,NoSsdIt,NoSvtIt,Idst,VFPPVnoCTB,\
logger,-EventQA,-dstout,tags,Tree,EvOut,analysis,dEdxY2,\
IdTruth,useInTracker,-hitfilt,tpcDB,TpcHitMover,TpxClu,\
McAna,fzin,y2012,tpcrs,geant,geantout,beamLine,eemcDb,\
McEvOut,bigbig,emcY2,EEfs,bbcSim,ctf,-CMuDST","pp200_QCDprodMBc.fzd")'
Legend for Status in DB
Strip Status
Status bits are failure states, i.e. status of 0 is good, anything else is bad. Strip status bits are defined as
- bit 1: pedestal out of range (current range is 100-1200 ADC)
- bit 2: RMS out of range (current range is 10-80 ADC)
- bit 3: Fraction of integral near pedestal value (i.e +/- 1 RMS of the pedestal) out of range (current range is 0.6 to 0.95)
- bit 4: not used
- bit 5: APV chip bad (threshold is currently 64 dead strips)
- bit 6: strip not connected
Note, for bit 5, all strips are set to have this bit fail if more than the threshold number of strips on this APV failed the tests corresponding to bits 1-3.
Mapping for Run13
See
drupal.star.bnl.gov/STAR/event/2012/12/07/fgt-weekly-meeting-0/fgt-run13-daq-cable-mapping
Offline Software
Getting started with plots for the FGT
(some old documentation on how to read MuDSTs: drupal.star.bnl.gov/STAR/blog/avossen/2012/apr/26/how-read-mudsts)
Prepare your libraries
If you're brand new or starting fresh directory for FGT, you'll need to check out some files... This is a list of all the offline FGT software you're likely to need for whatever it is you're working on...
> mkdir mydir
> cd mydir
> cvs co StRoot/RTS
> cvs co StRoot/St_base
> cvs co StRoot/StEvent
> cvs co StRoot/StFgtA2CMaker
> cvs co StRoot/StFgtClusterMaker
> cvs co StRoot/StFgtDbMaker
> cvs co StRoot/StFgtPool
> cvs co StRoot/StFgtRawMaker
> cvs co offline/StFgtDevel/StRoot/StMuDSTMaker
> ln -s offline/StFgtDevel/StRoot/StFgtMuDSTMaker/ StRoot/StFgtMuDSTMaker
The last step is necessary since StFgtMuDSTMaker is not yet in devel.
Make sure you are in the proper STAR version (you want "development") and compile...
> starver dev
> cons
Pick your data
After your libraries installed correctly, pick a daq file for your FGT studies... (If you're using MuDST files this will be different..)
> ls /star/data03/daq/2012/xxx/13xxxyyy
where 13xxxyyy is the run number you want. (If the run number you want isn't there, restore the daq files yourself or ask somebody to do it.)
Before running over data, make sure to run klog to ensure you get a token to communicate with the database..
> klog
>For MuDSTFiles the corresponding #define directive in StFgtPool/StFgtClusterTools/StFgtGeneralBase.h has to be set.
Run over the data
To fill all the plots you want, you'll need to run this command (when sitting in mydir)...
> cd mydir
> root4star -b -q StRoot/StFgtPool/StFgtClusterTools/macros/agvEffs.C'("/star/data03/daq/2012/131/13173068p_rf/st_physics_13173068_raw_202001.root",10,10000,2)' > & output.txt
The above command will attempt to run over 10,000 events from the example daq file, using disc 2 as the disc that is removed for efficiency calculations. Piping the output to file is necessary in order to cut down on running time. On average, 10,000 events takes ~45 minutes as long as you use an output file.
Look at the plots
The agvEffs.C macro will output some .root files...
-clusterEff.root
-clusterPics.root contains visual "pictures" of the first 1000 clusters found in the daq file.
-pulses.root counts pulses in the electronics etc
-signalShapes.root contains a whole heck of a lot of plots... To see exactly all that is put into signalShapes.root, take a look at StFgtClusterTools/StFgtGenAVEMaker.cxx
There are some friendly macros to help you pull out the plots you want in an organized way. Run these guys to output a whole ton of .png files. A few examples are...
> root4star -b -q StRoot/StFgtPool/StFgtClusterTools/macros/saveSignalChar.C'("signalShapes.root")' //this will output histograms per quadrant
> root4star -b -q StRoot/StFgtPool/StFgtClusterTools/macros/saveSignalCharAPV.C'("signalShapes.root")' //this will output histograms per APV
> root4star -b -q StRoot/StFgtPool/StFgtClusterTools/macros/saveClusterSizes.C'("signalShapes.root")' //this will output cluster size histograms per quadrant
For now it's been most convenient to just dump the .png files into your protected directory but hopefully something a little more elegant is on its way very soon...
Streamlining the process
Right now we have a shell script that pulls daq files name from a list and then runs over them one after the other, dumping the output .root files into a directory. Look around for things like "runChain.sh" and "l13173068.list" if you want to have a go at that.
> ./runChain.sh > & output.txt
Coming soon: pre-written xml job for STAR scheduler.
Available data sets
Most recent runs are located in http://www.star.bnl.gov/protected/spin/ezarndt/fgt/
Coming soon: plots better organized into a scroll-friendly format.
Online Software
The online software uses the 'JPlot' framework:
> cvs co OnlTools/Jevp
> cvs co OnlTools/PDFUtil
> cvs co StRoot/RTS
> cvs co StRoot/StDaqLib
>cvs co StRoot/StEvent
The framework currently only compiles correctly with the 'pro' library version:
> starver pro
> cons
To run do:
> OnlTools/Jevp/launch fgtBuilder -file filename -pdf outputfilename.pdf
Jevp instructions can be found in
OnlTools/Jevp/readme.txt
The fgt specific code is in OnlTools/Jevp/StJevpBuilders/fgtBuilder.{h,cxx}
Test Stand
FGTEventDisplay Overview and Instructions
At the moment FGTEventDisplay incorporates much of the code that we've been using to generate plots, and allows the viewing of individual events. It's certainly not perfect (and it will likely be replaced at some point in the near future), but since it contains this functionality, I thought I might give a brief overview of what it can currently do and how to use it.
Here's what it can do:
* Calculate and display pedestals
Currently, pedestals are calculated from the first 1000 events in a file. These pedestals are only calculated the first time a daq file is viewed using the FGTEventDisplay, when the APV range is changed, and when you force the pedestals to be recalculated. Otherwise, it saves the pedestals to a file in the FGTEventDisplay directory.
When the pedestals are displayed, they are displayed as ADC response per channel. Three graphs are shown with error bars, at 1, 2 and 3 sigmas. Many of the algorithms in the code use the three sigma cutoff when accepting an ADC response for use.
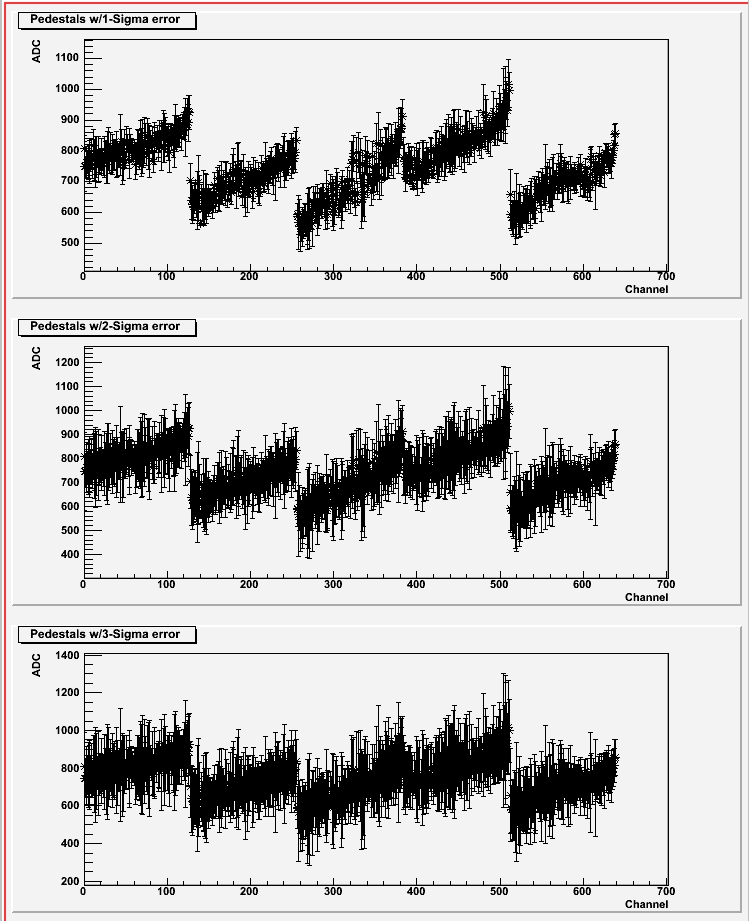
Figure 1: Example pedestal plot
* Generate Radio Hits graphs
The code can generate and save radio hits plots, similar to those that I have been posting to track down the APV mapping problem. The graphs that are generated are just raw 2-D histograms that are then saved to root files. The processing done to improve the appearance of those graphs as well as applying the device boundaries are actually done by a utility macro included with FGTEventDisplay. This macro is called Display.C and is in the same directory as FGTEventDisplay.
Note that all 7 time bins are accumulated by this code separately, and all 7 time bins are saved as separate histograms to the root file.
There are two types of radio hits graphs that are generated. The first plots only the maximum hits. The algorithm finds the maximum value for each event that is above the pedestal 3*sigma and then fills that location in the histogram/radio plot. The second algorithm finds all values that exceed 3*sigma above pedestal and then fills those locations in the histogram/radio plot. These two types of graphs are saved in separate root files.
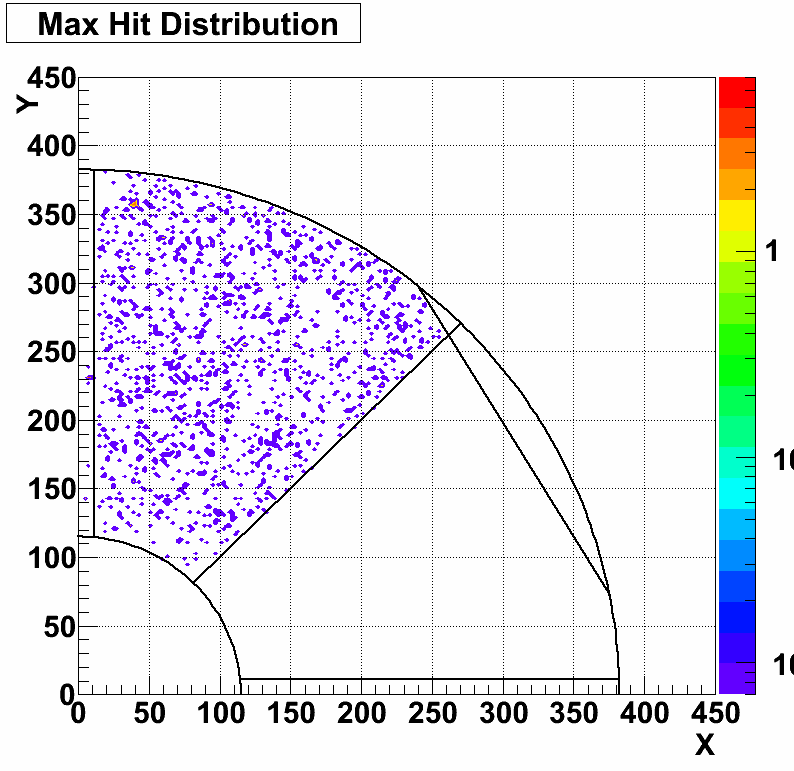
Figure 2: Example max hits plot
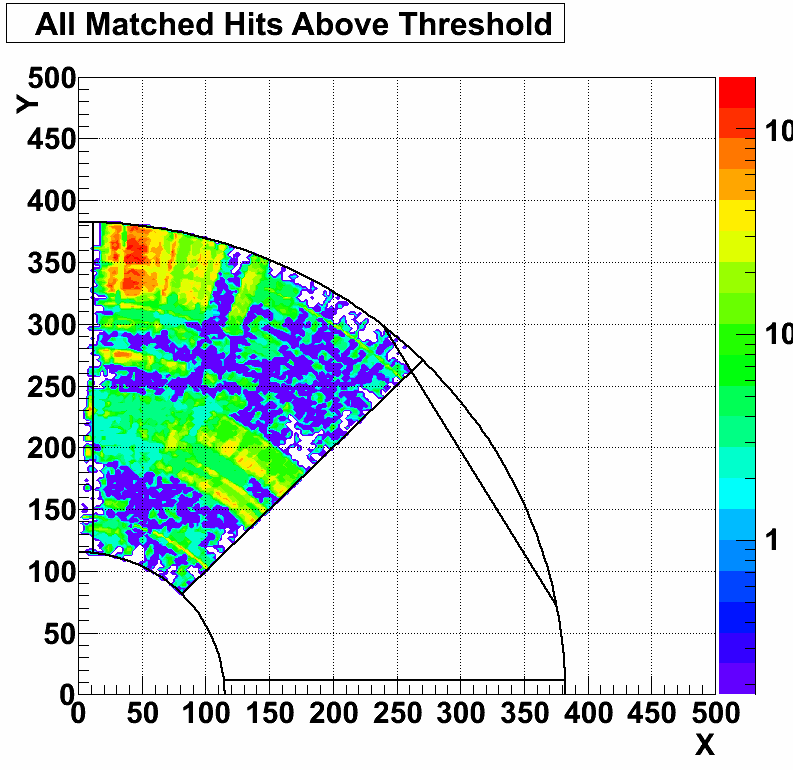
Figure 3: Example all r/phi matches plot
* Generate ADC Response graphs
This code generates and saves per-phi, per-r, and per-channel ADC response plots. Once again, these are just 2-D histograms that are then saved to a root file, and processing to improve the appearance of these plots was done in Display.C. The algorithm selects all ADC responses greater than 3-sigma over pedestal for each event. The channel number in this case is the APV number (offset so that all APV ranges start at 0) times 128 plus the actual channel number. Phi and R values are determined based on the mapping that is included with the FGTEventDisplay (this is located in fgt_mapping.txt). Once again, note that all 7 time bins are accumulated by this code separately, and all 7 time bins are saved as separate histograms to the root file.
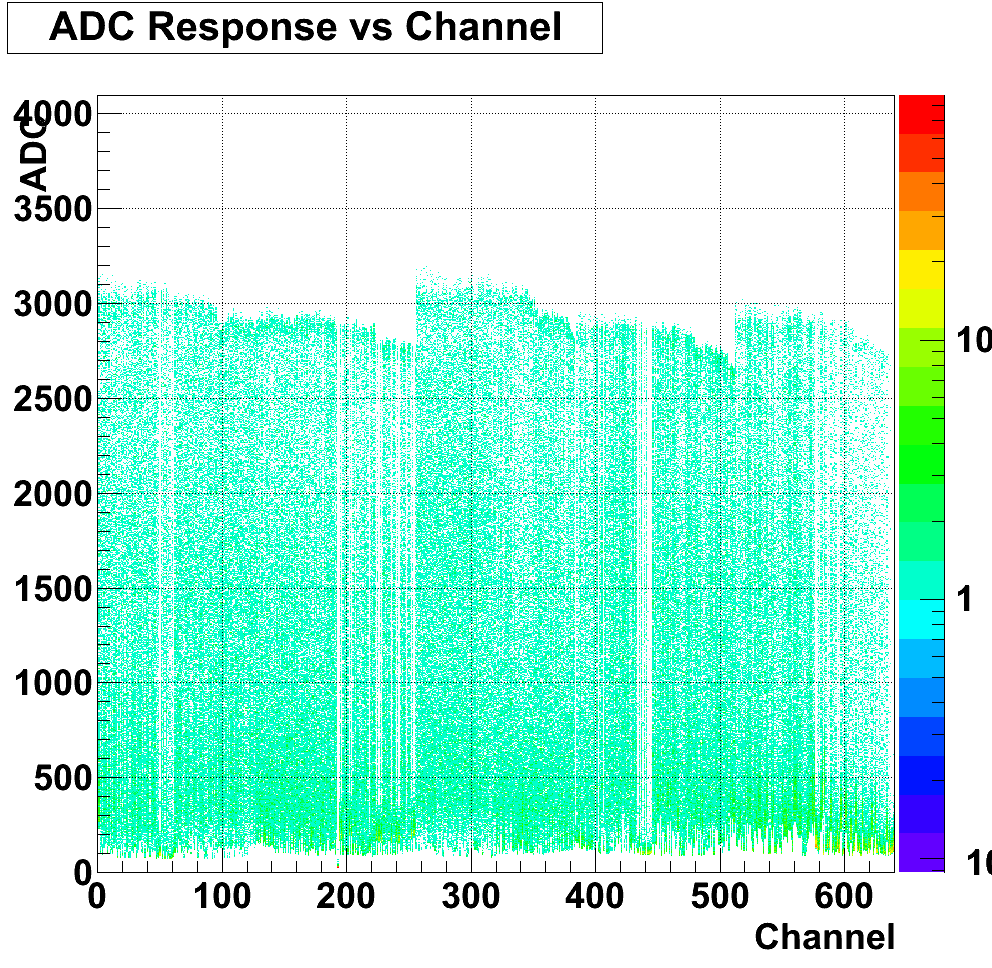
Figure 4: Example ADC response vs channel plot
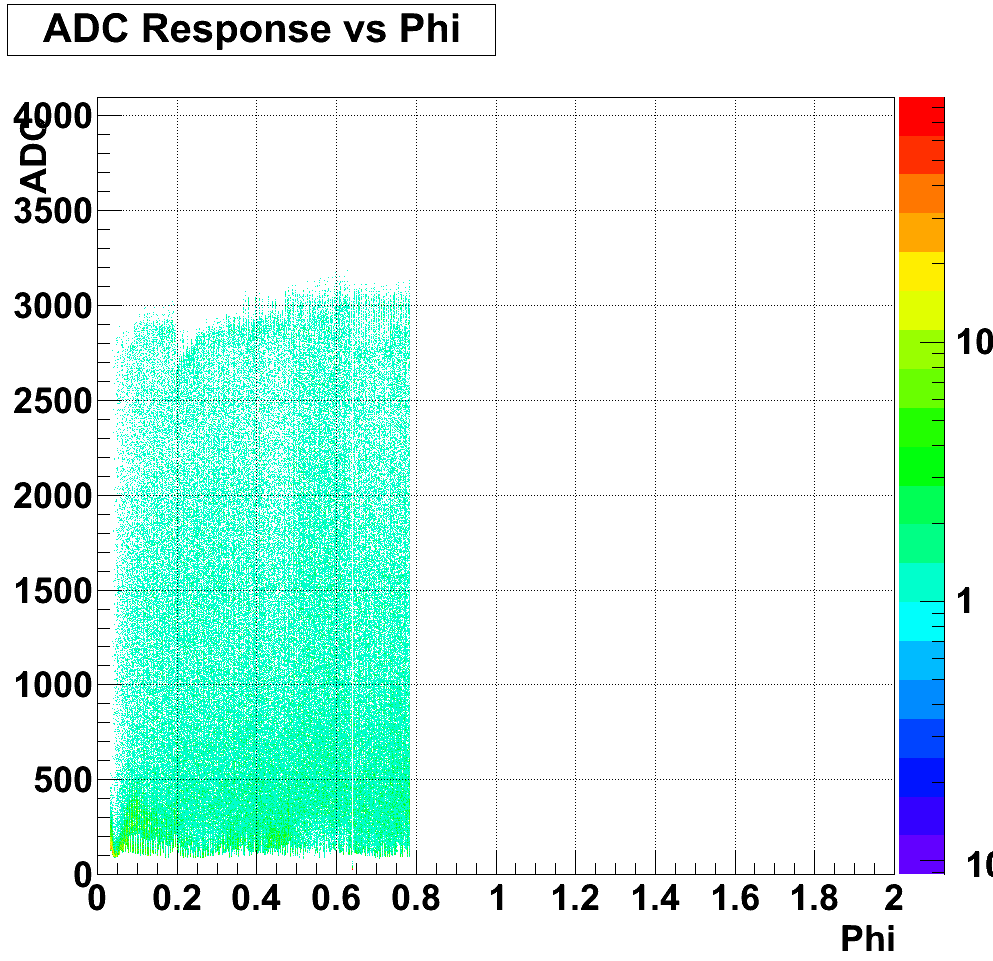
Figure 5: Example ADC response vs phi plot
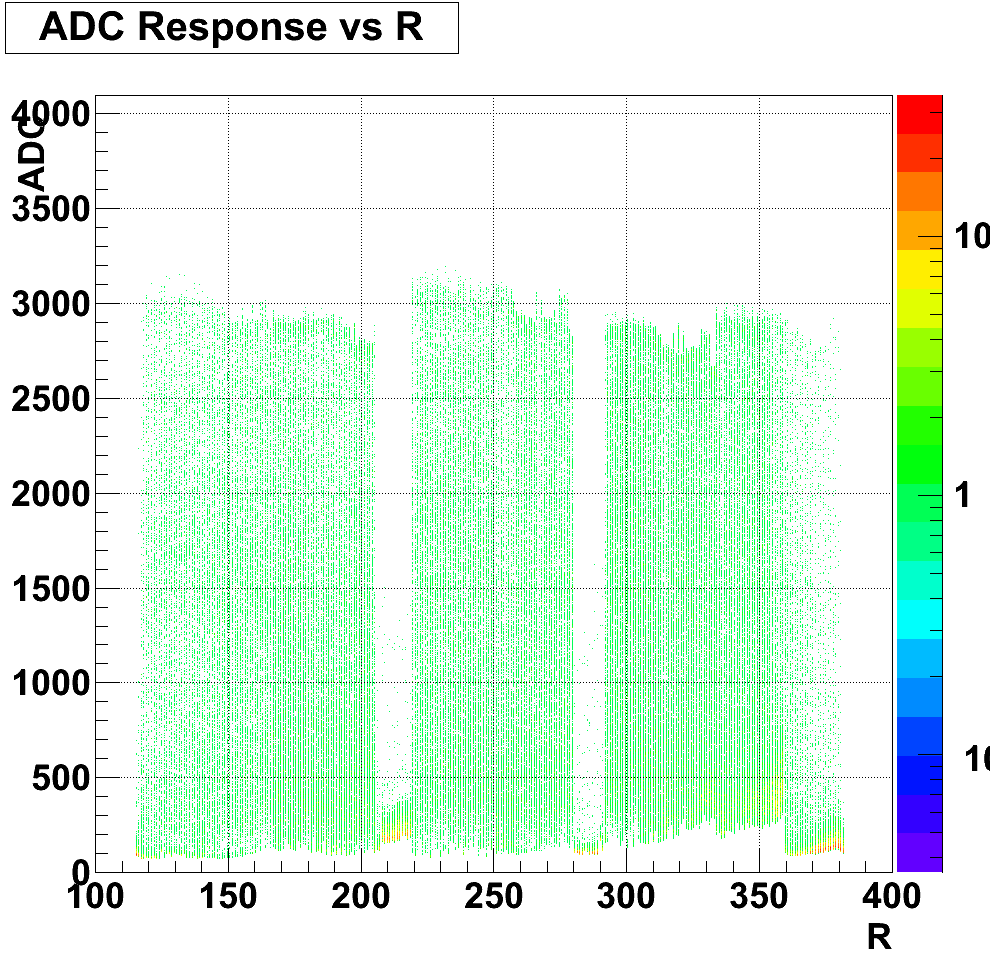
Figure 6: Example ADC response vs r plot
* Generate Raw ADC Response graphs
This code generates and saves per-phi, per-r, and per-channel ADC response plots, very similar to the above, but it does not apply pedestal subtraction or thresholds. The channel number is still the APV number (offset so that all APV ranges start at 0) times 128 plus the actual channel number. Phi and R values are determined based on the mapping that is included with the FGTEventDisplay (this is located in fgt_mapping.txt). Once again, note that all 7 time bins are accumulated by this code separately, and all 7 time bins are saved as separate histograms to the root file.
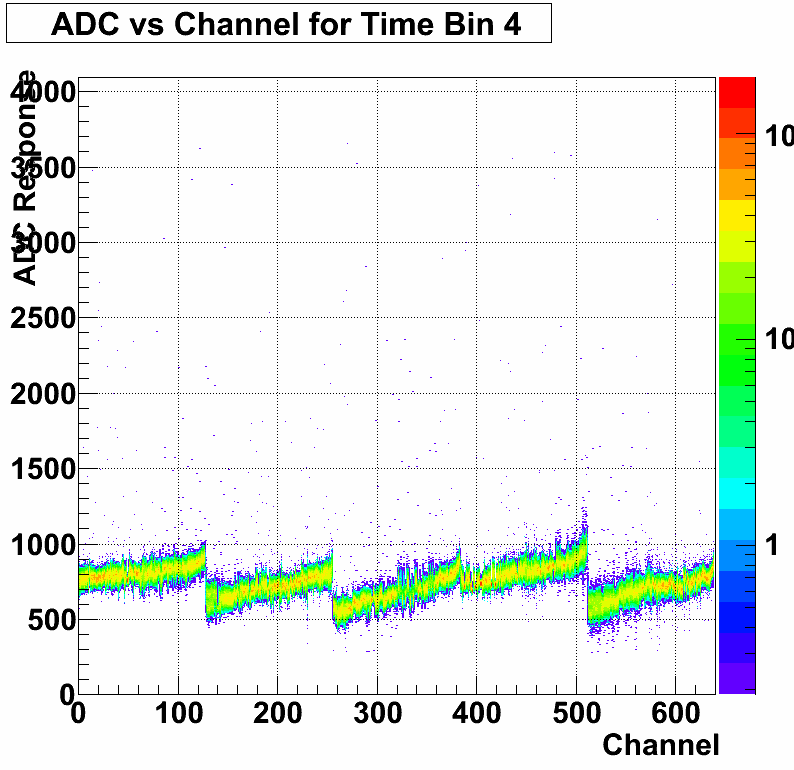
Figure 7: Example raw ADC response vs channel plot
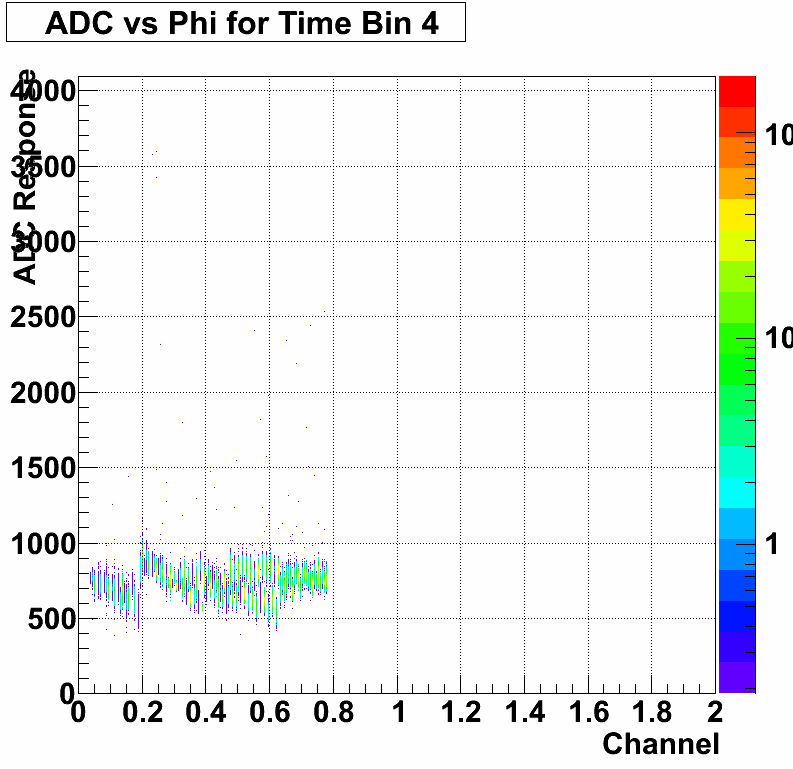
Figure 8: Example raw ADC response vs phi plot
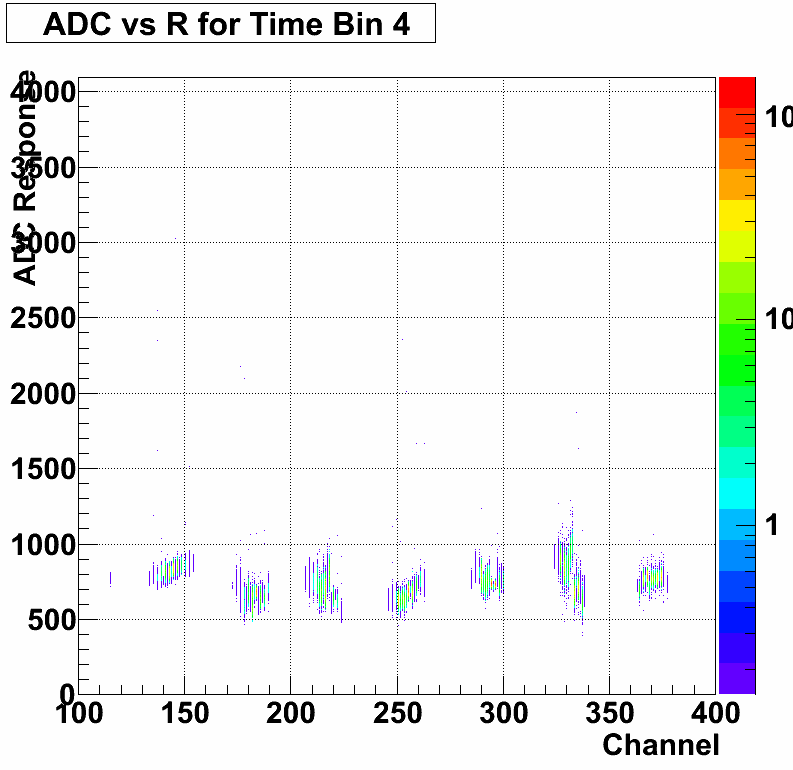
Figure 9: Example raw ADC response vs r plot
* Display individual events
FGTEventDisplay allows you to iterate both forward and (slowly) backwards through individual events in a daq file, as well as jump (slowly) to individual events. For each event, at least three graphs are shown, possibly four. The three that are always shown are ADC response versus R, ADC response versus Phi, and ADC response versus channel (using the same channel calculation method and mapping as described earlier).
The fourth graph will only display if the values for the current event are found that exceed 3*sigma over pedestal. It shows all possible hit locations in R and Phi for these values. Currently this is not a radio plot, but this may change in the future for clarity.
The time bin selected for display here is always the fourth time bin.
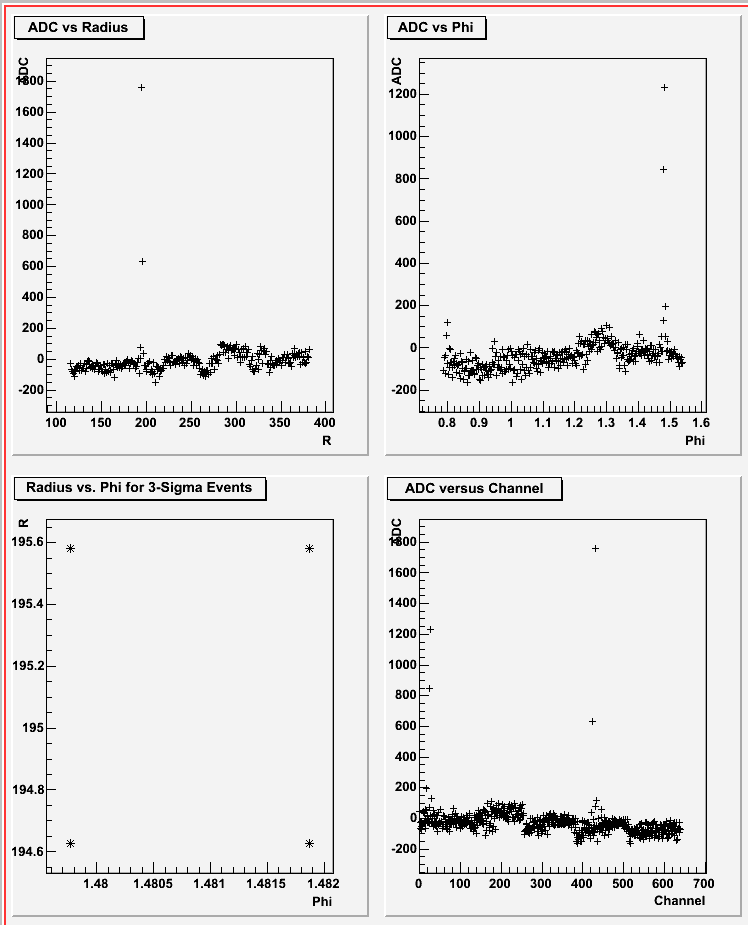
Figure 10: Example default event display plot
Anselm's clustering code is currently in a developmental version of FGTEventDisplay. We are working on incorporating a correction for common mode noise, relative R/Phi gains, and gain matching into this clustering code.
Here are instructions for downloading, compiling, and using FGTEventDisplay:
To download:
FGTEventDisplay is currently stored in a googlecode SVN repository. In order to use this repository, you have to set up your svn proxy properly so that you can contact the googlecode.com (this has already been done on fgt-ops). Probably the easiest way to do this is to attempt to download the code first by issuing the command:
svn co https://fgt-daq-reader.googlecode.com/svn/trunk/FGTEventDisplay FGTEventDisplay
This will almost certainly fail, but it should create the file ~/.subversion/servers. You will need to edit that file and by adding the following two lines to the end of the file:
http-proxy-host=proxy.sec.bnl.local
http-proxy-port=3128
Once that is done, try issuing the command again. This time it should work (let me know if it doesn't), and it should create a directory FGTEventDisplay containing all the program files. From then on you can just update that working copy to get updates by issuing the command
svn update
in the FGTEventDisplay directory. This should automatically merge changes into your files, without clobbering your own changes, although if there are conflicts you may have trouble.
If you want or need access to this repository, please send e-mail to Dr. Fatemi and let her know. At that point she'll probably ask me to add you, and I'll try and remember how to do that.
To compile:
Go into your FGTEventDisplay directory and issue the command:
make
Compilation stuff should happen, and you should be left with an FGTEventDisplay executable.
Please note that you should NOT use Rts_Example.sh to compile. I can't guarantee that it will work, and it is included in the repository only for historical reasons (because, historically, we've been too lazy to remove it).
To run:
Go into your FGTEventDisplay directory (this is IMPORTANT. . . the code will not run from another directory) and issue the command:
./FGTEventDisplay <location of DAQ file>
Replacing <location of DAQ file> with the actual path to a DAQ file.
This will start the program. The code will either automatically generate or load pedestals, depending on whether or not they have already been calculated by some previous run.
Then the program will show the main text menu. The menu lists most of your options, and most of them should be pretty straight forward.
However, there are a few things that should be mentioned. First, by default, the code will assume that you are using the APV range 17 through 21. If you are using a different range, you need to set that difference in the program options, and currently the software only supports ranges 17 through 21 and 12 through 16. To get to options, just type "o" at the main menu. Once there, type "a" to change the APV range. then press "q" to return to the main menu. Doing this will now AUTOMATICALLY force pedestal recalculation, so at this point you should be able to use the code normally.
Also, in options you can tell the program to display bar graphs when displaying events (instead of scatter plots), and change the marker style in the scatter plots. These ONLY effect the event display.
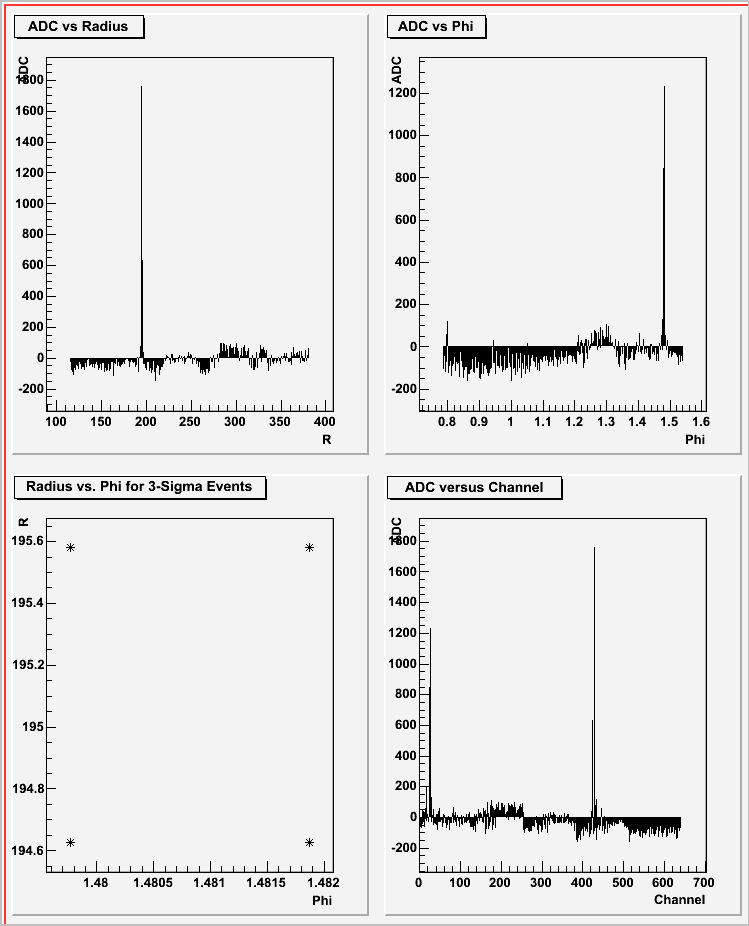
Figure 11: Example default event display with bars
The event display plots do not currently allow any user interaction. This is unfortunate, and I'm planning on fixing it in the future, but right now nearly all x-windows events are ignored by that window, so resizing and clicking and even moving it off screen (for some window managers) will not work as expected.
The daq reader does not have a mechanism for iterating backwards, or a mechanism for jumping to an arbitrary event. As such, iterating backwards (using "h" or "k") may be very, very slow, as the program has to iterate forwards from the beginning of the daq file to the previous event. Similarly, though I have tried to make it as efficient as possible, jumping to an event may be very slow (although, jumping to an event *forward* of your current position in the file will start from your current position, so it should be more efficient).
When jumping to an event directly, you should use the event number that is displayed by the program in the main menu as you are iterating through the daq file. That event number should appear right above the command prompt.
Finally, many of the plots above are colorful and contoured. These are not the raw images that the FGTEventDisplay will produce. With the exception of the individual event display and the pedestal display, FGTEventDisplay will produce root files containing histograms. Generating the plot for these histograms must be done separately. A macro, Display.C, is included with FGTEventDisplay that can be used to generate these nice, colorful plots, however it currently requires modification to function with every possible root file and contained histogram.