Slow Controls
STAR Slow Control description and operations
Archive Viewer
In general, all archives are available on the starp.bnl.gov network only.
There are several options available.
1) web interface
2) java client
Manual is available at: http://ics-web1.sns.ornl.gov/archive/viewer/files/manual.pdf 3) command line
If you are trying to get to the archive viewer remotely, try web interface first and if you can not get all features you are looking for than try Java client.
If you are in the CR, try Java client first, it has a lot of nice features.
Below you can find a brief description of how to use different viewers, for more details please see the manuals.
if you have any comments or suggestions, please send them to me. Yury Gorbunov
WEB INTERFACE

Fig. 1 Point your browser to http://sc.starp.bnl.gov:8080/archiveviewer/
Specify the location of the cgi script in the text field on the appeared web page: http://sc.starp.bnl.gov/archive/cgi/ArchiveDataServer.cgi.
Push "Connect" button to establish the connection to the server.
In a few seconds you should see a screen similar to what is shown in Fig 2.

Fig. 2 In the left menu pick the "CURRENT_ARCHIVE" and in the "search string" text field specify the name of the PV (in the current example I'm looking for vme59 related PVs).
Push "Search" button to search through the archive. In a few seconds you will be redirected to something similar to what is shown in Fig 3.

Fig. 3 Pick PVs you'd like to see on a plot. (in the example I picked temperature of the crate 59).
Click radio button "Configure for Plot". Push "Go" button to get to the next page. In a few seconds you will be redirected to a page similar to what is shown in Fig 4.

Fig. 4 Here you can specify time range, titles and range for "y" axis. In the example I'm plotting temperature for the last 24 hours by specifying "-1d" as a starting date and "now" as a final date. Push "Submit" button to get a plot. In a few seconds you will be redirected to a page similar to what is shown in Fig 5.

Fig. 5 Final plot, in the png format - ready to be printed!
JAVA CLIENT

Fig. 1 To start the client type
login into sc.starp.bnl.gov
type: ArchiveViewer &

Fig. 2 Go to "File" then to "New Connection" and specify the location of the cgi script as it shown in Figure 2. Push "Ok" button.

Fig. 3 In the menu located in the left top corner select "CURRENT_ARCHIVE" and press "search" button.

Fig. 4 In the search window: type in the search pattern and select "Glob Pattern" radio button. Press "Go" button.
From the list of found channels pick (highlight) channel(s) you are looking for and push "Add" and then "Ok" buttons.
The search screen will disappear

Fig. 5 In the right top corner specify time range and push "Plot" button. In a few seconds you will see something similar to Figure 6.

Fig. 6 Final plot , in the png format - ready to be printed!
COMMAND LINE
heck this manual (page 43), which is talking about perl script:
http://ics-web.sns.ornl.gov/kasemir/archiver/manual.pdf
For example list all channels for current archive ArchiveDataClient.pl
-u http://localhost/archive/cgi/ArchiveDataServer.cgi -k 1 -l
...
Channel tpchv:SUB_RD_TC_1_8.H, 01/03/2006 11:29:58.390279188 -
01/08/2008 02:04:57.788410644
Channel tpchv:SUB_RD_TC_1_8.I, 01/03/2006 11:29:58.390279188 -
01/08/2008 02:04:57.788410644
Channel tpchv:SUB_RD_TC_1_8.J, 01/03/2006 11:29:58.390279188 -
01/08/2008 02:04:57.788410644
Channel tpchv:SUB_RD_TC_1_8.K, 01/03/2006 11:29:58.390279188 -
01/08/2008 02:04:57.788410644
..
and then you pick the channel from the list and time period and print
the values recorded in the specified time interval
, also you can access help by
ArchiveDataClient.pl -h
USAGE: ArchiveDataClient.pl [options] { channel names }
Options:
-v : Be verbose
-u URL : Set the URL of the DataServer
-i : Show server info
-a : List archives (name, key, path)
-k key : Specify archive key.
-l : List channels
-m pattern : ... that match a patten
-h how : 'how' number; retrieval method
-s time : Start time MM/DD/YYYY HH:MM:SS.NNNNNNNNN
-e time : End time MM/DD/YYYY HH:MM:SS.NNNNNNNNN
-c count : Count
How to get PV name and alarm limits

If you would like to find the PV name of the DB record displayed in the GUI or in the alarm handler.
The easiest way is to do it with the help of the GUI with displayed corresponding PV.
1) open the GUI
2) right mouse click somewhere on the GUI
a) a small white dot with "PV" letter next to it will appear
3) navigate the white dot to the corresponding displayed PV (displayed PV is shown in the white circle) and click left mouse button
A screen similar to the shown below will appear with PV name displayed
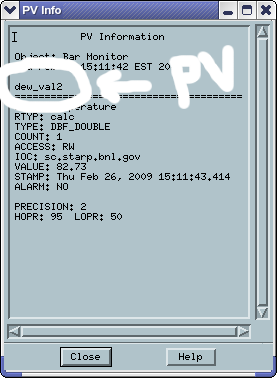
4) copy the pv name (shown in the white circle
5) open session on one of the slow controls PCs (sc,sc5,sc3)
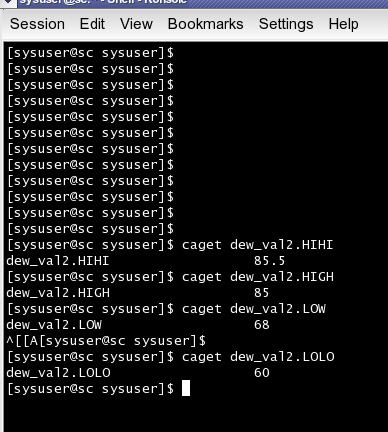
6) type :
caget pv_name.LOW - for low yellow alarm state
caget pv_name.LOLO - for low red alarm state
caget pv_name.HIGH - for high yellow alarm state
caget pv_name.HIHI - for high red alarm state
you should get something similar to what is shown in the screen shot below
here is a small script which will read alarm limits for a channel . Just save into a file and do "a +x <filename> ". It will work on sc.starp.bnl.gov and sc5.starp.bnl.gov
#!/bin/bash
echo Please, enter channel name
read NAME
echo "Channel name is : $NAME!"
echo "current value :"
caget $NAME
echo "LOW (yellow alarm) :"
caget $NAME.LOW
echo "LOLO (red alarm) :"
caget $NAME.LOW
echo "HIGH (yellow alarm) :"
caget $NAME.HIGH
echo "HIHI (red alarm) :"
caget $NAME.HIHI
How to operate HV of pp2pp system
1) log into one of the Slow Controls computer (sc.starp.bnl.gov or sc5.starp.bnl.gov) under sysuser (the password is in the red folder in control room)
a) Don't forget X forwarding
2) type: pp2pp and hit enter a gui will appear on the screen as shown below
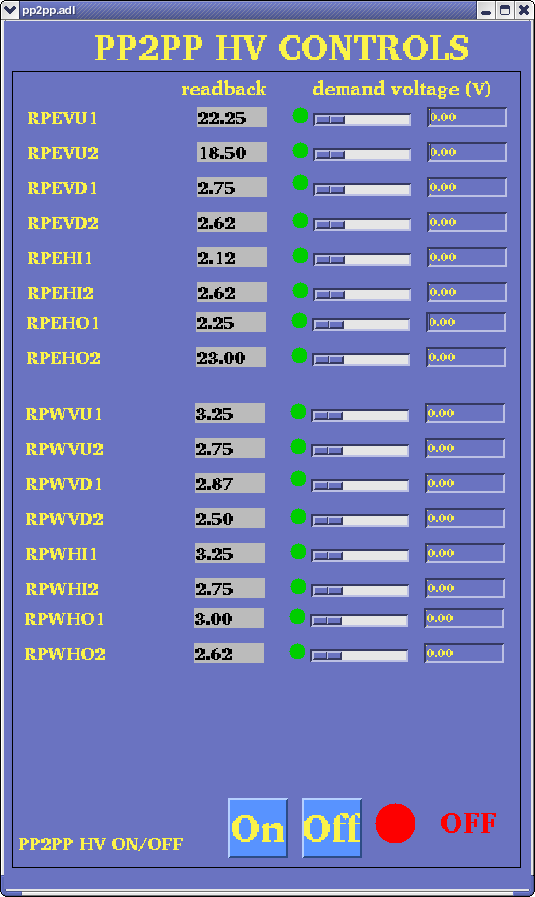
3)push "on" to powerup the system or "off" to switch it off
4) the config file can be found on sc5.starp.bnl.gov at
/home/sysuser/oldepics/appDir/BBC/SAVE/PPHV.save
the first line of the txt file corresponds to RPEVU1 , second line to RPEVU2, etc
Goodluck
Slow Controls Operations Manual
STAR
Slow Controls Operations Manual
Creighton University
version 7.0
Dec 02, 2007
This manual is supplemented by the figures in the
STAR Slow Controls Training presentation.
Slow Controls Operations Manual
Telephone Numbers *
Line Commands *
Slow Controls Architecture *
Hardware Controls Workstations 6
Color Coding of Data 6
The Alarm Handler 7
Starting and Running the Alarm Handler 9
Viewing Archived Data 12
Accessing Front End Processors 13
Special VME, DAQ, Trigger and Magnet Commands 13
Telephone Numbers (Nov 12, 2007)
Slow Controls at STAR (631) 344-8242
BNL apartment 22B (631) 344-1043
at Creighton (402) 280-2208
Michael Cherney
cell phone (will ring at BNL) (402) 305-0238
at Creighton (402) 280-3039
Line Commands
Open a terminal on sc3.starp and get
[sc3.starp.bnl.gov]:~>
From sc3.starp.bnl.gov there are many alias commands for bringing
up medm screens (guis) and launching tools.
The most important one to be able to do as a shift crew member is to start the
Alarm handler (sometimes called alh or ALH)
startalh & -- starts the Alarm Handler
Note: using the P button you can access almost every subsystem medm screen from the Alarm Handler
Other usefull aliases that can be used from sc3.starp. All give the same screens as those available from
the Alarm Handler.
vme_plat1 --- vme power supplies for the first floor of platform
vme_plat2 --- vme power supplies for the 2nd floor of platform
eemc_canbus --- vme power supplies for the EEMC
emc_canbus --- vme power supplies for the EMC
zdc --- ZDC HV controls
upVPD --- upVPD HV controls
bbchv --- BBC HV controls
richscal --- rich scalars
tpctop --- gets the tpc top level user interface
trighv --- starts the trigger high voltage control program
and many others see .user_aliases on sc3.starp and/or sc.starp
The second most important command you can do from the terminal is
to open a serial connection to a IOC processor by opening a telnet session.
Note : This can be done from any terminal session on a starp network computer.
There can only be one session open.
If a session is open the command will fail!
telnet scserv xxxx
connects to the serial port of the front end processor connected to
port xxxx of the terminal server on the platform.
A list of processors and port numbers is posted to the left of sc3.starp
Archived data may be viewed at the web site: http://sc3.starp.bnl.gov/archive
Front End Processors (located on the platform or in the DAQ room) carry out all of the control and monitoring functions. Sun Workstations display the data (processes on the workstations listen for broadcasts of parameter values and broadcast user requests to the front end processors over Ethernet).
The STAR Hardware Controls system sets, monitors and controls all subsystems. In addition, Hardware Controls can generate and display alarms and warnings for each subsystem. A real-time VxWorks environment is utilized for this purpose and a controls software package, EPICS, is used to provide a common interface to all subsystems. The baseline STAR detector consists of time projection chamber subsystems (anode high voltage, cathode field cage, gating grid, front-end electronics power supply, HDLC link, gas, laser, interlocks, and VME-crate control), mechanisms for the exchange of information with the STAR trigger and online, as well as external magnet and accelerator systems. Approximately 16,000 parameters governing experiment operation are currently controlled and monitored. Magnet status and accelerator information is obtained from the accelerator controls database using a Control DEVice (CDEV) client/server interface. The set of databases for detector configuration is maintained by Hardware Controls. STAR Hardware Controls maintains the system-wide control of the STAR detector with its EPICS databases at the subsystem level. Databases are constructed on the subsystem level, such that they can be used for subsystem testing and remain easily included in a larger detector configuration. An HDLC link provides the field bus used by the experiment for controls and an alternate data path.
STAR hardware is required to be designed failsafe. All required personnel and property protection is mandated to be independent of STAR Hardware Controls. This does not mean that you cannot cause damage to the detector using the slow controls interface. If you are in doubt about an action contact an expert.
EPICS was selected as the foundation for the STAR control software environment because it incorporates a standard means of sharing information and services, graphical display and control interfaces, and a robust, real-time operating system. At STAR, EPICS is run on Sun workstations connected to VME processors running the VxWorks operating system. The components of EPICS used at STAR are the Motif Editor and Display Manager (MEDM), the Graphics Database Configuration Tool (GDCT), the sequencer, the alarm handler, and the data archiver.
EPICS is a set of software tools and applications jointly developed by Argonne National Laboratory and Los Alamos National Laboratory for the purpose of controlling Particle Accelerators and Large Experiments. Present and future development is being done cooperatively by Argonne (ANL), Los Alamos National Laboratory (LANL), Lawrence Berkeley Laboratory (LBL), the Jefferson National Laboratory (CEBAF), the Spallation Neutron Source Collaboration , BESSY (Berliner Elektronenspeicherring-Gesellschaft für Synchrotronstrahlung m.b.H.) and DESY (Deutsches Elektronen-Synchrotron).
EPICS provides: interfaces to instrumentation from data acquisition, supervisory control and steady-state control through a table entry database, an operator interface to all control system parameters through interactive displays, data logging through a table entry archiving file, alarm management through a table entry alarm file, sequential control through a state definition language with convenient database interface routines, channel access routines for interfacing the control system data to data analysis, and other functions not provided in the control system. The basic components needed are the Operator Interface (OPI), Input Output Controller (IOC), and a Local Area Network, which allows the OPI and IOC to communicate.
Hardware Controls Workstations
Slow Controls workstations are located to the left of the Level 3 Workstation. The main controls workstation (sc3.starp.bnl.gov) and a second workstation (sc4.starp.bnl.gov) are positioned next to each other with sc4 to the right of sc3. The system should be running on sc3. Access from other computers is controlled. (Telnet is possible from sc4 and certain online computers.) The current username and password for shift operators are posted on the sc3.star.bnl.gov monitor. These may be updated. Please check each time you are on shift and do not use old login names and passwords.
Shutting down the workstation or restarting the workstation should have no effect on the front end processors. The user interface is independent of the front end controllers. Instructions for accessing these processors are included later in this document.
Green entries identify data which is believed to be correct and within bounds
Yellow indicates entries that are slightly outside of bounds. Corrective action should be taken or logbook entries should be made.
Red tags data that is beyond normal operating limits. Corrective action should be taken or an expert should be contacted. A logbook entry should be made.
White entries indicate channels where data is missing or where the validity is suspect. An expert should be contacted. A logbook entry should be made.
The Alarm Handler is used to identify alarms, study the symptoms, and contact an expert. It is an interactive graphical application used primarily to display and monitor EPICS database alarm states. It serves as an interface between an operator and the EPICS database and it communicates with the database using the same mechanism (channel access) as the controls screens. The user interface for the Alarm Handler contains a hierarchical display of an alarm configuration structure allowing both high level and detailed views of the alarm configuration structure in one window.
Purpose of the Alarm Handler
The Alarm Handler monitors alarm conditions of EPICS database records. The primary responsibilities of the Alarm Handler are to: bring alarms to the operator's attention, provide the operator guidance for handling of specific alarms, allow the operator to globally acknowledge alarms, provide a graphical view of current database alarms, and provide for logging alarms and display of the logged alarm history.
Alarm Handler Terminology
An alarm is an unexpected change of state for an EPICS database parameter. Examples of alarm conditions are: deviations from tolerance band, software or hardware errors, and loss of communication to hardware or linked parameters
When a change in a parameter is detected, a message is sent to each process monitoring the parameter. The Alarm Handler may be one of these processes.
There are two parts to an alarm: the alarm status and the severity of that alarm status. Alarm status and severity are set and checked whenever a parameter is processed. The alarm severity can take one of the following four values: no alarm, minor alarm, major alarm, or invalid data alarm. A correspondence between these alarm severities and the alarm state are preprogrammed in the EPICS database. The relationship is loaded when the front end processor is booted. The EPICS database specifies the alarm state of the each parameter. The state is defined on the basis of the value of the parameter (being within certain bounds) and on the proper completion of data collection and processing cycles.
The Alarm Handler displays alarms for an arbitrary set of channels. Each Alarm Channel refers to a specific EPICS database parameter. The Alarm Handler provides a grouping mechanism so that related channels can be grouped together. An Alarm Group consists of a named set of lower-level groups and/or parameters. An Alarm Channel will be considered in an error state if there is a loss of communication or communication error between the Alarm Handler and front end processor.
Alarm Handler Windows
The Alarm Handler display consists of two types of windows, a Runtime Window and a Main Window. While the Alarm Handler is executing, the Runtime Window is always displayed.
The Runtime Window is a small icon-like window that contains a single button containing the name of the alarm configuration main Alarm Group. The color of this button is used to show the highest alarm severity of any outstanding alarms.
White: Data Invalid Alarm
Red: Major Alarm
Yellow: Minor Alarm
Background color: No Alarm
Beeping and blinking of the button is used to show the presence of unacknowledged alarms. Pressing the Runtime Window button will open the Alarm Handler Main Window or, if already open, bring the MainWindow to the top of the window stack. The Close or Quit item on the window manager menu allows the user to exit the Alarm Handler.
The Alarm Handler Main Window is divided into three parts: a menu bar, an alarm configuration display area, and a message area. On the menu bar, there are selections for pull-down menu items that perform all the functions of the Alarm Handler. The alarm configuration display area is divided into two major parts: an alarm configuration tree structure display and an Alarm Group content display. The current alarm configuration tree structure appears in the first area, and a list of the contents of the currently selected Alarm Group from the alarm configuration tree structure appears in the second area. Color is used to show alarm severity. A single character severity code is also provided to assist operators who may have difficulty distinguishing colors. The message area can show the current execution mode, the current execution state, and the name of the current configuration file. It also contains buttons to silence alarms, and explanatory descriptions of the alarm configuration summary abbreviation codes and status data which appear in the group summary and channel status lines.
Starting and Running the Alarm Handler
Invoke the Alarm Handler by executing the command: startalh
The alarm handler should be operated at the left controls workstation (sc3). The Runtime Window appears. There will be beeping and the button will blink to indicate the presence of unacknowledged alarms.
Some users prefer using tpctop, a generic user interface. Normally the monitoring functions found in tpctop are carried out at the subsystem workstations and you will not need to make any changes from this screen. The same control screens available in tpctop are in general accessible from the Alarm Handler.
To get a top level control screen, at the UNIX shell prompt type: tpctop
Click on the small square next to the name of the subsystem that you want to examine.
From this screen you can make changes to the subsystems even if there is another similar interface open at the subsystem.
Click on the Runtime Window to bring up the Main Window.
You can then relocate the Runtime Window.
Click in a box in the lower right corner of the Main Window to silence beeping.
Silence Forever will stop the beeping forever. Silence Current will stop the beeping until you get another alarm. Silence Current is probably the sensible choice if you are watching the screen. Alarms will continue to be updated on the display regardless of your selection. Be sure Silence Forever is not clicked when you stop watching the screen.
To acknowledge an alarm, click on the left-most box.
To get the name of the expert responsible for this subsystem,
Click on "G" for Guidance.
To see the control screen for this subsystem, click on "P" for Process.
There are two ways to see which channels are involved in a Group.
Clicking on the Group name lists the channels in the frame on the right.
Clicking on the right-pointing triangle lists the channels in the left frame in a tree.
To collapse the tree back to the original view, click the triangle again.
You may want to leave this window open at all times when the experiment is running.
To Exit, click on "Close" on either the file menu on the menu bar or on the Runtime Window. This will bring up the Alarm Handler Exit dialog window.
Make sure you kill any icons that are no longer in use when you exit.
Enabling and Disabling Alarm Systems
Individual subsystem may be partially or total disabled using the control screen obtained by clicking on the process button of the DISABLE-ALARMS subsystem.
Alarm Handler Tree Structure
The alarm handler configures the display of parameters into a tree structure. The detector is divided into groups (subsystems) which are divided into subgroups that are made up of individual parameters. Branches of the tree (alarm groups) are displayed as separate Group Summary Lines. Buttons on the tree structure display allow the user to expand or deflate the alarm display.
This display line summarizes the status of all alarms for the group (normally a detector subsystem or part of a subsystem) named in this line and all lower level groups (smaller divisions of the subsystem or individual channels). The group summary display consists of the following items:
Acknowledgment Button
The button is activated only if an unacknowledged alarm is present for the group and the alarm handler is active. This button is color-coded and labeled with a corresponding letter representing the highest severity of unacknowledged alarm as follows:
White: labeled with V indicates an invalid data alarm
Red: labeled with R indicates a major alarm
Yellow: labeled with Y indicates a minor alarm
Background color indicates no alarm present
This button describes the highest severity of unacknowledged alarms for this group and all associated subgroups. Clicking on this button while alarm handler is active will send alarm acknowledgments to all alarm channels associated with the group. It has the same effect as individually acknowledging each subgroup channel in an unacknowledged alarm state.
Single Character Severity Code
This code shows the highest level alarm whether or not the alarm has been acknowledged. (The acknowledge button only identifies the highest level unacknowledged alarm.) A one-character severity display code is present only if at least one channel associated with the group is in alarm or in an error state. It is color-coded and represents the highest severity outstanding alarm following the same coding system as the acknowledge button. The code shows the highest severity current alarm for this group and all its subgroups.
Group Name Selection Button
This button is used to look at the next level down the tree. The alarm handler allows the operator to choose any alarm group or channel which is lower on the tree by clicking on this button. The result is to display one level of the contents associated with the selected subgroup. This subgroup is also becomes the currently selected group (your location in the tree). If this name is associated with a collection of channels, the button has an associated right-pointing triangle so that an operator can distinguish paths to channels (no triangle - end of tree) from paths to subgroups (triangle - additional channels below).
Alarm Configuration Summary
The Alarm Configuration Summary is a five character display. Each character in the display is a "-" or the character identifying special treatment of this alarm from the following list:
C: cancelled - alarms will not be sent to the alarm handler
D: disabled - alarms will be ignored by the alarm handler
A: alarms are not required to be acknowledged
T: transient alarms are not required to be acknowledged
L: alarms are not logged
If the current configuration for any parameter in this group or any subgroup is configured to be handled in special way, the corresponding character is displayed, otherwise the character "-" is displayed. For example, the string "--A--" means that at least one parameter is configured not to require the acknowledgment of alarm and that no parameters have any other special configurations.
Alarm Severity Summary
The alarm severity summary allows the user to assess how widespread a particular alarm is. The display shows the total number of parameters with a particular alarm severity for this group and all its subgroups. This summary consists of a set of four entries: (data alarm, major alarm, minor alarm, no alarm)
Each field value indicates the total number of parameters with the specified severity in the associated group and all its subgroups.
The archived data can be viewed from any web browser. To do this in the control room, open a browser on sc by typing the shell command: Netscape
Go to: http://sc3.starp.bnl.gov/archive. This will work from any computer. (Experts can check from home.) Do not view Netscape from the same workstation where you are running the alarm handler or the control display program (tpctop). (Opening screens in the wrong order will mess up your display. It is easier to keep these programs separate to avoid this conflict.) At the website click on the slow controls archive button. Also at the home page are links to the STAR website and the RHIC website where the icons lead directly into those websites. The slow controls button will lead into the main listing of all the database variables listed in the archive. At the main listing choose the variables of the archive, which is needed. From there it either leads directly into that information or into a subdirectory of more variables. If it goes into a subdirectory, continue to narrow the field down until it leads into a list of the information.
This list of information will contain a list of all the different pieces of data contained in the particular directory and times of when they were first and last archived. First, in the box labeled "Names", take out all the variables that are not needed. Next set the start time and end time of the data that is to be reviewed. From there two options can be performed, a graph and a list of data. To get the graph click the plot button, and to get the list of data click the get button. They can only work for ten or less variables so if more are needed then the graphs or spreadsheets will need to be taken more than once for different variables.
Accessing Front End Processors
In the case where a front end processor has a fault it may need to be examined or rebooted. This should only be done on the advice of an expert. This is accomplished by requesting an independent serial connection to a processor located on the platform obtained by typing: telnet scserv xxxx
at a UNIX prompt where xxxx is the port address obtained from the expert. (tip a typed on sc3.starp will do the same thing for the processor in the DAQ room.) The processor can now be tested using VxWorks commands provided by an expert. If you are told to reboot, typing [control]x should initiate the process. Rebooting does not normally affect the front end electronics. It will not shutdown the system. The system can only be shutdown by taking appropriate action on the individual control screens.
and Magnet Commands
VME crates should not be turned on and off except at the advice of an expert. A better option may be to reset the VME bus. This can be done from the controls display. These processes can be carried out remotely for crates on the platform and in the DAQ room using the alarm handler. To obtain a controls screen, click on the program button (P) after the group name of the VME crates (PLATFORM-VME for the platform, or DAQ-VME for the DAQ room). The control program for the VME status for crates in the DAQ room can also be obtained by typing: daq_crate at the UNIX shell prompt. The crate control program for VME crates on the platform can also be accessed by selecting the VME option using tpctop.
The trigger high voltage control program can be accessed by typing: trighv at the UNIX shell prompt.
To restart the link to RHIC and STAR magnet data, type the command: cdev at the Unix shell prompt to get to the correct directory, followed by the commands:
source new.cshrc and MagnetData at the Unix shell prompt.
# Description Port# Crate Location Processor IP address
________________________________________________________________________________
1. CANbus (STAR)
1st 2nd Floor 9003 51 2A9 grant.starp 130.199.61.103
2. CANbus (BARREL)
Barrel crates 9040 100 2C4-1 bemccan.starp 130.199.60.59
3. CANbus (EEMC)
EEMC/QT/West PT 9020 99 2C4-1 vtpc1.starp 130.199.60.189
4. Field Cage 9001 56 2A4 vtpc4.starp 130.199.60.192
5. Gated Grid 9002 54 2A6 vtpc3.starp 130.199.60.191
6. TPC FEE 9004 58 2B5 vtpc2.starp 130.199.60.190
7. Cathode HV 9005 57 2A3 cath.starp 130.199.60.162
8. Inner Anode HV 9006 52 2A7 vtpc7.starp 130.199.61.78
9. BBC HV 9010 77 1A7-1 bdb.starp 130.199.61.218
ZDCsmd, and upVPD
10. Ground 9011 57 2A3 vsc2.starp 130.199.60.217
Plane Pulser
11. Interlock 9012 52 2A7 epics2.starp 130.199.60.149
TPC Temperature
12. Outer Anode HV 9013 59 2A6 vtpc5.starp 130.199.60.193
13. Platform Hygrometer
TPC Gas 9015 58 2B5 hdlc.starp 130.199.60.161
14. Trigger HV 9021 63 1A6 cdb.strarp 130.199.60.40
ZDChv programs
15. SSD 9026 79 1C6 sdvmesc.starp 130.199.60.120
16. SVT not used svtmonitor.starp 130.199.61.50
17. FTPC 9033 71 1B5-1 ftpc.starp 130.199.61.83
Slow Controls
18. EMC TDC 9039 80 2C4-2 creighton5.starp 130.199.60.229
& Slow Controls
19. daq temp & humidity
& gain DAQ room DC2 burton.starp 130.199.61.104
20. CDEV DAQ room DC3-2 vsc1.starp 130.199.60.188
Scalars and Magnet
21. Autoramp anode DAQroom DC2-1 stargate.starp 130.199.61.48
& cathode & testbits
22. TOF_Gas program DAQroom DC3-3 taylor.starp 130.199.60.6
23. CANbus iowritest DAQroom DC3-1 tutor.starp 130.199.60.46
Program
(needs to be rebooted daily)
24. Daq Hygrometer DAQroom DC3-1 medm.starp 130.199.60.49
& GID (PC in daq room)
TPC Lecroy serial session for inner sectors Port 9037
TPC Lecroy serial session for outer sectors Port 9038
FTPC Lecroy serial session Port 9023
SVT?? Lecroy serial session Port 9034
SMD?? Lecroy serial session Port 9035
REMOTE POWER SUPPLIES---requires a telnet
rps1.starp.bnl.gov 130.199.60.26 2A4
rps2.starp.bnl.gov 130.199.60.205 2A3
rps3.starp.bnl.gov 130.199.60.206 2A6
bemcpower.starp.bnl.gov 130.199.60.54 2C4
eemccanpower.starp.bnl.gov 130.199.60.90 1C2
pmdrps2.trg.bnl.local 172.16.128.208 1A3
Name: scdaqpower.starp.bnl.gov Address: 130.199.60.95
computone servers
scserv.starp.bnl.gov 130.199.60.167
Name: scserv2.starp.bnl.gov Address: 130.199.60.96
scserv:notes
telnet scserv
then type help
There is also a web interface http://scserv.starp.bnl.gov/
Name: scserv2.starp.bnl.gov
Address: 130.199.60.96
username and password not assigned yet
X-Windows Remote Access to BNL with NX
This document based on http://request.nsls.bnl.gov/freenx/
Yury Gorbunov
22 February 2008
Comments? gorbunov[attt]rcf_d_rhic_d_bnl_d_gov
X-Windows Remote Access to BNL with NX
This note is about how to use NX technology to gain remote access with full X-Windows support. Typically, one can use the nxclient to connect to the office/beamline Linux box (nxserver), with full X-Windows functionality (to access the BNL intranet, etc., almost like you are sitting infront of the remote BNL computer). The key advantage of using NX, as compared to others (for example, "ssh -X -C"), is that NX uses very efficient compression to achieve very fast response while using very low bandwidth. In my experience, while connecting to my office Linux box, with a cable modem connection, there is no noticeable delay at all, and the bandwidth usage is about or below 10KB/sec most of the time, while doing web browsing on the remote desktop with Firefox. It's reported one could do this through a modem line.
Like most of the network applications, NX comprises of a Client and a Server. I already set up NX servers for many of the nsls beamline Linux computers. To connect to the nxserver, the only thing you'll need is to download a free (as in beer) client (Linux/Windows/Mac/Solaris) and follow the following procedures to configure it. For outside BNL network (at home), there is a special procedure to configure port-forwarding on PuTTY (Windows) or run a special "ssh" command (Linux), to go through the BNL SSH gateway.
NX technology was developed at NoMachine ( www.nomachine.com ), who licensed the core technology (the core library) under GPL. The community effort (free version) of NX is the FreeNX. We use the NoMachine client (free download), and the FreeNX server. FreeNX client is command-line driven, it's not as easy to use at the moment.
Client installation
Go to the www.nomachine.com and download appropriate version of the client.
Also one can download the 1.5 versions of clients (a snapshot from Jan 06) here locally. (Accessible only inside BNL)
Or I have a local copy of the clients on sc5.starp.bnl.gov
Linux client
sysuser@sc5.starp.bnl.gov:/home/sysuser/Gorbunov/arch/nxclient-1.5.0-141.i386.tar.gz
Windows Client
sysuser@sc5.starp.bnl.gov:/home/sysuser/Gorbunov/arch/Windows/nxclient-1.5.0-138.exe
plus fonts
rpms
Mandrake
/home/sysuser/Gorbunov/arch/rpm_mandrake/nxclient-1.5.0-141.i386.rpm
redhat
/home/sysuser/Gorbunov/arch/nxclient-1.5.0-141.i386.rpm
and two files for debian
/home/sysuser/Gorbunov/arch/deb_sarge/nxclient_1.5.0-141_i386.deb
/home/sysuser/Gorbunov/arch/deb_woody/nxclient_1.5.0-141_i386.deb
I guess you know what to do with rpm files and deb files but I have to explain what to do with *.tar.gz
cd /usr
tar -xzvf /where/you/have/nxclient-1.5.0-141.i386.tar.gz
so you ready to start it!
First thing to do is to establish port forwarding
Normally we have to go through the BNL ssh gateway (rssh.rhic.bnl.gov) to gain access to BNL computers, in a two step process, first ssh to rssh.rhic.bnl.gov, then from there "ssh BNL_host". To make nxclient connect directly to the Linux server inside BNL firewall with SSH, we'll need to take advantage of the SSH port forwarding feature.
For Linux, this is just a ssh command,
this is not exactly true any more
ssh -L 7777:sc5.starp.bnl.gov:22 your_username@rssh.rhic.bnl.gov
please use the set bellow
since stargw has been added please use the following commands, and if I will find something more simple I will update the page
ssh -L 7777:localhost:7777 user_name@rssh.rhic.bnl.gov -A
ssh -L 7777:localhost:7777 user_name@stargw.starp.bnl.gov -A
ssh -L 7777:localhost:22 user_name@sc5.starp.bnl.gov
Login to rssh.rhic.bnl.gov with the command above (don't forget to put a real user name) and leave the command window open.
There is also a solution for windows. It's a bit convoluted way to do it but so far I don't have anyhting more elegant.
First you should have pageant.exe running which should have you ssh key uploaded.
As the next step go to the startup menu -> click run - > in the menu type cmd , The window should appear in which one you should type :
putty.exe -L 7777:localhost:7777 user_name@rssh.rhic.bnl.gov -A
as a result a standrad putty terminal window will appear in this window type:
ssh -L 7777:localhost:7777 user_name@stargw.starp.bnl.gov -A
ssh -L 7777:localhost:22 user_name@sc5.starp.bnl.gov
and than start nx for windows as usual .
I will update this page if I will find a better solution
Client Configuration
Start nx client with the command /usr/NX/bin/nxclient
the window below will appear on the screen
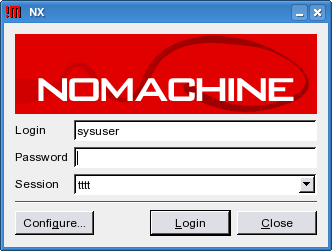
Picture 1
Login Screen
Specify the username : sysuser
Password for the sc5.starp.bnl.gov
Name the seession : whatever you like
Now it's time to configure the NXClient. Click "Configure" on the NXclient logon scree, you'll get the configuration screen, as shown below.
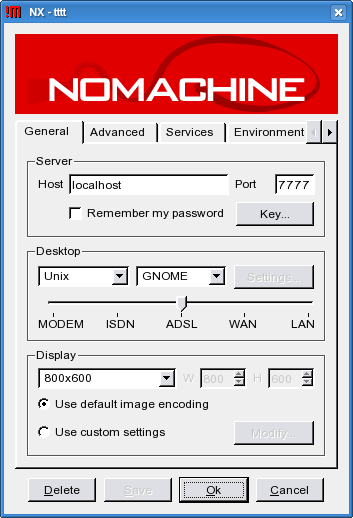
Picture 2
Configuration Screen
Now specify host name : localhost
port 7777
Desktop Unix and X window manager GNOME
Display
I used 800x600 , but screen is a bit too small I think .. there are several options available an you can try them to see what fits you best.
Now we have to configure public key!
download one from sc5.starp.bnl.gov
sc5.starp.bnl.gov:/home/sysuser/Gorbunov/arch/client.id_dsa.key to you computer
or on sc5 at /etc/nxserver/client.id_dsa.key
Clcik “Key” button in the configuration screen
The screen below will appear
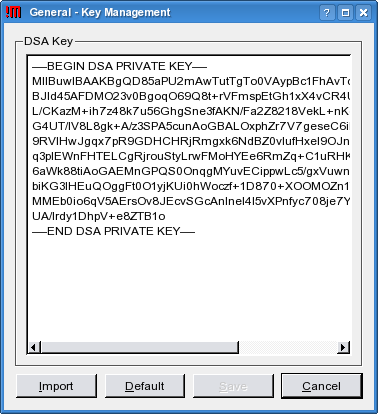
Picture 3
Public Key Specification Screen
Click “Import” navigate to where you stored the public key and select the file, click “ok”
then click “Save”
You will get back to the configure menu, click “Save” and “Ok” and then click “Login” on the login menu
After few seconds a new screen appear as shown below :
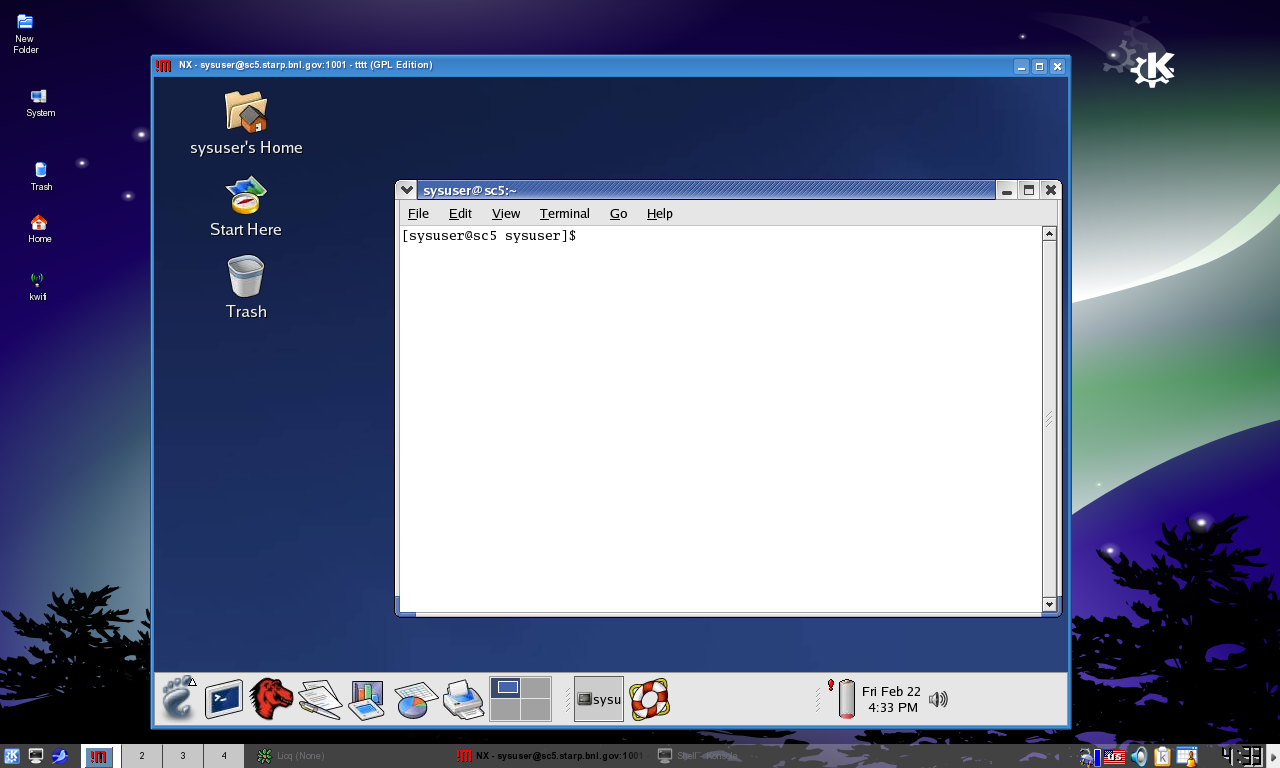
We need a putty client and Xwindows server (Exceed or similar)
First click on the PuTTY icon, to configure it. Host Name =rssh.rhic.bnl.gov. port 22. As shown.
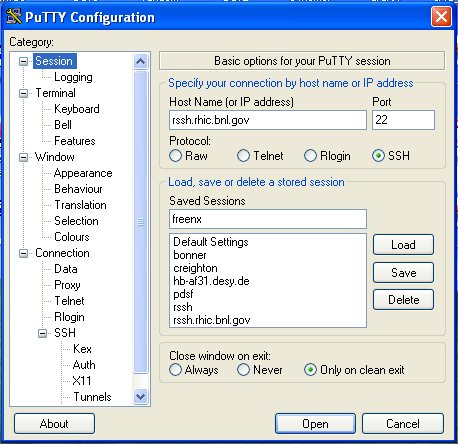 \
\
Next click on SSH -> X11 button on the left, Enable X11 forwarding, to localhost:0
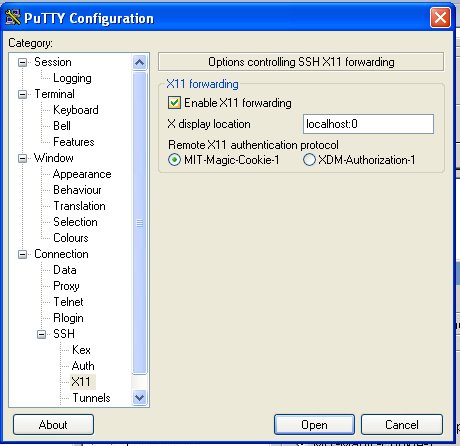
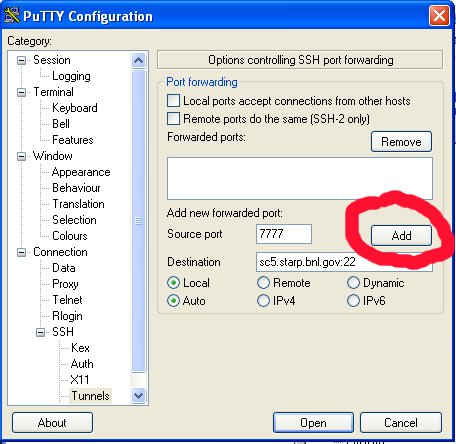
Now click on Tunnels, fill in Source port the LocalPortNumber you chose (7777 in this example, this should be the same number that you input in the nxclient configure screen). Click on Add. Go back to the session tab to save the session, so that you don't have to go through all this configuring again every time you use it. Login to your rssh.rhic.bnl.gov account with your userid and passwd. Leave the PuTTY window open.
