geometry in MC
Documented evolution of implementation of FGT geometry in GSTAR, started on May, 2008
Our studies are below seen as child pages.
Here are links to other studies
- Weight of SSD componants (from survey), missing ladder weight in geant, total ~300g on West end, also: Jonathan
- SSD small end ring : Jonathan, total weight = 3416 g, missing in geant
- overview of Nonexistent node nid: 12480., Oct-2008, Christophe
1 content of UPGR15, May 2008
Selected cross sections of UPGR15 geometry, as of May 2008
Fig 1

Fig 2

Fig 3

Fig 4

Fig 5

Fig 5 Realistic geometry from Jim K. model, May 2008

2 UPGR15+FGT as of May 2008
UPGR15 geometry was modified to match best guess of FGT geometry as of May 2008.
The active FGT area is : Z1=70,..., Z6=120cm, DZ=10 cm, Rin=11.5cm, Rout=37.5 cm
There is 1cm of additional dead material at Rin & Rout
Fig 1. Zvertex=0 cm, green= eta [1.06,2.0]. , red=eta[2.5,4.0]

Fig 2. Zvertex=+30 cm, green= eta [1.06,2.0]. , red=eta[2.5,4.0]

Fig 3. Zvertex=-30 cm, green= eta [1.06,2.0]. , red=eta[2.5,4.0]

Fig 4. Zoom in on 1 FGT disk. Detected particle enters from the left, 'active' gas volume has depth of 3mm (between magenta ad blue lines), FGT strips collect charge on the 1st green line.
(units in cm)
Zstart = 70.0 ! starting position along Z axis
Z = { 0.0, 10.0, 20.0, 30.0, 40.0, 50.0} ! Z positions for GEM front face
FThk = { 0.05, 0.05, 0.05, 0.05 } ! foil thicknesses inside GEM
SThk = { 0.3, 0.2, 0.2, 0.2 } ! support/spacing thicknesses
SR = 1.0 ! radial size for support

USED material:
Fig 4b FGT disk front view in Geant

Fig 5. 1st FGT disk by Jim K. as of April, 2008


Fig 6. 3 FGT disks by Jim K. as of April, 2008

Fig 7 Realistic geometry from Jim K. as of May, 2008

Fig 8 Disk material budget, from Doug, as of May, 2008

Fig 9 APV location , from Doug, as of May, 2008

4 compare geom 2007 vs. UPGR16
Green dashed lines at eta=1.0,.1.06,2.0
red lines at eta=2.5, 4.0
geom=2007

UPGR16, geom=2010

Speculative FGT++
another 6 disks are added at the following Z:
Zstart = 62.98 ! starting position along Z axis
Z = { 5.4, 15.4, 25.4, 35.4, 45.4, 55.4, 75., 90., 105., 120., 135., 150.} ! Z positions of GEM front face
Green dashed lines at eta=1.0,.1.09,2.0
red lines at eta=2.5, 4.0

5 FGT cables in Geant
Notes,
If I want to know the total area for one FGT disk what is the proper multiplier : 4, 28, or 24*28 ?
Within the cable, multipliers for the individual "subcomponents" are in column L.
Then, there are overall 4 cables per FGT disk - the column B tells you number of cables and I-J tells you where they go.
In other words, for instance, overall total copper area in FGT-power cables is
24*(7*5.176E-3+1*3.255E-3) = 0.948 cm^2.
I know you asked to break out with one "line" per cable route - we can do this later but for now there are already a lot of lines... I'll leave them grouped as this and you should look at I-J to decide the lengths and where they are.
By the way, I imagine the "patch" between cone/FGT cables and "external" cables lying on TPC endwheel, through services gap, to crates, occurs somewhere just outside the cone, within the first foot or so.
6 radiation length study for UPGR16 + SSD
Study of the dead material in front and behind FGT.
3 versions of GEANT geometries were investigated:
- UPGR16 + current SSD w/ current cables
- UPGR16 w/ 'light' SSD (Alu support structure replaced by carbon, Cu cables replaced by Alu)
- UPGR16 without SSD, nor SSD cables
Plot below is just example of material using current SSD.

Many more plots are in attached PDF, in particular figs 2a-c, 3a-c, 4a-c.
7 PR track plots with UPGR16 & fixed barrel
Geometry= UPGR16, 6 FGT disks , fixed barrel geometry.
Single electrons, 20 GeV ET, thrown at eta=0, 0.4, 0.8, 1.2, 1.6, 2.0
Fig 1, Z vertex=0

Fig 2, Z vertex=+30 cm

Fig 3, Z vertex=-30 cm

FGT hits fired by backward tracks (Wei-Ming Zhang)
1, MC tracks (eta < -1.3) are thrown backwards and FGT are found fired.
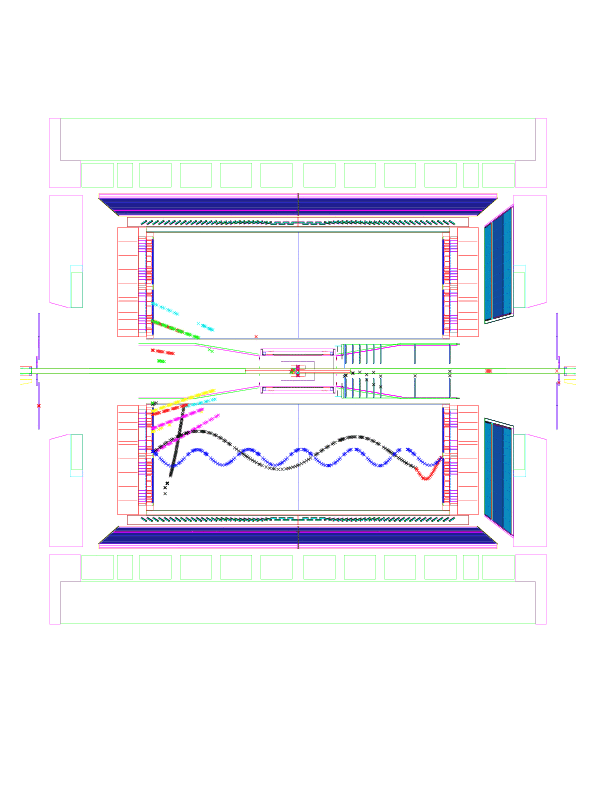
Fig. 1, An events with FGT hits fired by backward tracks (UPGR16)

2, To investigate with tracks (1.3 |eta| < 3.1) from MC events of RQMD Au-Au 10 GeV
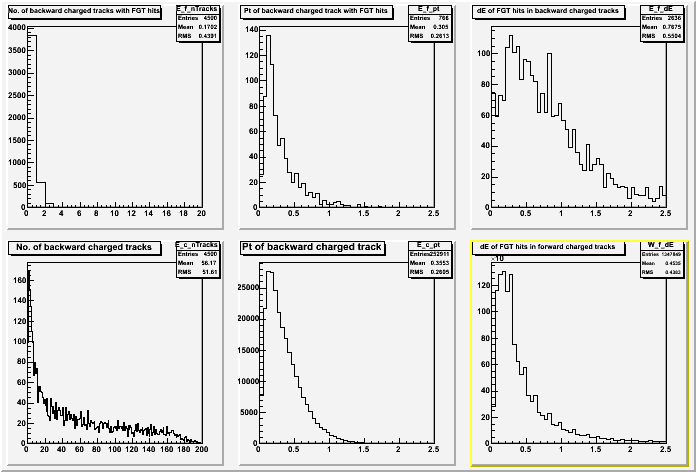
Fig. 2

There are two rows in Fig. 2. Each row has three plots, the left is track multiplicity of events, the middle pt of
tracks, and the right dE of FGT hits in KeV. The top row is plotted for backward tracks which fire FGT and for fired FGT
hits (backward hits). The first two of the bottom are for all backward tracks. The right of the bottom is a dE spectrum
of FGT hits fired by FORWARD tracks (forward hits). From Fig. 1, we see
1, A low level of backward hits (mult_0/mult_1 = 200 shown in the top left plot)
2, A relatively large energy loss of backward hits which is 2-3 time larger than that of forward hits.
This suggests backward tracks which fire FGT have very low speed and deposit more energy than forward MIPs.
Based on the above, we believe that backward hits in FGT come from multiple scattering.
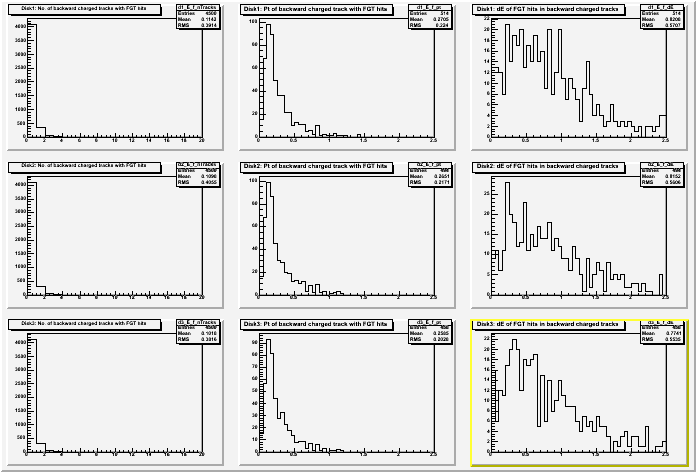
Fig. 3, Split spectra of the top row of Fig. 2 for individual FGT disks: disk1 (top) disk2 (middle)
and disk3 (bottome)

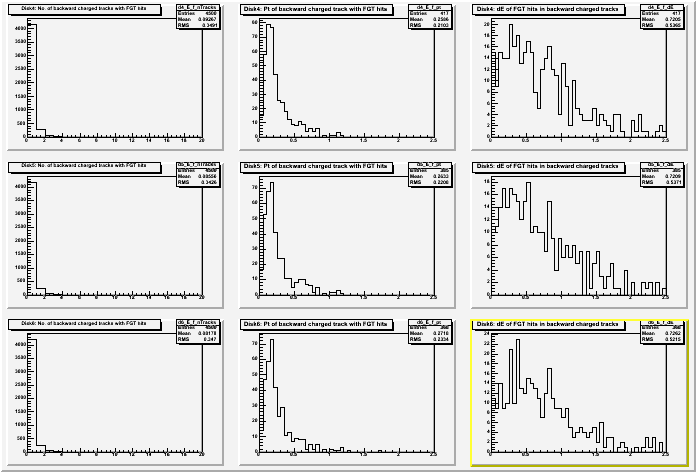
Fig. 4, Split spectra of the top row of Fig. 2 for individual FGT disks: disk4 (top) disk5 (middle)
and disk6 (bottome)

