2008.02.13 Gamma-jet candidates: EEMC response
Ilya Selyuzhenkov February 13, 2008
Data sample
Gamma-jet selection cuts are discussed here. There are 278 candidates found for runId=7136022.
Transverse momentum distribution for the gamma-jet candidates can be found here.
Vertex z distribution for di-jet and gamma-jet events
-
Figure 1: Vertex z distribution.
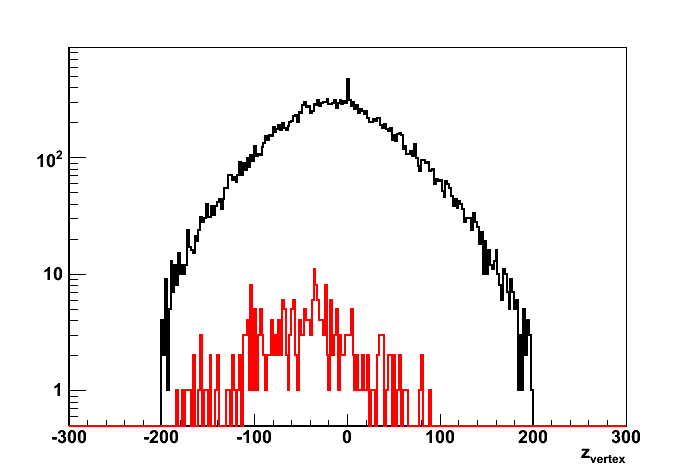
Red line presents gamma-jet candidates (scaled by x50). Black is for all di-jet events.
Same data on a log scale is here.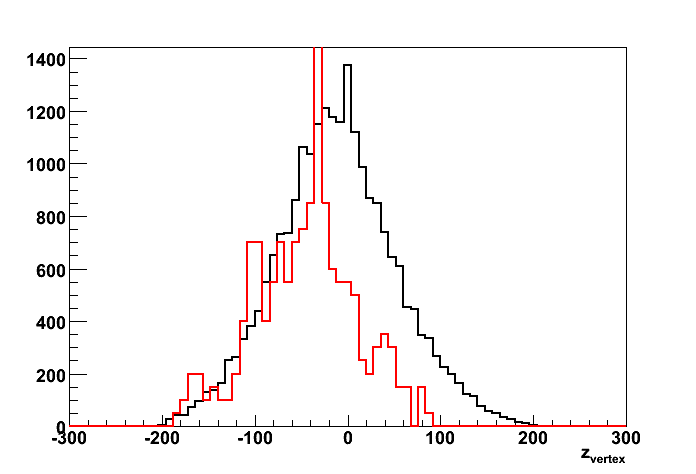
- Figure 2: Average vertex z as a function of transverse momentum of the fist jet (with a largest EM energy fraction).
Red is for gamma-jet candidates. Black is for all di-jet events.
Strong deviation from zero for gamma-jet candidates at pt < 5GeV?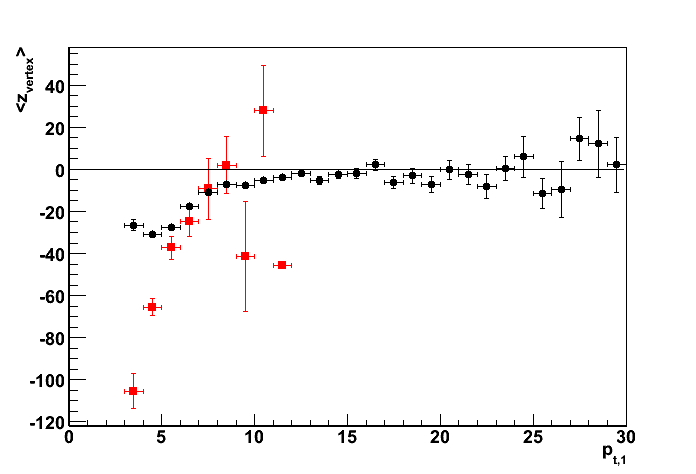
EEMC response for the gamma-jet candidate
EEMC response event by event for all 278 gamma-jet candidate can be found in this pdf file.
Each page shows SMD/Tower energy distribution for a given event:
-
First row on each page shows SMD response
for the sector which has a maximum energy deposited in the EEMC Tower
(u-plane is on the left, v-plane is on the right). -
In the left plot (u-plane energy distribution) numerical values for
pt of the first jet (with maximum EM fraction) and the second jet are given. -
In addition, fit results assuming gamma (single Gaussian, red line) or
neutral pion (double Gaussian, blue line ~ red+green) hypotheses are given. - m_{gamma gamma} value (it is shown in the right plot for v-plane).
If m_{gamma gamma} value is negative, then the reconstruction procedure has failed
(for example, no uv-strips intersection found, or tower energy and uv-strips intersection point mismatch, etc).
EEMC response for these "bad" events can be found in this pdf file.If reconstruction procedure succeded, then
m_{gamma gamma} gives reconstructed invariant mass assuming that two gammas hit the calorimeter.Figure 3: invariant mass distribution (assuming pi0 hypothesis).
Note, that I'm still working on my fitting algorithm (which is not explained here),
and fit results and the invariant mass distribution will be updated.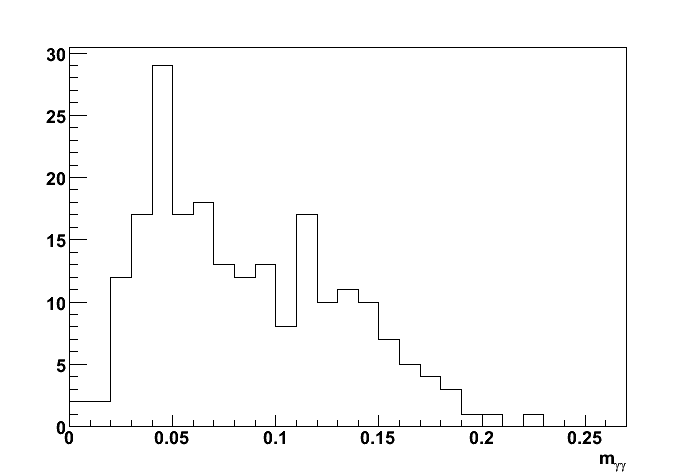
-
It is also shown the ratio for each u/v plane
of the integrated single Gaussian fit (red line) to the total energy in the plane
(look for "gamma U/V " values on the right v-plane plot). -
Second and third rows on each page show the energy deposition in the
tower, pre-shower1, pre-shower2, and post-shower as a function of eta:phi (etaBin:phiBin). - Last row shows the hit distribution in the SMD for all sectors
(u-plane on the left, v-plane of the right).
Playing with a different cuts
Trying to isolate the real gammas which hits the calorimeter,
I have sorted events into different subsets based on the following set of cuts:
- EEMC gamma-jet cuts (energetic photon hits EEMC with pt similar or greater to that of the opposite jet)
if (invMass < 0) reject
if (jet2_pt > jet1_pt) reject
if (jet1_pt < 7) reject
if (minFraction < 0.75) reject
(minFraction = gamma U/V - is a fraction of the integrated single Gaussian peak to the total energy in the uv-plane)Figure 4: Sample gamma-jet candidate EEMC response
(all gamma-jet candidates selected according to these conditions can be found in this pdf file):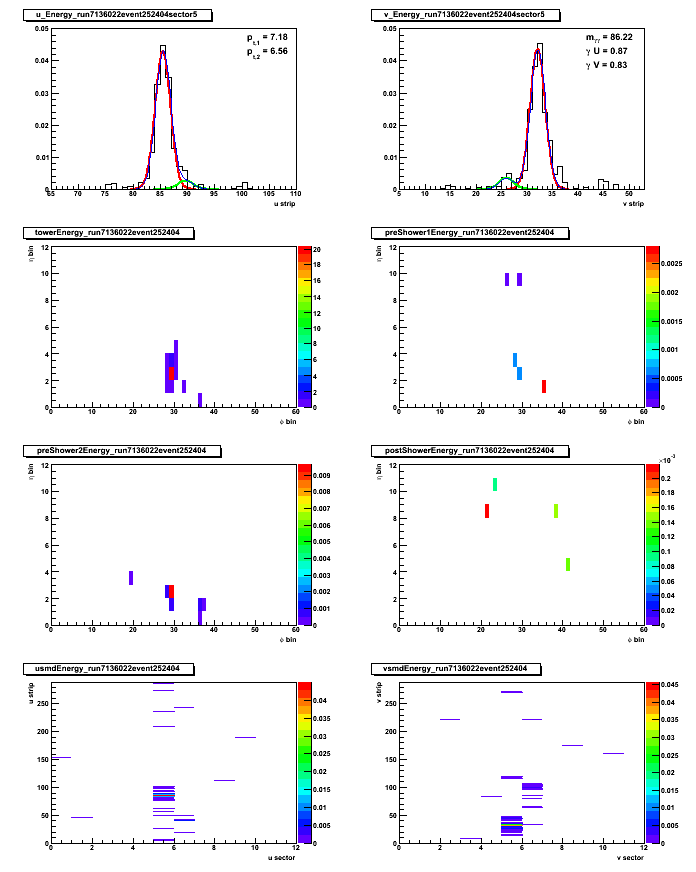
- EEMC pi0 cuts:
if (invMass < 0) reject
if (jet2_pt < jet1_pt) reject
if (jet2_pt < 7) reject
if (minFraction < 0.75) rejectEvent by event EEMC response for pi0 (di-jet) candidates
selected according to these conditions can be found in this pdf file.