01 Jan
January 2008 posts
2008.01.30 Selecting gamma-jet candidates out of the jet trees
Ilya Selyuzhenkov January 30, 2008
Data set
jet trees by Murad Sarsour for pp2006 run, runId=7136022 (~60K events, no triggerId cuts yet)
Jets gross features
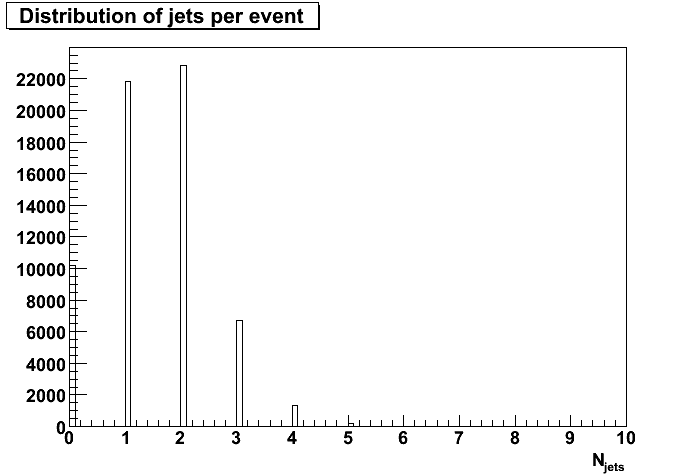
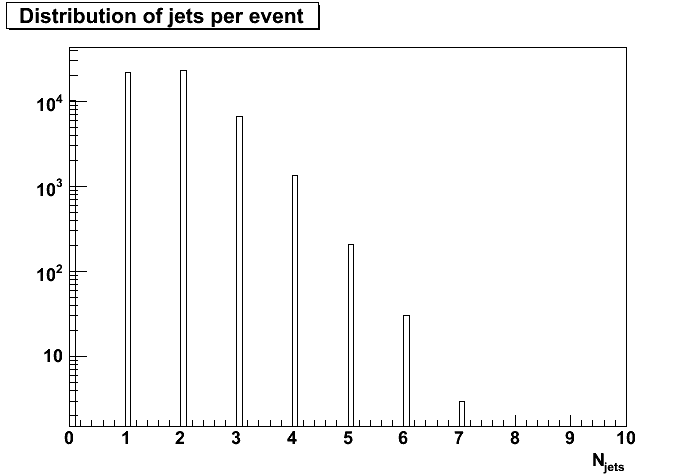
- Figure 1: Distribution of number of jets per event. Same data on a log scale is here.
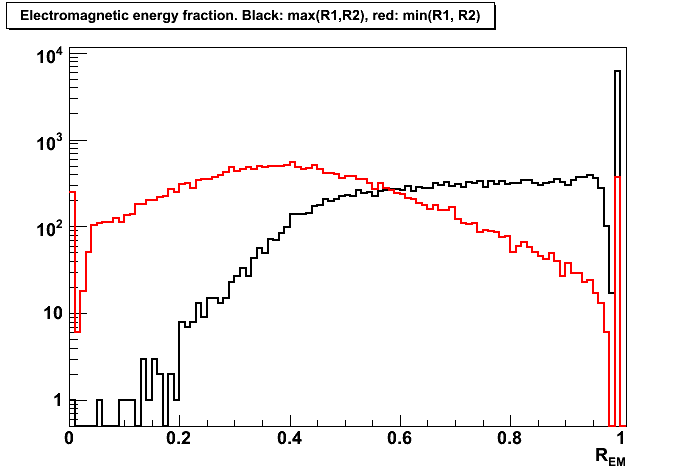
- Figure 2: Distribution of electromagnetic energy (EM) fraction, R_EM, for di-jet events (number of jets/event = 2).
R_EM = [E_t(endcap)+E_t(barrel)]/E_t(total).
Black histogram is for R_EM1 = max(Ra, Rb), red is for R_EM2 = min(Ra, Rb).
Ra and Rb are EM fraction for jets in the di-jet event.
Same data on a log scale is here.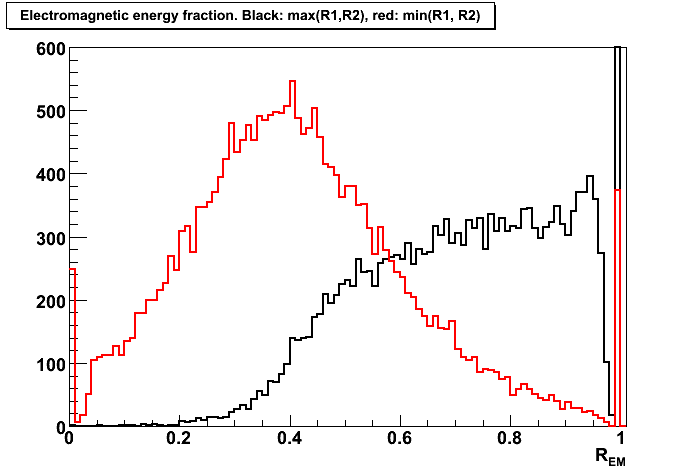
Gamma-jet isolation cuts list:
- selecting di-jet events with one of the jet dominated by EM energy,
and another one with more hadronic energy:R_EM1 >0.9 and R_EM2 < 0.9
- selecting di-jet events with jets pointing opposite in azimuth:
cos(phi1 - phi2) < -0.9
- requiring the number of associated charged tracks with a first jet (with maximum EM fraction) to be less than 2:
nChargeTracks1 < 2
- requiring the number of fired EEMC towers associated with a first jet (with maximum EM fraction) to be 1 or 2:
0 < nEEMCtowers1 < 3
Applying gamma-jet isolation cuts
- Figure 3: Distribution of eta vs number of EEMC towers for the first jet (with maximum EM fraction).
Cuts:1-3 applied (no 0 < nEEMCtowers1 < 3 cut).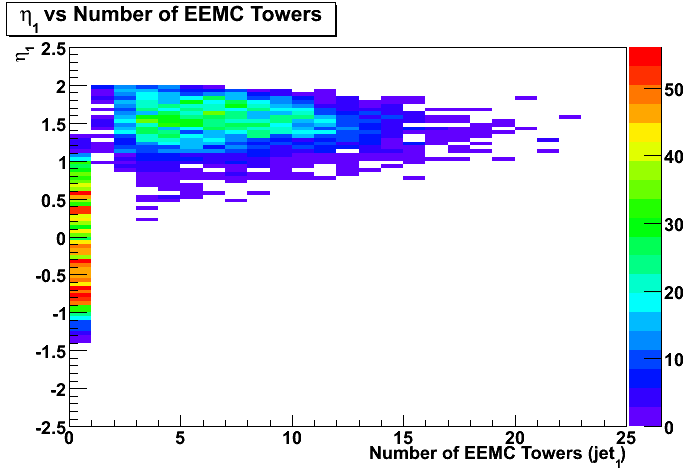
- Figure 4: Distribution of transverse momentum, pt1, of the first jet (with maximum EM fraction)
vs transverse momentum, pt2, of the second jet.
Cuts:1-4 applied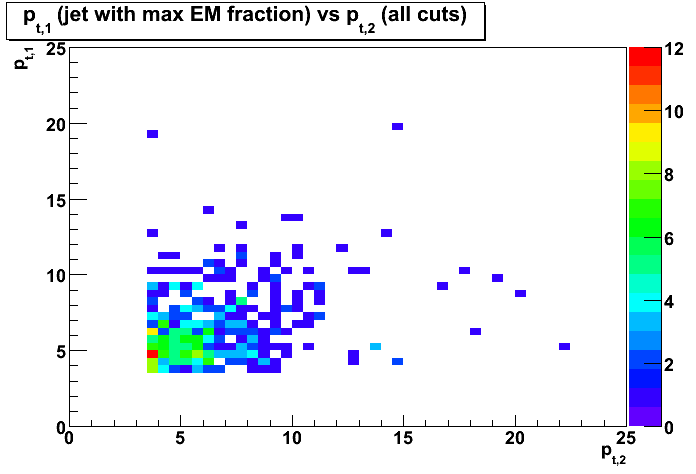
- Figure 5: Distribution of mean transverse momentum, < pt1 >, of the first jet (with maximum EM fraction)
vs transverse momentum, pt2, of the second jet.
Cuts:1-4 applied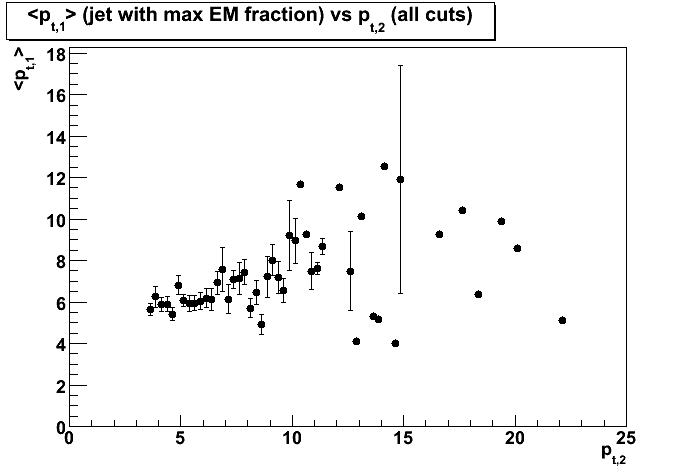
- Figure 6: Distribution of pseudorapidity, eta1, of the first jet (with maximum EM fraction)
vs pseudorapidity, eta2, of the second jet.
Cuts:1-4 applied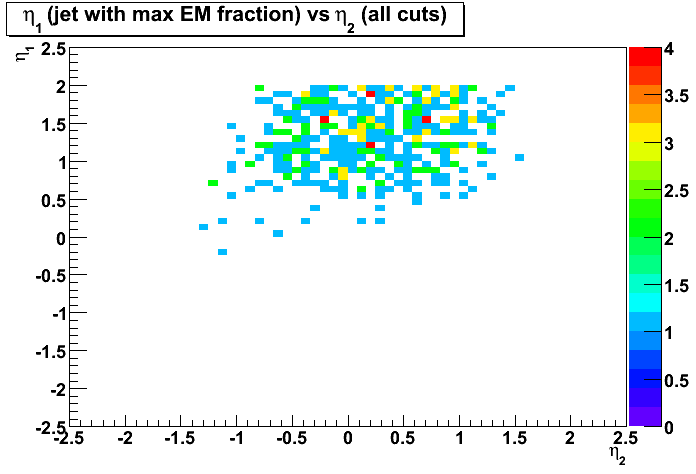
- Figure 7: Distribution of azimuthal angle, phi1, of the first jet (with maximum EM fraction)
vs azimuthal angle, phi2, of the second jet.
Cuts:1-4 applied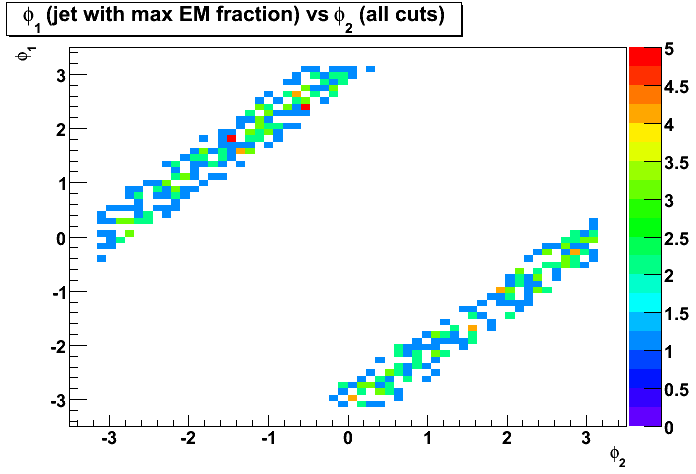
- Figure 8: Distribution of transverse momentum, pt1, of the first jet (with maximum EM fraction)
vs transverse energy sum for the EEMC towers associated with this jet.
Cuts:1-4 applied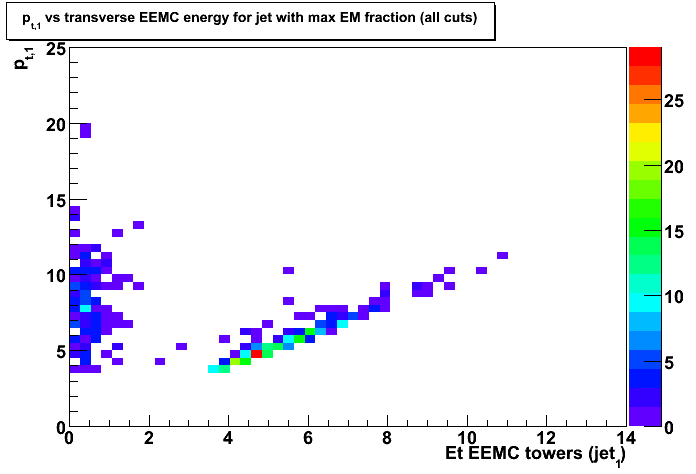
- Figure 9: Distribution of transverse momentum, pt1, of the first jet (with maximum EM fraction)
vs transverse momentum, pt2, of the second jet.
Cuts:1-4 + Et(EEMC) > 3.0 GeV