2008.05.05 pt-distributions, sided residual (data vs dd-MC g-jet and bg di-jet)
Ilya Selyuzhenkov May 05, 2008
Data samples:
- pp2006(long) - 2006 pp production longitudinal data after applying gamma-jet aisolation cuts
(jet-tree sample: 4.114pb^-1 from Jamie script, 3.164 pb^1 analyses). - gamma-jet - Pythia gamma-jet sample (~170K events). Partonic pt range 5-35 GeV
- bg jets - Pythia di-jet sample (~4M events). Partonic pt range 3-65 GeV
Figure 1:pt distribution. MC data are scaled to the same luminosity as data
(Normalization factor: Luminosity * sigma / N_events).
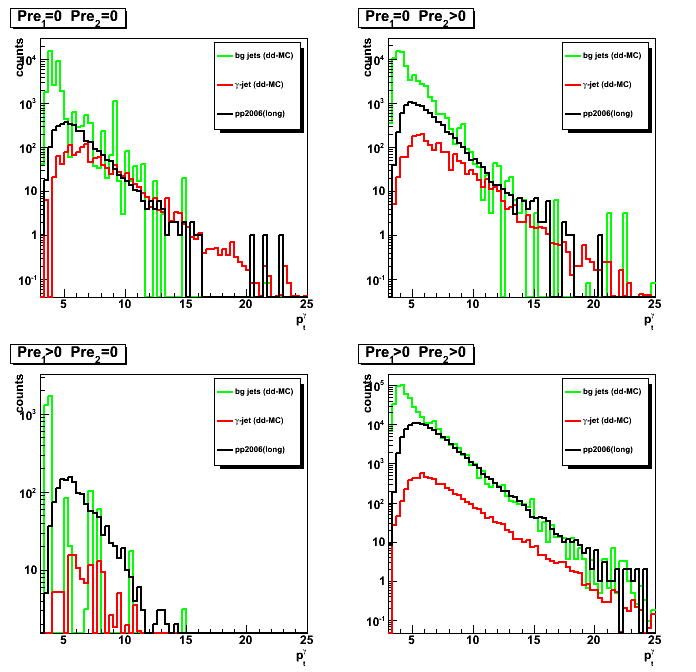
Figure 2:Integrated gamma yield vs pt.
For each pt bin yield is defined as the integral from this pt up to the maximum available pt.
MC data are scaled to the same luminosity as data.
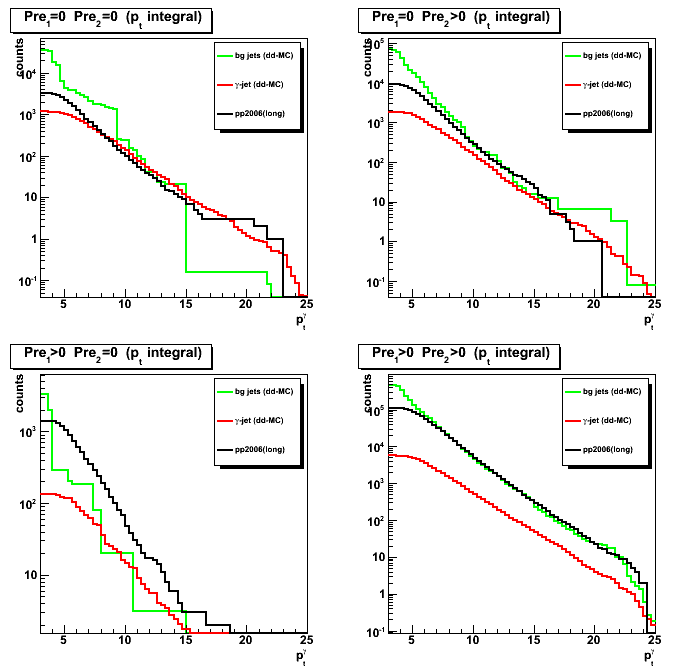
Figure 3:Signal to background ratio (all results divided by the data)
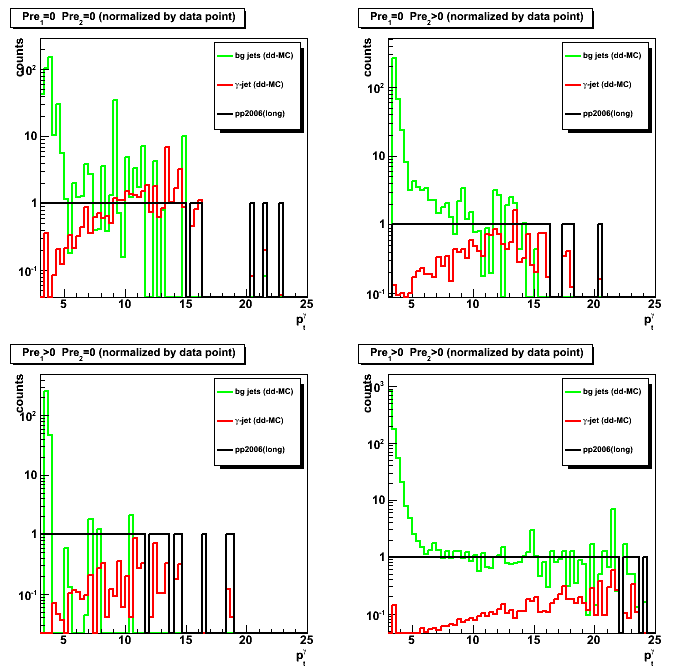
Sided residual: pp2006 data vs data-driven MC (gamma-jet and bg:jet-jet)
You can find sided residual 2-D plots here
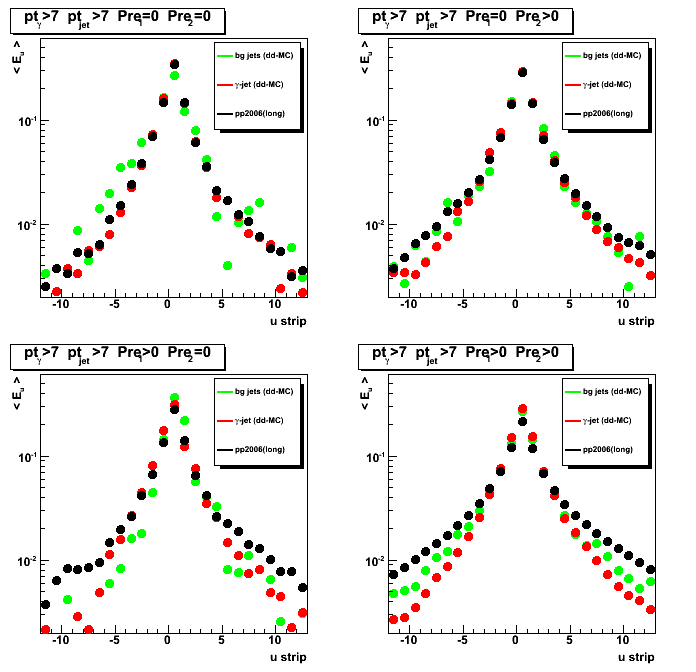
Figure 4:Maximum sided residual for pt_gamma>7GeV; pt_jet>7GeV
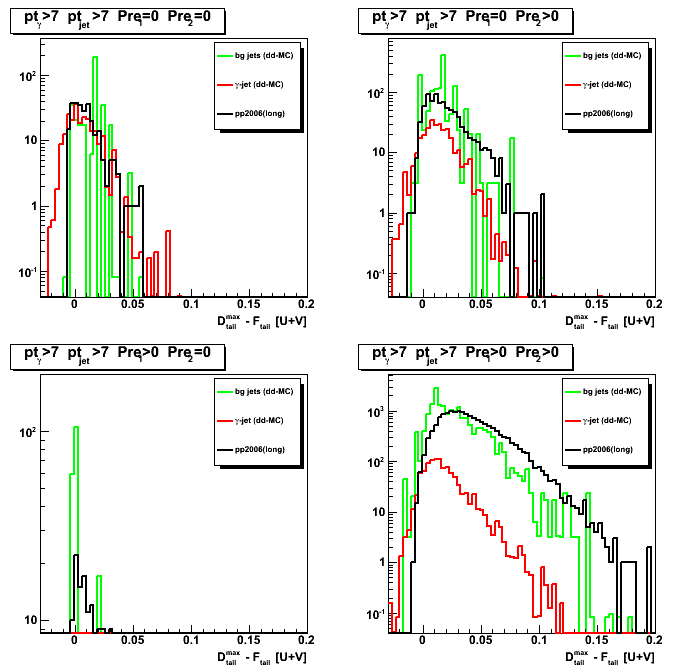
Figure 5:Fitted peak for pt_gamma>7GeV; pt_jet>7GeV
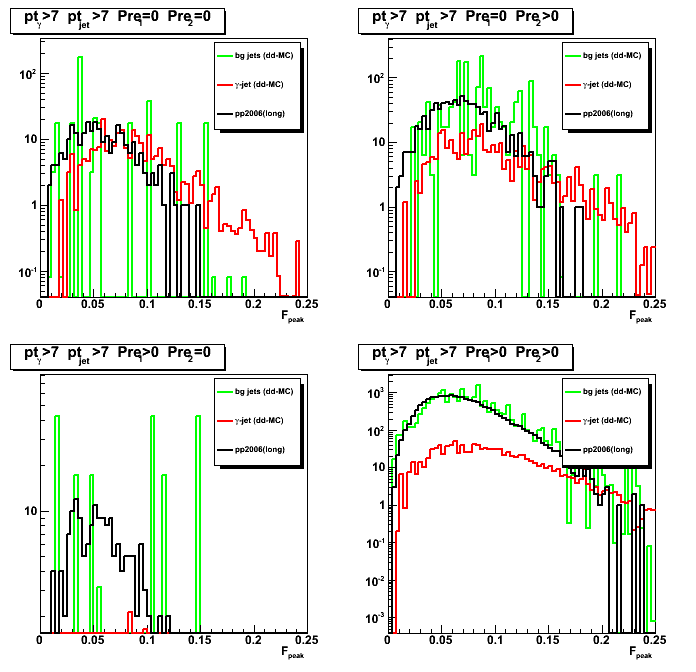
Figure 6:Max data tail for pt_gamma>7GeV; pt_jet>7GeV
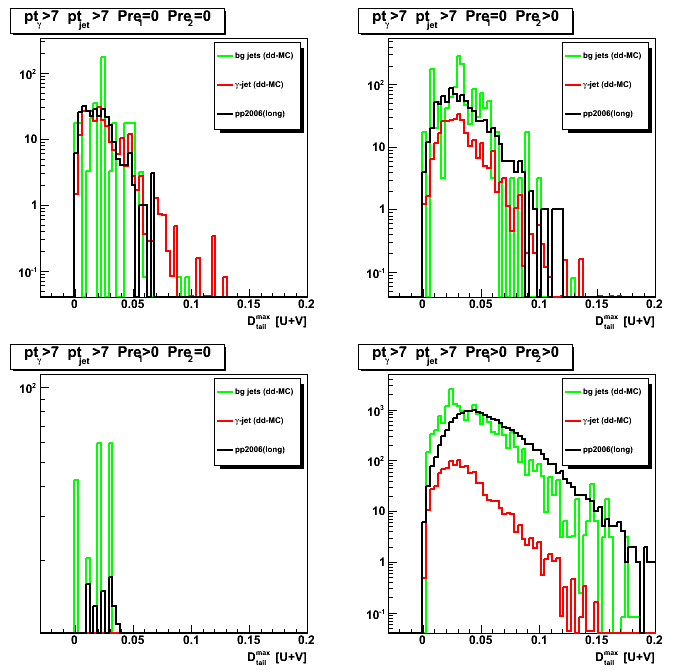
Figure 7:Max minus min data tails for pt_gamma>7GeV; pt_jet>7GeV
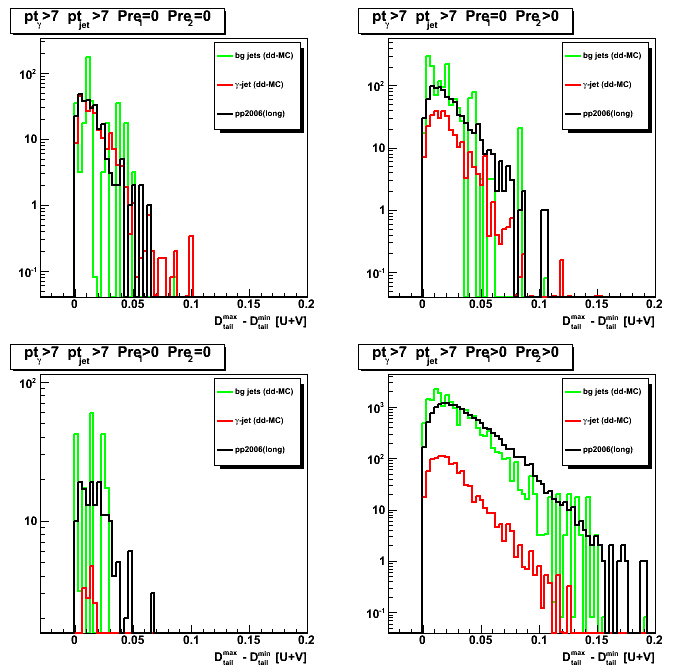
Figure 8:Shower shapes pt_gamma>7GeV; pt_jet>7GeV