1) M-C : response of BSMD , single particles (Jan)
Below are studies of BSMD response and calibration algo based on BMSD response to single particle M-C
1) BSMD-E clusters, sliding max, fixed width
Goal: study SMDE energy resolution and cluster shape for single particles M-C
Input: single particle per event, fixed ET=6 GeV, flat eta [-0.1,1.1], flat |phi| <5 deg, 500 eve per sample, Geant geometry y2006
Cluster finder algo (sliding fixed window), tuned on electron events
- work with 150 Eta-strips per module
- sum geant dE in fixed window of 4 strips
- maximize the sum, compute energy weighted cluster position and RMS inside the window
- algo quits after first cluster found in given module
Example of BSMDE response for electon:
McEve BSMD-E dump, dE is Geant energy sum from given strip, in GeV
dE=1.61e-06 m=104 e=12 s=1 stripID=15462
dE=2.87e-05 m=104 e=13 s=1 stripID=15463
dE=8.35e-06 m=104 e=14 s=1 stripID=15464
dE=1.4e-06 m=104 e=15 s=1 stripID=15465
ALL plots below have energy in keV , not MeV - I'll not change plots.
Results:
Fig 1. gamma - later, job crashed.
Fig 2. electron

Fig 3. pi0

Fig 4. eta

Fig 5. pi minus

Fig 6. mu minus

2) BSMDE , 1+3+1 sliding cluster finder
Goal: test SMDE cluster finder on single particles M-C
Input: single particle per event, fixed ET=6 GeV, flat eta [-0.1,1.1], flat |phi| <5 deg, 5k eve per sample, Geant geometry y2006
Cluster finder algo (seed is sliding fixed window), tuned on pi0 events
- work with 150 Eta-strips per module
- all strips are marked as 'unused'
- use only module 13, covering ~1/3 of probed phase space
- sum geant dE in fixed window of 3 unused strips, snap at location which maximizes the energy
- if sum below 5 keV STOP searching for clusters in this module
- add energy from one strip on each side, mark all 1+3+1 strips as 'used'
- compute energy weighted cluster position and RMS
- goto 1
Example of BSMDE response for pi0:
...
strID=1932 u=0 ene/keV=0
strID=1933 u=1 ene/keV=0    +
strID=1934 u=1 ene/keV=2.0  *
strID=1935 u=1 ene/keV=48.2 *X
strID=1936 u=1 ene/keV=3.9  *
strID=1937 u=1 ene/keV=0.8  +
strID=1937 u=0 ene/keV=0
strID=1938 u=0 ene/keV=0
strID=1939 u=2 ene/keV=1.5  +
strID=1940 u=2 ene/keV=8.2  *
strID=1941 u=2 ene/keV=28.1 *X
strID=1942 u=2 ene/keV=13.8 *
strID=1943 u=2 ene/keV=4.0  +
strID=1944 u=0 ene/keV=5.6
strID=1945 u=0 ene/keV=0.5
strID=1946 u=0 ene/keV=0
strID=1947 u=0 ene/keV=0
...
| particle | any cluster found in the module, all eventsFig 1a | only events with exactly 2 found clustersFig 1b |
e- |  |  |
| . | Fig 2a | Fig 2b |
pi0 |  |  |
| . | Fig 3a | Fig 3b |
eta |  |  |
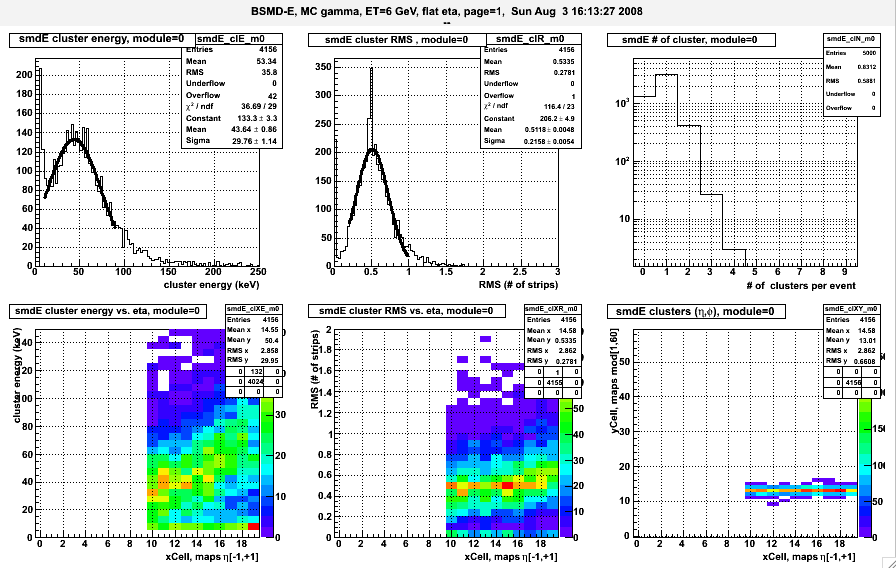
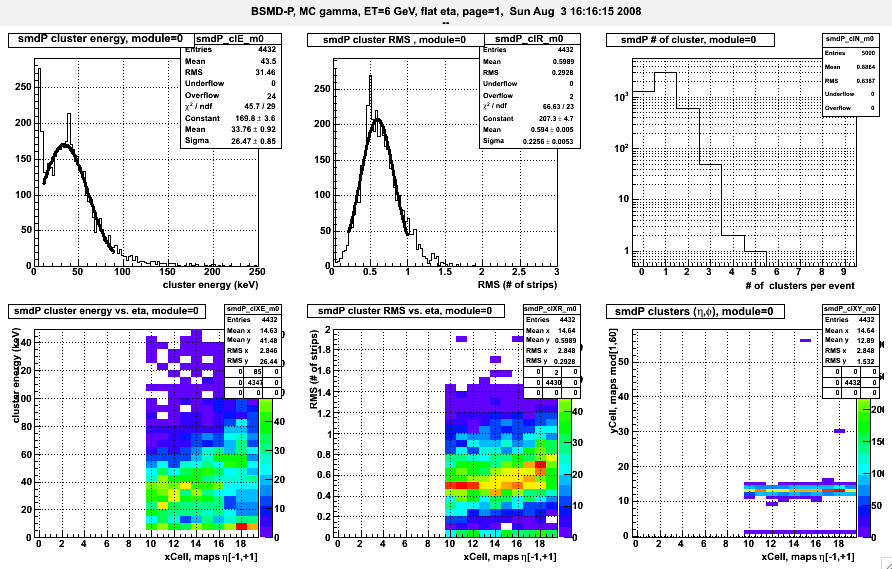
3) same algo applied to full East BSMDE,P
Smd cluster finder with sliding window of 3 strips + one strip on each end (total 5 strips) applied to all 9000 BSMDE,P strips, one gamma per event
4) demonstration of absolute calib algo on single particle M-C
Goal: determine absolute calibration of BSMDE,P planes
Method: identify isolated EM shower and match BSMD cluster energy to tower energy
INPUT events: single particle per event, fixed ET=6 GeV, flat eta [-0.1,1.1], flat |phi| <5 deg, 5k eve per sample, Geant geometry y2006
Cluster finder algo (seed is sliding fixed window), tuned on pi0 events
- work with 150 Eta-strips per module or 900 Phi-strips at fixed eta
- all strips are marked as 'unused'
- use only module 13, covering ~1/3 of probed phase space
- sum geant dE in fixed window of 3 unused strips, snap at location which maximizes the energy
- if sum below 5 keV STOP searching for clusters in this module
- add energy from one strip on each side, mark all 1+3+1 strips as 'used'
- compute energy weighted cluster position and RMS
- goto 1
This cluster finder process full Barrel West, more details about clustering is in one cluster topology , definition of 'barrel cell'
Isolated EM shower has been selected as follows, tuned on gamma events,
- select isolated eta-cluster in every segment of 15 eta strips.
- require cluster center is at least 3 strips away from edges of this segment (defined by eta values of 0.0, 0.1, 0.2,....0.9, 1.0)
- require there is only one phi-cluster in the same 0.1x0.1 eta.phi cell
- require phi-cluster center is at least 3 strips from the edges
- find tower matching to the cross of eta & phi cluster
- require this tower has ADC>100
Example of EM cluster passing all those criteria is below:
smdE: ene/keV= 40.6   inTw 451.or.471
 cell(15,12),   jStr=7 in xCell=15
...
id=1731  ene/keV=4.9  *
id=1732  ene/keV=34.3  X *
id=1733  ene/keV=1.5  *
...
---- end of SMDE dump


smdP: ene/keV= 28.5  inTw 471.or.472
  cell(15,12),   jStr=7 in xCell=15
...
id=1746  ene/keV=2.7  *
id=1756  ene/keV=22.0  X *
id=1766  ene/keV=3.7  *
...
---- end of SMDE dump

muDst BTOW
  id=451, m=12 rawADC=12.0
* id=471, m=12 rawADC=643.0
  id=472, m=12 rawADC=90.0
  id=473, m=12 rawADC=10.0
Results for gamma events
will be show with more details. The following PDF files contain full set of plots for all other particles.
particle | # of eve | plots |
| gamma | 25K | |
| e- | 50K | |
| pi0 | 50K | |
| eta | 50K | |
| pi- | 50K |
Fig 1, Any Eta-cluster, single gamma, 25K events
TOP: a) Cluster (Geant) energy; b) Cluster RMS, c) # of cluster per event,
BOTTOM: X-axis is eta location, 20 bins span eta [-1,+1]. d) cluster ene vs. eta, e) cluster RMS vs. eta, f) cluster yield vs. eta & phi.

Fig 2, Any Phi-cluster, single gamma, 25K events
see Fig 1 for details

Fig 3, Isolated EM shower, single gamma, 90K events
TOP: a) cluster loss on subsequent cuts, b) # of accepted EM cluster vs. eta location, c) ADC distribution of hit tower (some wired gains are in default M-C), tower ADC is in ET
BOTTOM: X-axis is eta location, 20 bins span eta [-1,+1]. d) Eta-cluster , e) phi-cluster energy, f) hit tower ADC .

Fig 4, Calibration plots, single gamma, 90K events.
TOP: BSMD Eta vs. Phi as function of pseudorapidity. BOTTOM: BSMD vs. BTOW as function of pseudorapidity.3 eta location of 0.1, 0.5, 0.9 of reco EM cluster are shown in 3 panels (2x2)
1D plots are ratios of the respective 2D plots.
The mean values of 1D fits are relative gains of BSMDP/BSMDP and BSMD/BTOW , determine for 10 slice in pseudorapidity. Game is over :).

Fig 5, Same as above, eta=0.1, single pi0, 50K events.

Fig 6, Same as above, eta=0.1, single pi minus, 50K events.

Below are PDF plots for all particles:
Correction - label on the X-axis for 1D plots is not correct. I did not apply log10() - a regular ratio is shown, sorry.
5) Evaluation of BSMD dynamic range needed for the W program at STAR, ver 1.0
M-C study of BSMD response to high energy electrons

Attachment 1:
Fig 1 & 2 reminds actual (pp data based) calibration for 2 eta location of 0.1 and 0.8, presented earlier.
Table 1 shows M-C simulation of average cluster energy (deposit in BSMD plane), its spread, and width as function of electron ET, separately for eta- & phi-planes of BSMD.
As expected, BSMD sampling fraction (SF, red column) is not constant but drops with energy of electron.
The BSMD SF(ET) deviates from constant by less then 20% - it is a small effect.
Fig 3,4,5 show expected BSMD response to M-C electrons with ET of 6,20, and 40 GeV. Only for the lowest energy the majority of EM showers fit in to the dynamic range of BSMD, which ends for energy deposit of about 60 keV per plane.
I was trying to be generous and draw the red line at DE~90 keV .
The rms of BSMD cluster is about 0.5 strips, so majority of energy is measured by just 2 strips (amplifiers). Such narrow cluster lowers saturation threshold.
Fig 6, shows BSMD cluster energy for PYTHIA W-events.
Fig 7 shows similar response to PYTHIA QCD events.
Compare area marked with red oval - there is strong correlation between BSMD energy and electron energy and would be not wise to forgo it in the e/h algo.
Conclusion:
The attached slides show 2008 HV setting of BSMD would lead to full saturation of BSMD response for electrons from W decay with ET as low as 20 GeV , i.e. would reduce BSDM dynamic range to 1 bit.0
For the reference:
* absolute BSMD calibration based on 2008 pp data.
http://drupal.star.bnl.gov/STAR/subsys/bemc/calibrations/bsmd/2008-bsmd-calibration/19-isolated-gamma-algo-description-set-2-0
* current BSMD HV are set very high , leading to saturation of BSMD at gamma energy of 7-10 GeV, depending on eta and plane. (Lets ignore difference between E & ET for this discussion, for now).
http://drupal.star.bnl.gov/STAR/subsys/bemc/calibrations/bsmd/2008-bsmd-calibration/20-bsmd-saturation
* STAR priorities for 2009 pp run presented at Apex: http://www.c-ad.bnl.gov/APEX/APEXWorkshop2008/talks/Dunlop_Star_Apex_2008.pdf
* Attachment 2,3 show BSMD-E, -P response for electrons with ET: 4,6,8,10,20,30,40,50 GeV and to Pythia W, QCD events (in this order)