08 Aug
August 2008 posts
2008.08.14 Shower shape with bug fixed dd-library
Ilya Selyuzhenkov August 14, 2008
Data sets:
- pp2006 - STAR 2006 pp longitudinal data (~ 3.164 pb^1) after applying gamma-jet isolation cuts.
- gamma-jet - data-driven Pythia gamma-jet sample (~170K events). Partonic pt range 5-35 GeV.
- QCD jets - data-driven Pythia QCD jets sample (~4M events). Partonic pt range 3-65 GeV.
Data-driven maker with bug fixed multi-shape replacement:
- Four pre-shower bins: pre1,2=0, pre1=0,pre2>0 pre1<4MeV, pre1>=4MeV
- plus two energy bins (E<8GeV, E>=8GeV)
Figure 1: Shower shapes for u-plane [12 strips]
Shower shapes for the library are for the E>8GeV bin.
Open squares and triangles represents raw [without dd-maker]
MC gamma-jet and QCD background shower shapes respectively
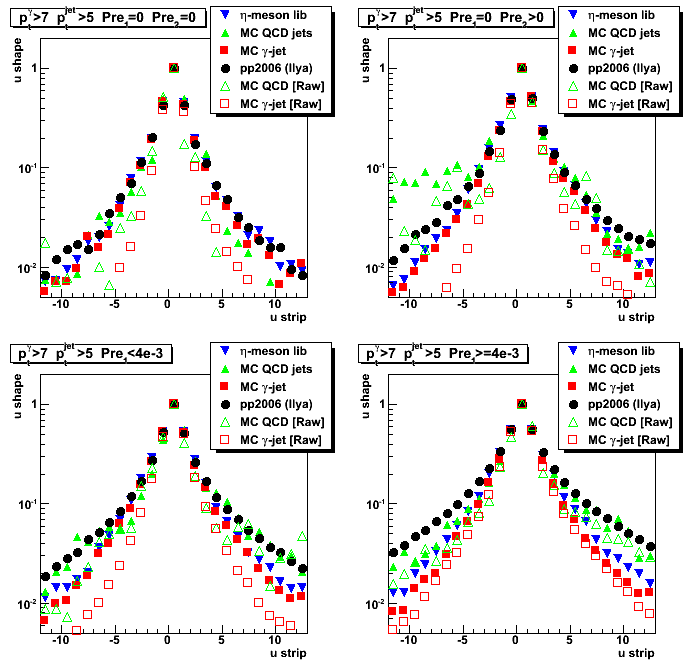
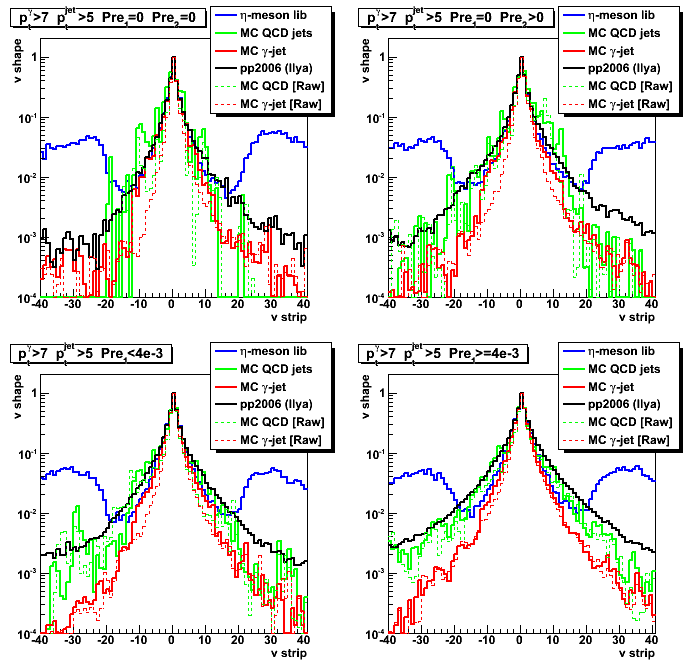
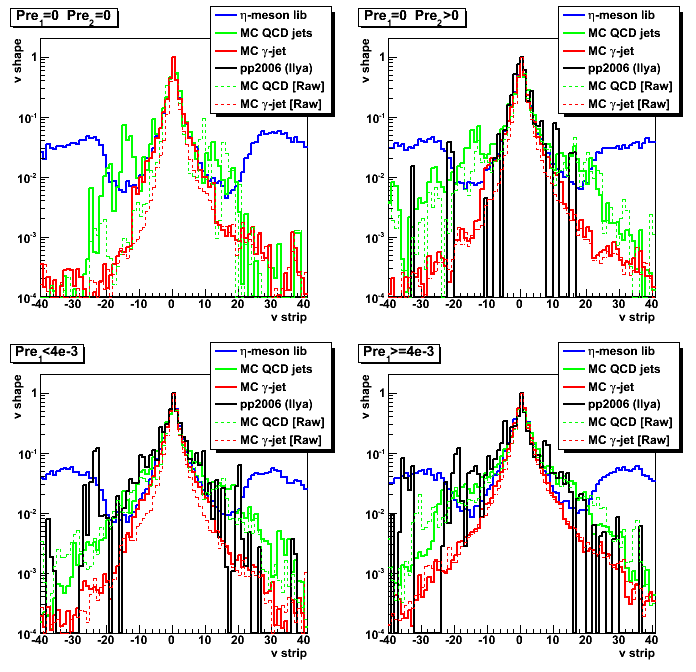
Figure 2: Shower shapes for v-plane [12 strips]
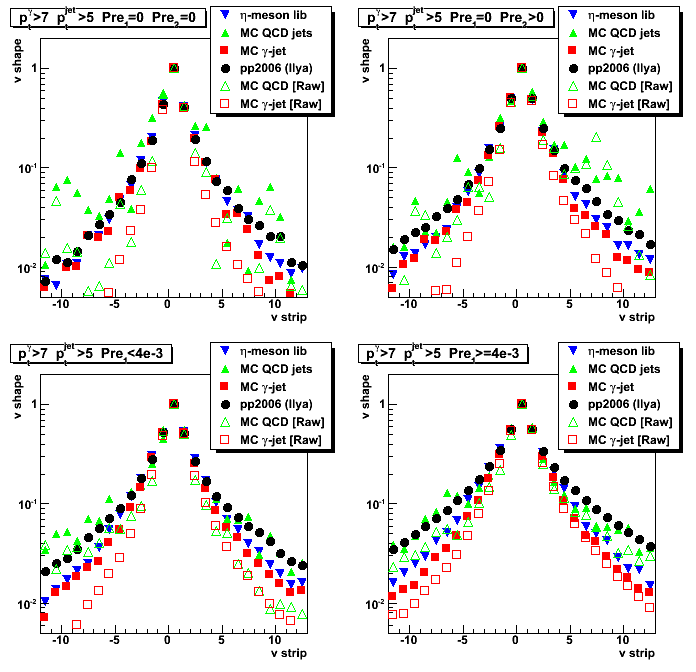
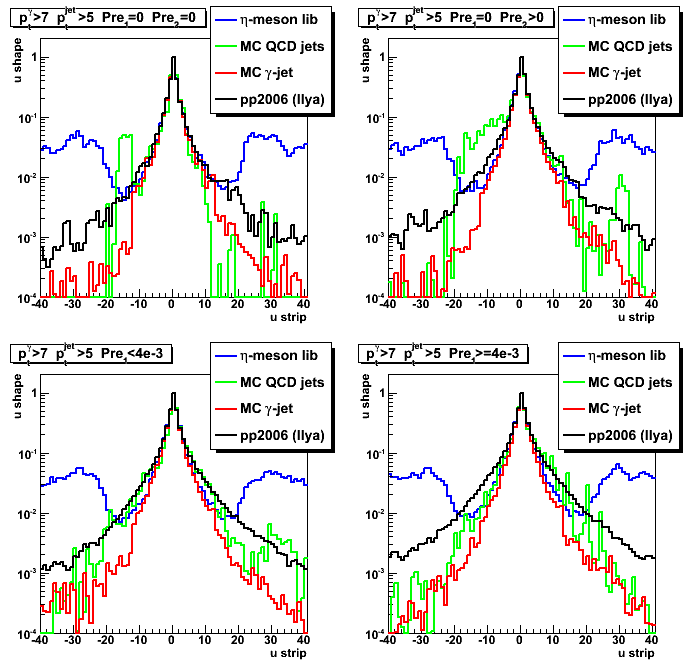
Figure 3: Shower shapes for u-plane [expanded to 40 strips]
Dashed red and green lines represents raw [without dd-maker]
MC gamma-jet and QCD background shower shapes respectively
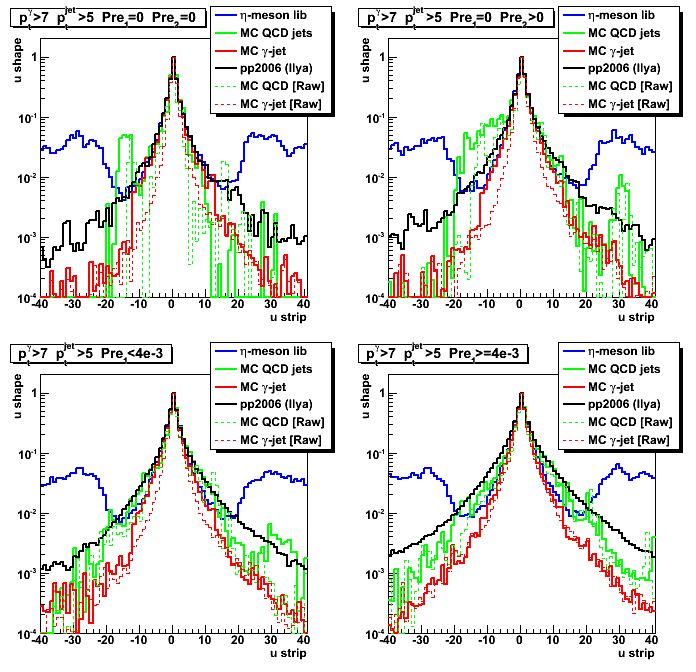
Figure 4: Shower shapes for v-plane [expanded to 40 strips]
2008.08.19 Shower shape from pp2008 vs pp2006 data
Ilya Selyuzhenkov August 19, 2008
Data sets:
- pp2006 - STAR 2006 ppProductionLong data (~ 3.164 pb^1)
"eemc-http-mb-l2gamma" trigger after applying gamma-jet isolation cuts. - pp2008 - STAR ppProduction2008 (~ 5.9M events)
"fmsslow" trigger after applying gamma-jet isolation cuts.
[Only ~13 candidates has been selected before pt-cuts] - gamma-jet - data-driven Pythia gamma-jet sample (~170K events). Partonic pt range 5-35 GeV.
- QCD jets - data-driven Pythia QCD jets sample (~4M events). Partonic pt range 3-65 GeV.
Note: Due to lack of statistics for 2008 data, no pt cuts applied on gamma-jet candidates for both 2006 and 2008 date.
Figure 1: Shower shapes for u-plane [pp2006 data: eemc-http-mb-l2gamma trigger]
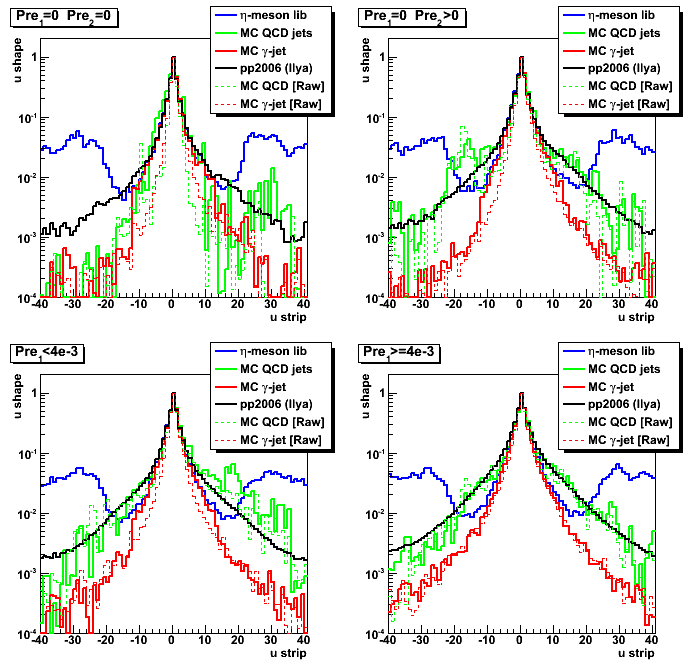
Figure 2: Shower shapes for v-plane [pp2006 data: eemc-http-mb-l2gamma trigger]
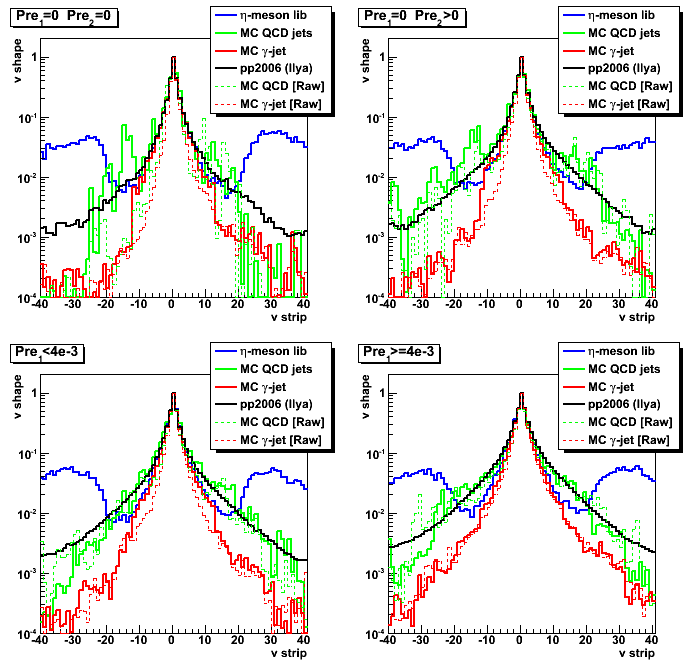
Figure 3: Shower shapes for u-plane [pp2008 data: fmsslow trigger]
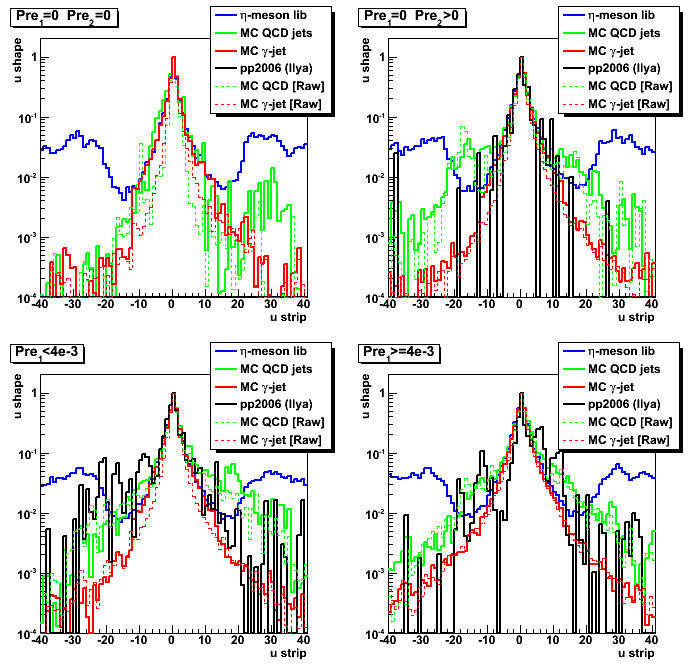
Figure 4: Shower shapes for v-plane [pp2008 data: fmsslow trigger]
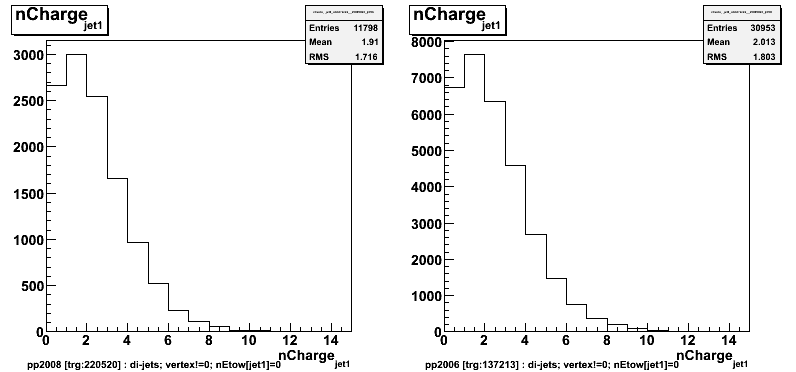
2008.08.25 di-jets from pp2008 vs pp2006 data
Ilya Selyuzhenkov August 25, 2008
Data sets:
- pp2006 - ppProductionLong [triggerId:137213] (day 136 only)
- pp2008 - ppProduction2008 [triggerId:220520] (Jan's set of MuDst from day 047)
Event selection:
- Run jet finder and select only di-jet events [adopt jet-finder script from Murad's analysis]
- Define jet1 as the jet with largest neutral energy fraction (NEF), and jet2 - the jet with a smaller NEF
- Require no EEMC towers associated with jet1
- Select trigger (see above) and require vertex to be found
Figure 1: Vertex z distribution (left: pp2008; right: 2006 data)
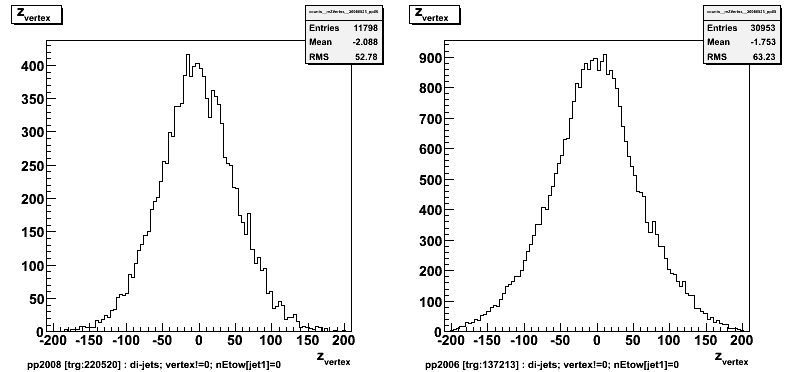
Figure 2: eta vs. phi distribution for the jet1 (jet with largest NEF) .
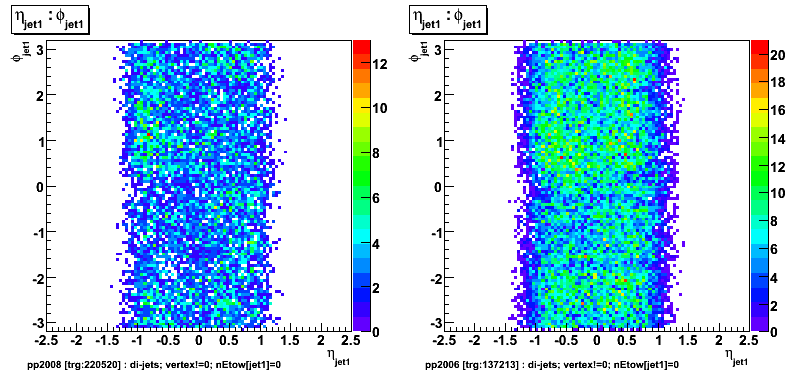
Figure 3: eta vs. z-vertex distribution for the jet1 (jet with largest NEF) .
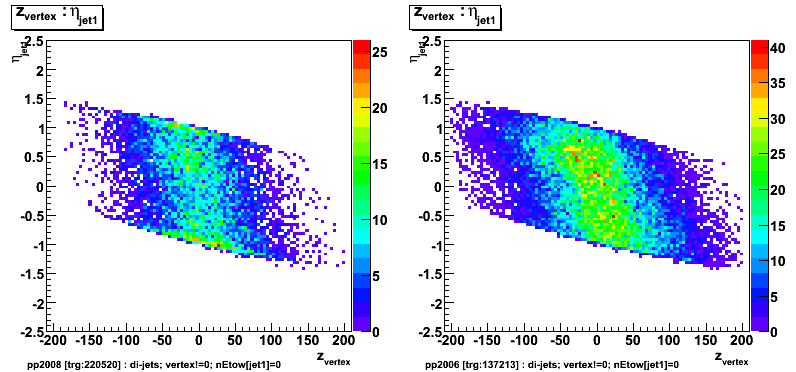
Figure 4: eta vs. z-vertex distribution for the second jet.
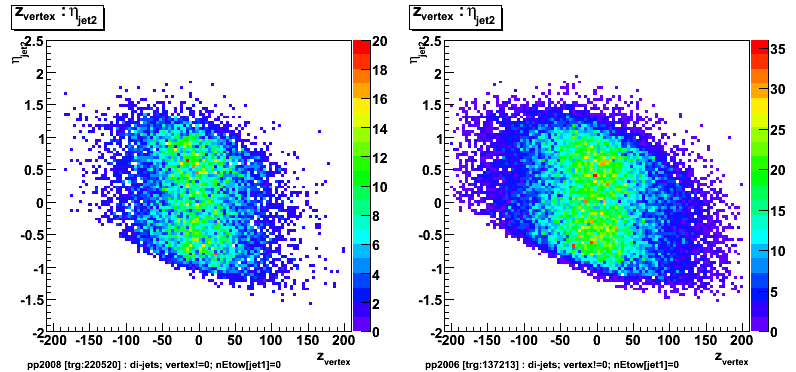
Figure 5: Transverse momentum distribution for jet1.
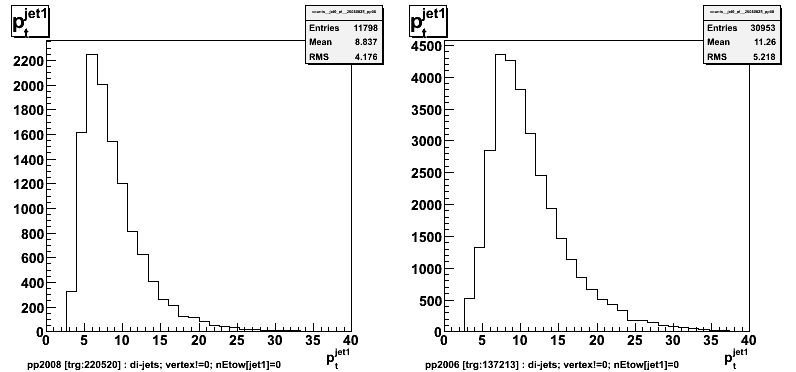
Figure 6: Number of barrel towers associated with jet1.
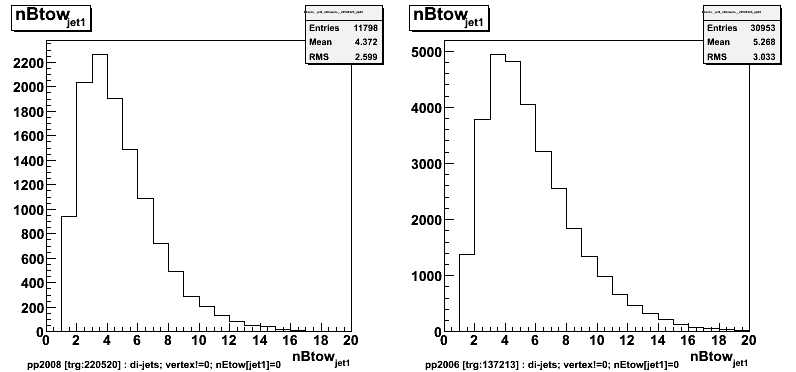
Figure 7: Number of charge tracks associated with jet1.
2008.08.26 Shower shape: more constrains for pre1>4E-3 bin
Ilya Selyuzhenkov August 26, 2008
Data sets:
- pp2006 - STAR 2006 pp longitudinal data (~ 3.164 pb^1) after applying gamma-jet isolation cuts.
- gamma-jet - data-driven Pythia gamma-jet sample (~170K events). Partonic pt range 5-35 GeV.
- QCD jets - data-driven Pythia QCD jets sample (~4M events). Partonic pt range 3-65 GeV.
Data-driven library:
- Four pre-shower bins: pre1,2=0, pre1=0,pre2>0 pre1<4MeV, pre1>=4MeV
- plus two energy bins (E<8GeV, E>=8GeV)
Figure 1: Pre-shower1 energy distribution for Pre1>4 MeV:
Eta meson library for E>8GeV bin [left] and data vs. MC results [right].
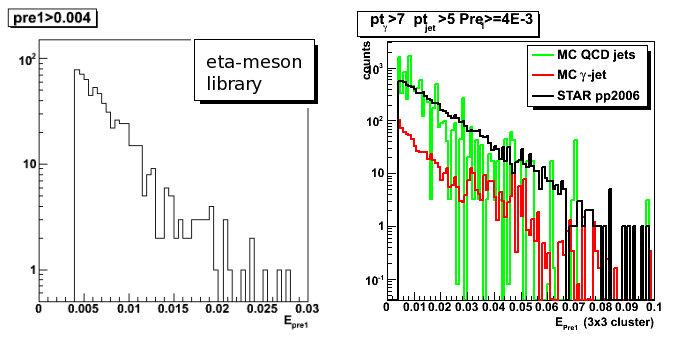
Figure 2: Shower shapes for v-plane [Pre1<10MeV cut]
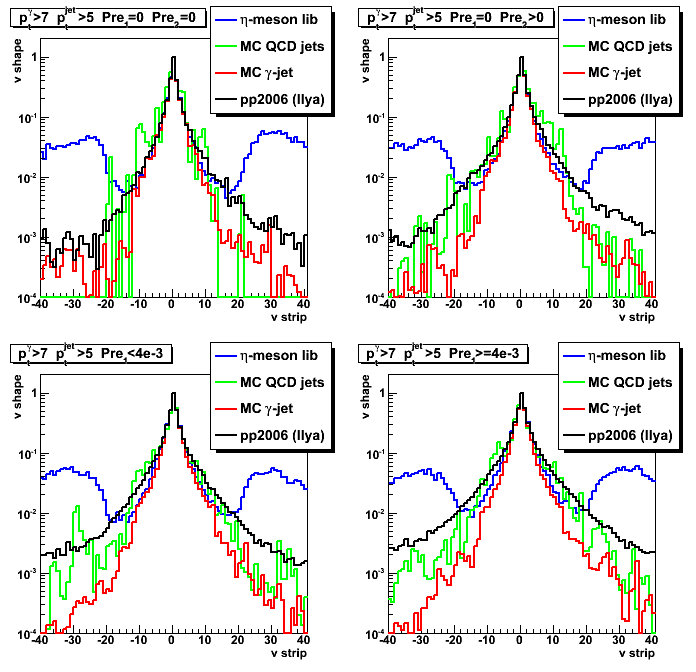
Figure 3: Shower shapes for u-plane [Pre1<10MeV cut]
Maximum side residual plots
Definitions for side residual plot (F_peak, F_tal, D_tail) can be found here
For a moment same 3-gaussian shape is used to fit SMD response for all pre-shower bins.
Algo needs to be updated with a new shapes sorted by pre-shower bins.
Figure 4: Sided residual plot for pp2006 data only [Pre1<10MeV cut]
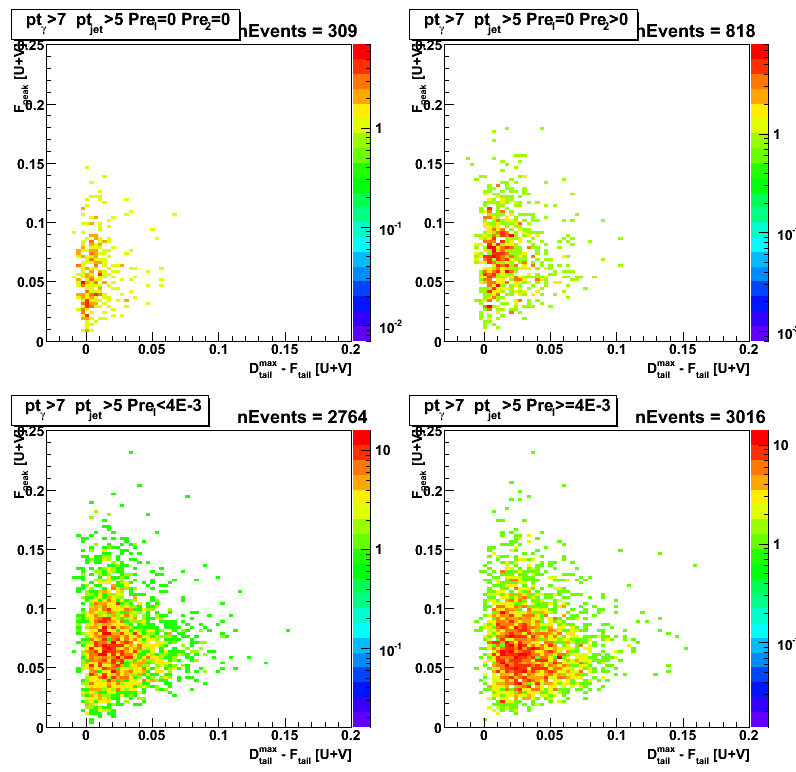
Figure 5: Sided residual projection on "Fitted Peak" axis [Pre1<10MeV cut]
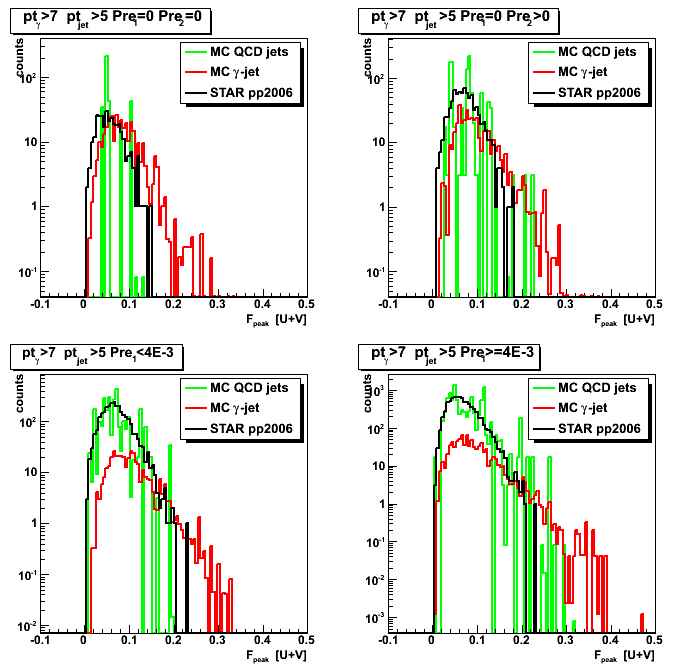
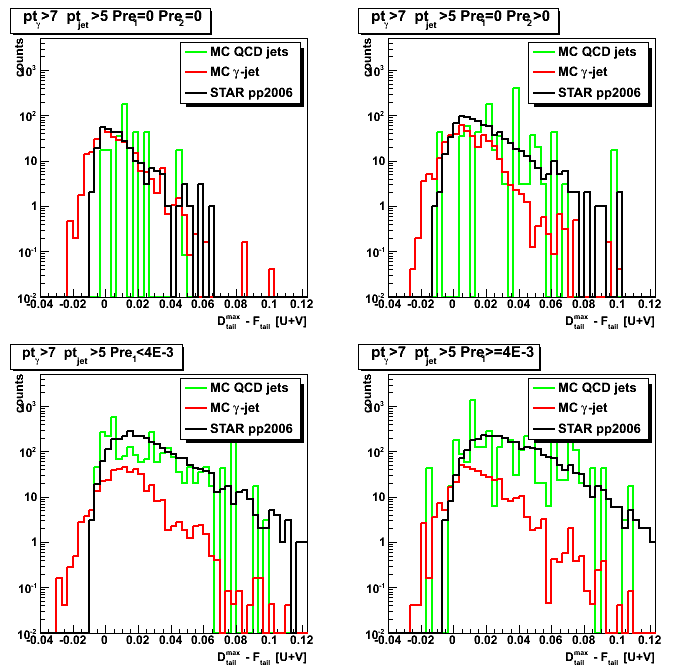
Figure 6: Sided residual projection on "tail difference" axis [Pre1<10MeV cut]
2008.08.27 Gamma-jet candidates detector position for different pre-shower conditions
Ilya Selyuzhenkov August 27, 2008
Data sets:
- pp2006 - STAR 2006 pp longitudinal data (~ 3.164 pb^1) after applying gamma-jet isolation cuts.
- gamma-jet - data-driven Pythia gamma-jet sample (~170K events). Partonic pt range 5-35 GeV.
- QCD jets - data-driven Pythia QCD jets sample (~4M events). Partonic pt range 3-65 GeV.
Figure 1: High u vs. v strip id distribution for different pre-shower conditions.
Left column: QCD jets, middle column: gamma-jet, right columnt: pp2006 data
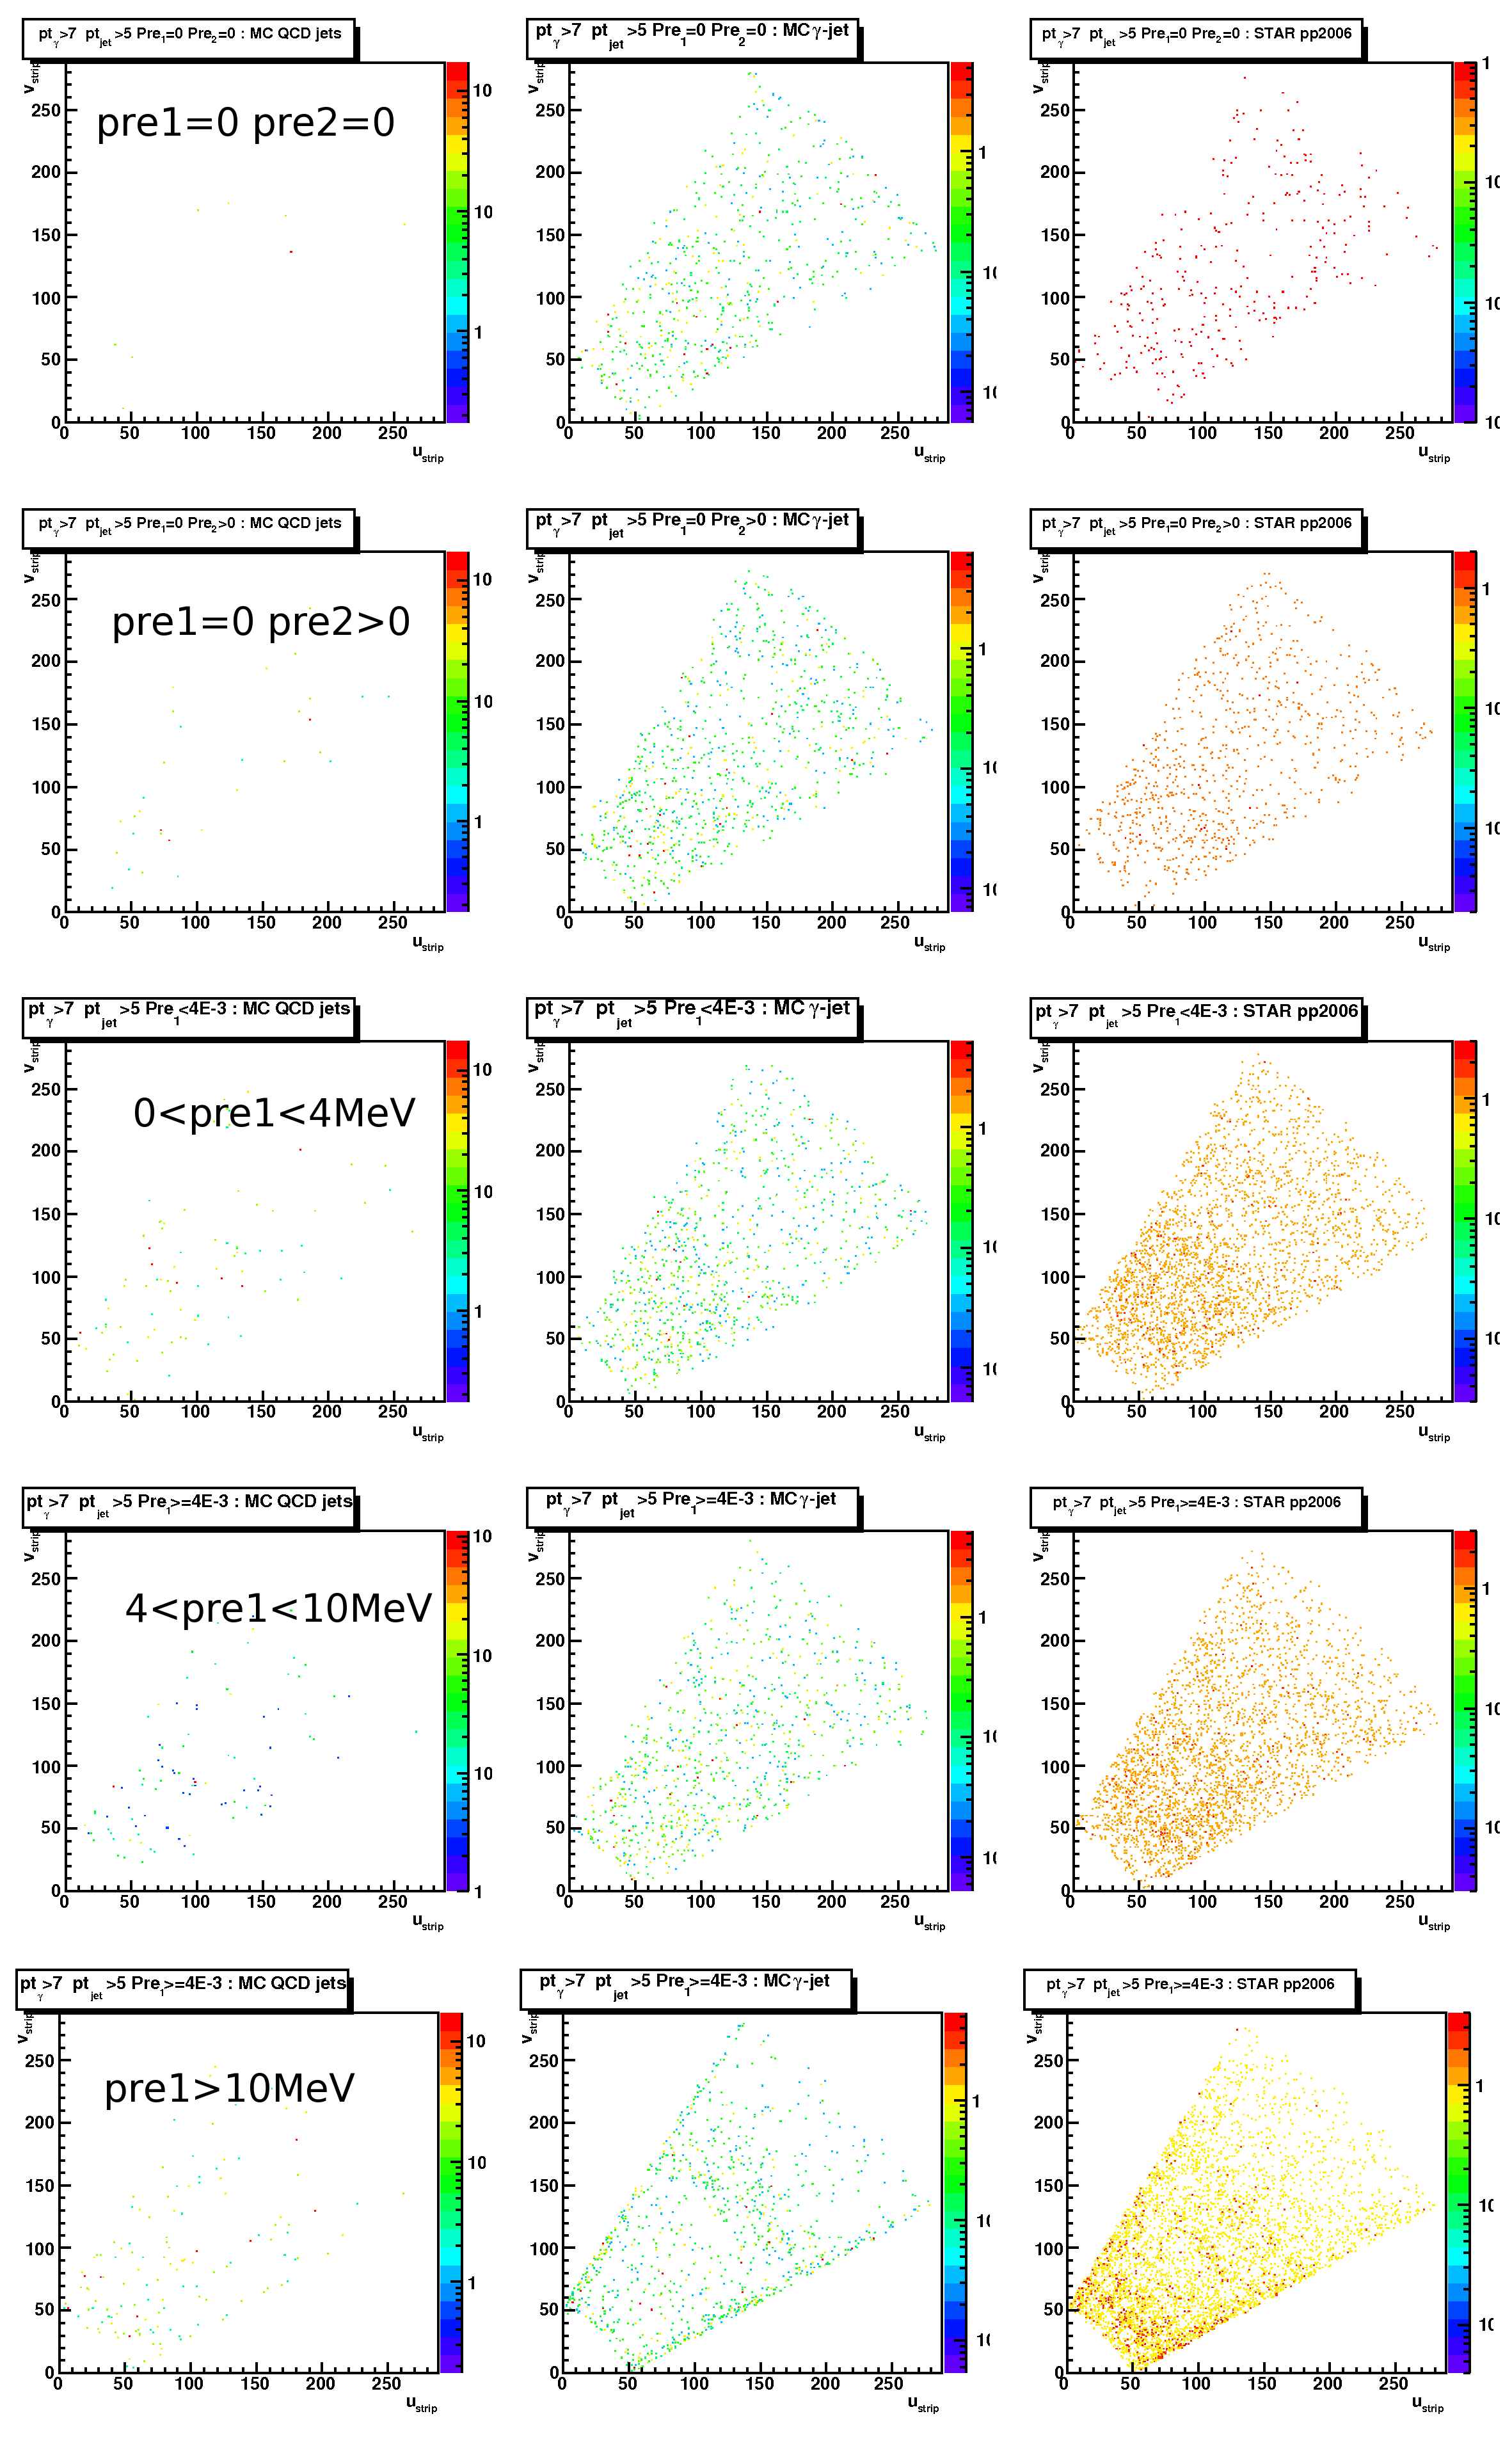
Figure 2: x vs. y position of the gamma-candidate within EEMC detector
for different pre-shower conditions.
Left column: QCD jets, middle column: gamma-jet, right columnt: pp2006 data
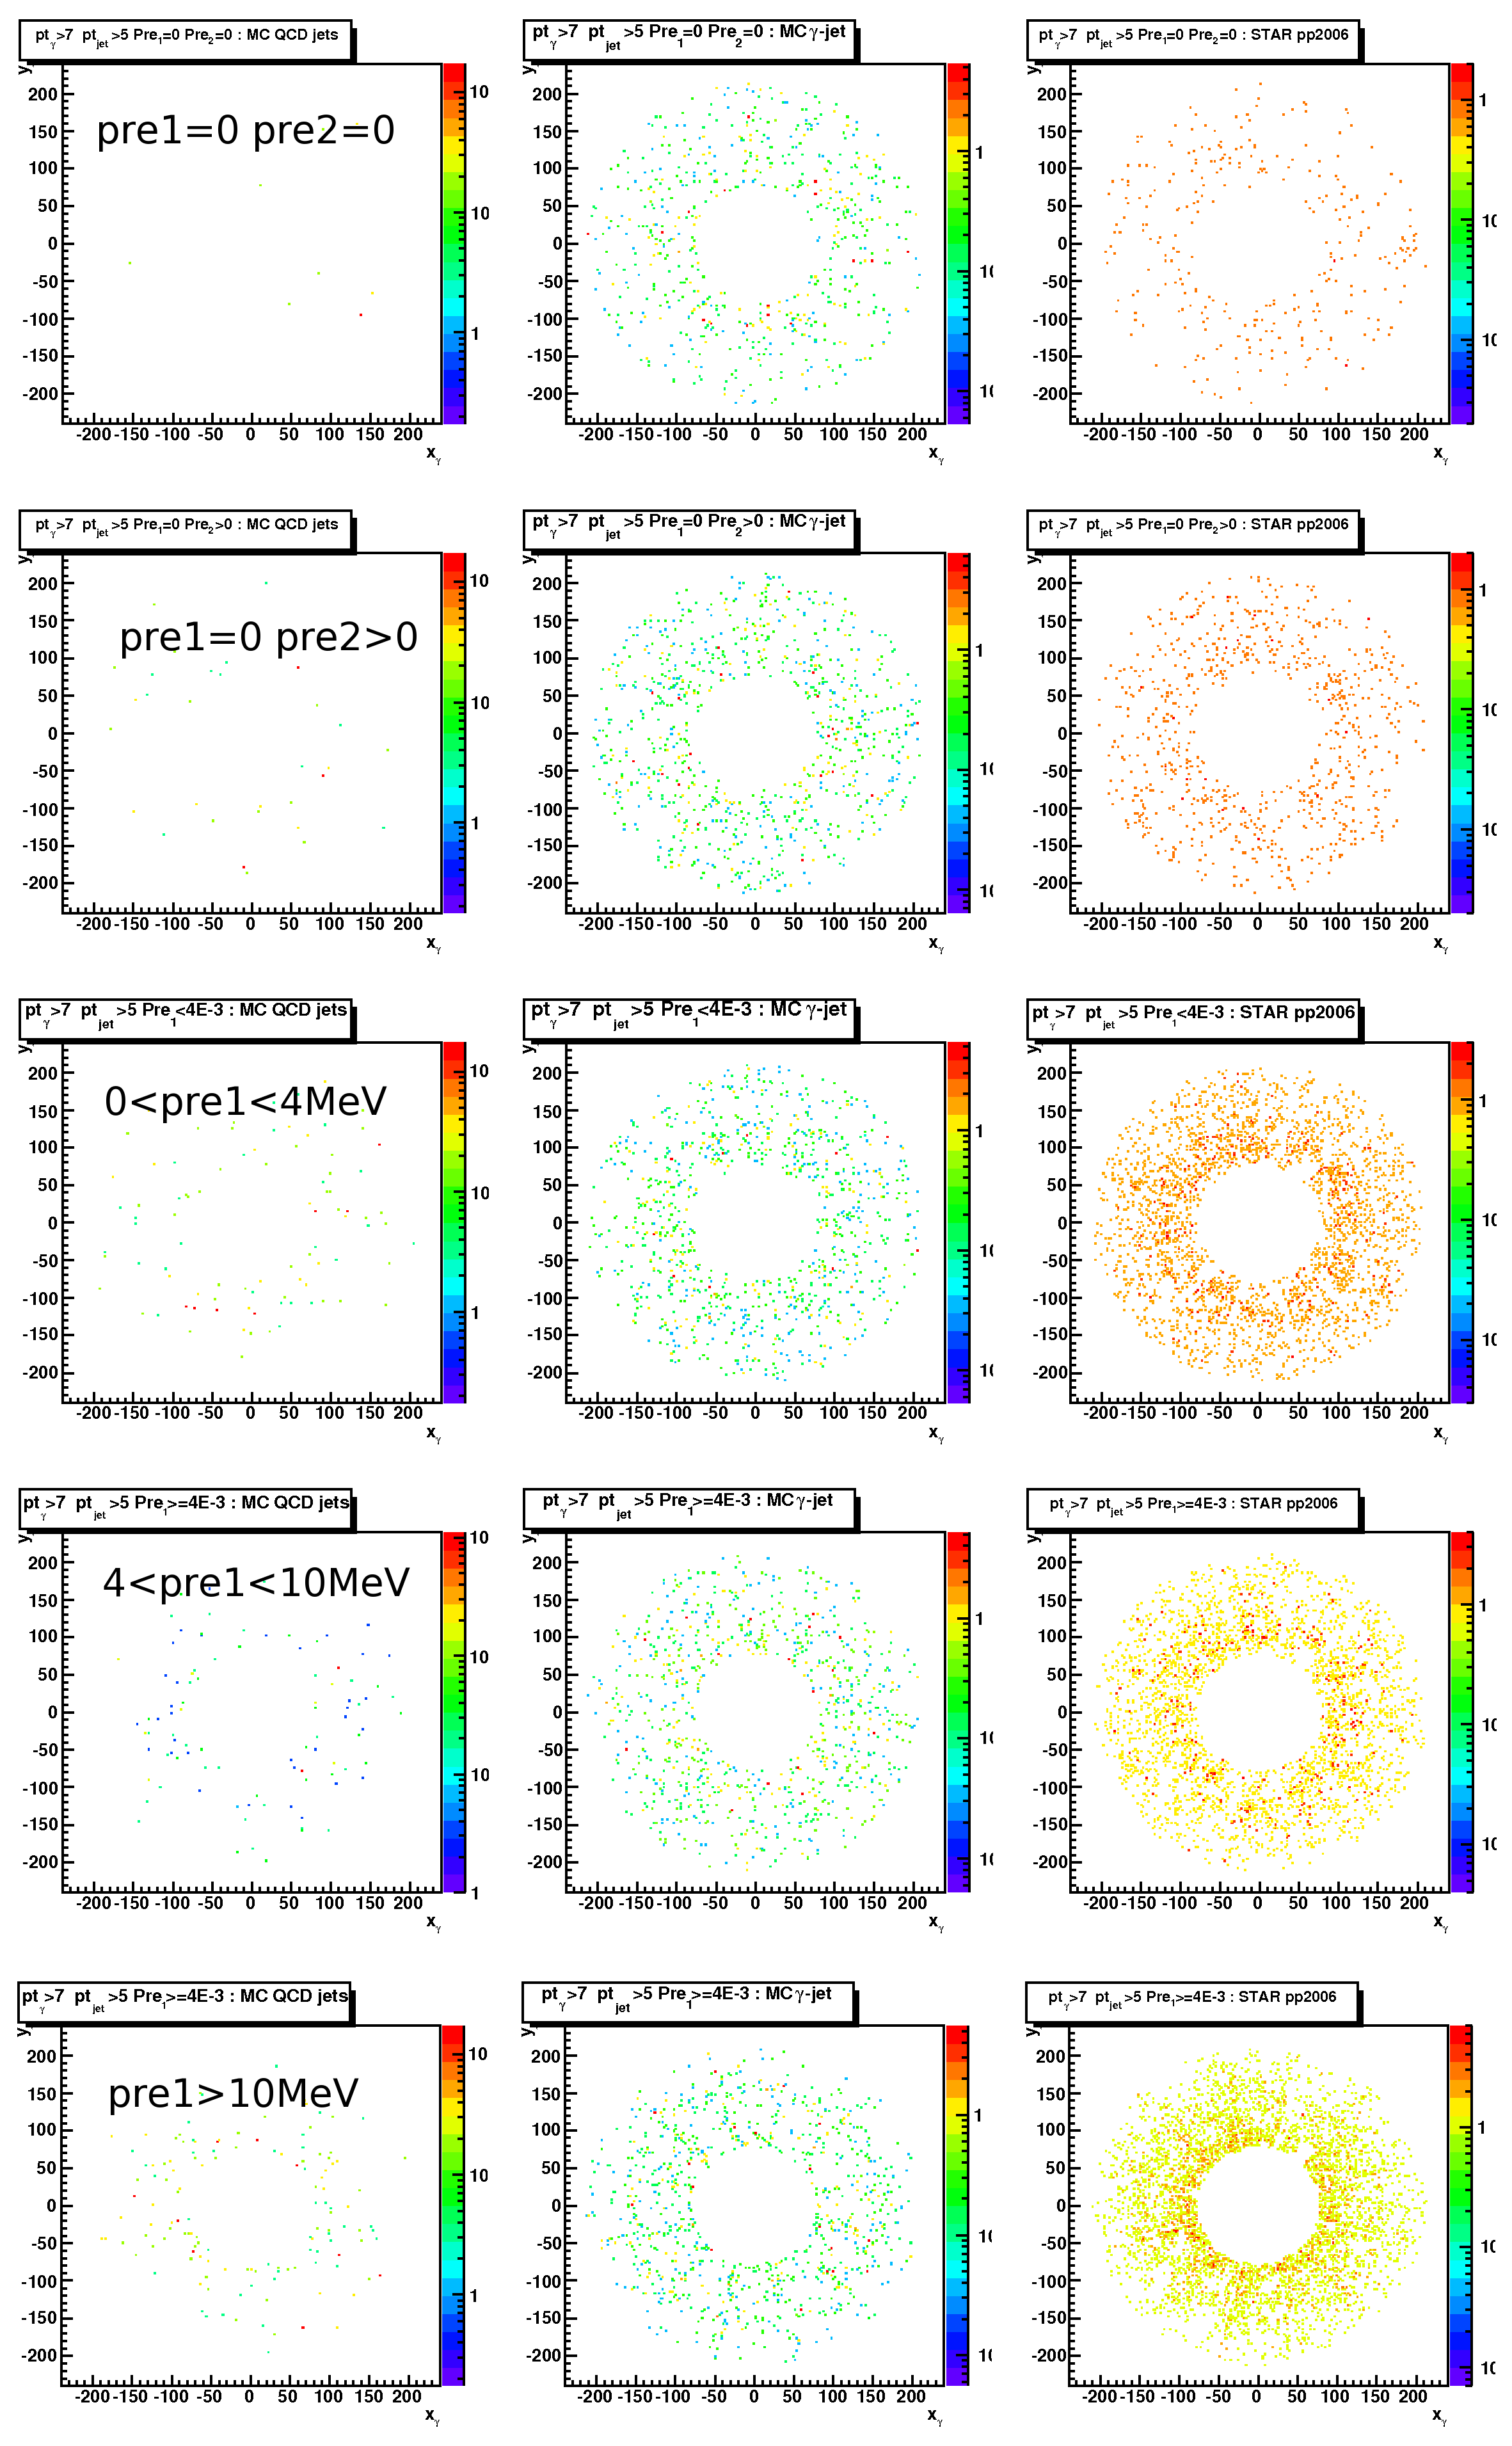
Figure 3:Reconstructed vs. generated (from geant record) gamma pt for the MC gamma-jet sample.
Pre-shower1<10MeV cut applied.
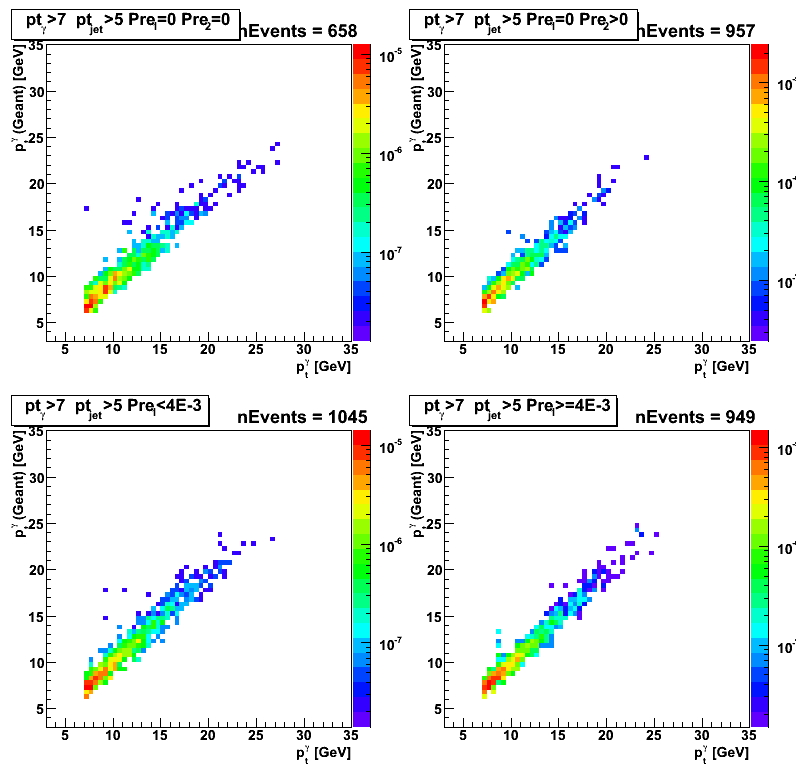
Figure 4:Reconstructed vs. generated (from geant record) gamma eta for the MC gamma-jet sample.
Pre-shower1<10MeV cut applied.
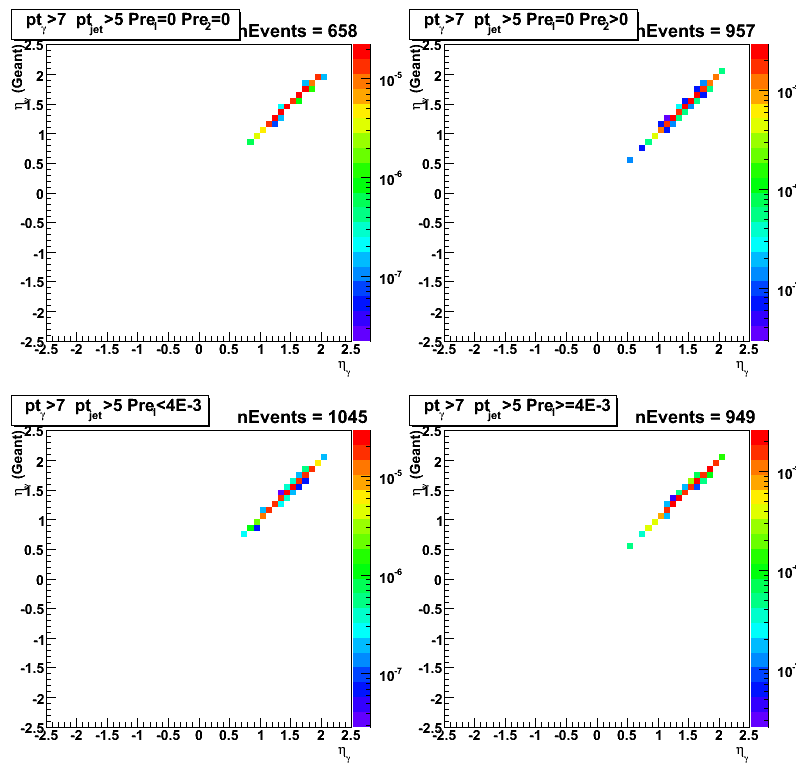
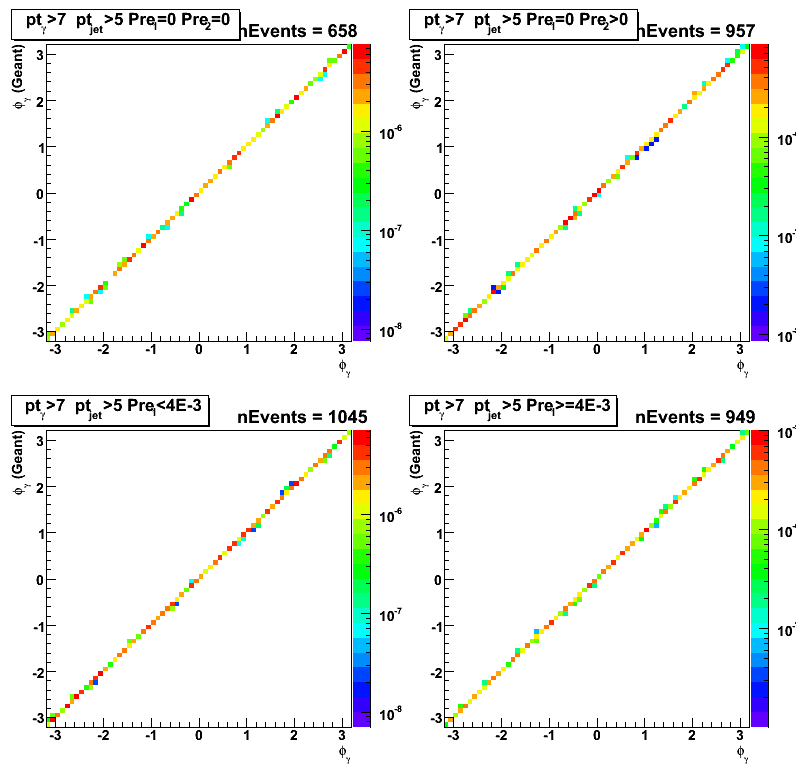
Figure 5:Reconstructed vs. generated (from geant record) gamma phi for the MC gamma-jet sample.
Pre-shower1<10MeV cut applied.