2008.09.09 Maximum sided residual with shower shapes sorted by uv- and pre-shower bins
Ilya Selyuzhenkov September 09, 2008
Data sets:
- pp2006 - STAR 2006 pp longitudinal data (~ 3.164 pb^1) after applying gamma-jet isolation cuts.
- gamma-jet - data-driven Pythia gamma-jet sample (~170K events). Partonic pt range 5-35 GeV.
- QCD jets - data-driven Pythia QCD jets sample (~4M events). Partonic pt range 3-65 GeV.
Procedure to calculate maximum sided residual:
-
For each event fit SMD u and v energy distributions with
triple Gaussian functions from shower shapes analysis:[0]*(exp(-0.5*((x-[1])/[2])**2)+[3]*exp(-0.5*((x-[1])/[4])**2)+[6]*exp(-0.5*((x-[1])/[5])**2))
Fit parameters sorted by various pre-shower conditions and u and v-planes can be found here
There are only two free parameters in a final fit: overall amplitude [0] and mean value [1]
Fit range is +-2 strips from the high strip (5 strips total). -
Integrate energy from a fit within +-2 strips from high strip.
This is our peak energy from fit, F_peak. -
Calculate tail energies on left and right sides from the peak for both data, D_tail, and fit, F_tail.
Tails are integrated up to 30 strips excluding 5 highest strips.
Determine maximum difference between D_tail and F_tail:
max(D_tail-F_tail). This is our maximum sided residual. -
Plot F_peak vs. max(D_tail-F_tail). This is sided residual plot.
-
(implementation for this item is in progress)
Based on MC gamma-jet sided residual plot find a line (some polynomial function)
which will serve as a cut to separate signal and background.
Use that cut line to calculate signal to background ratio
and apply it for the real data analysis.
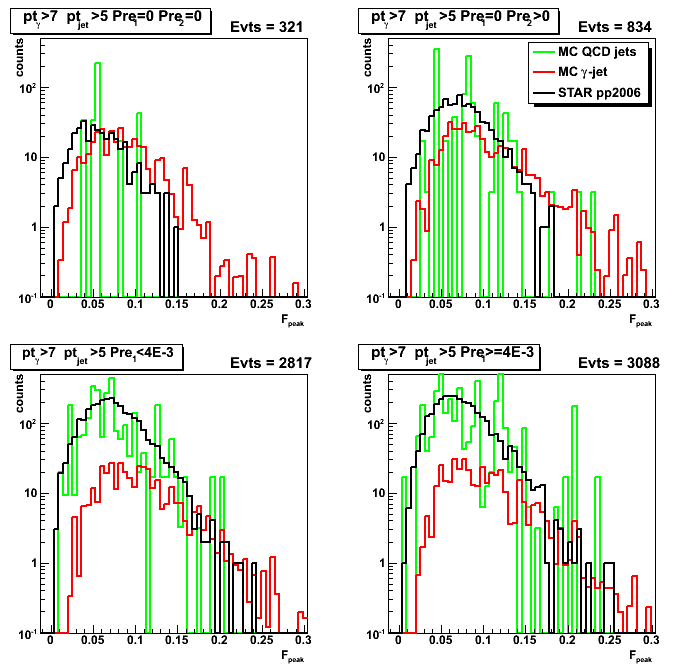
Figure 1: Maximum sided residual plots for different data sets and various pre-shower condition.
Columns [data sets]: 1. MC QCD background; 2. gamma-jet; 3. pp2006 data
Rows [pre-shower bins]: 1. pre1=0 pre2=0; 2. pre1=0, pre2>0; 3. 0<pre1<4MeV; 4. 4<pre1<10MeV
Results from u and v plane are combined as [U+V]/2
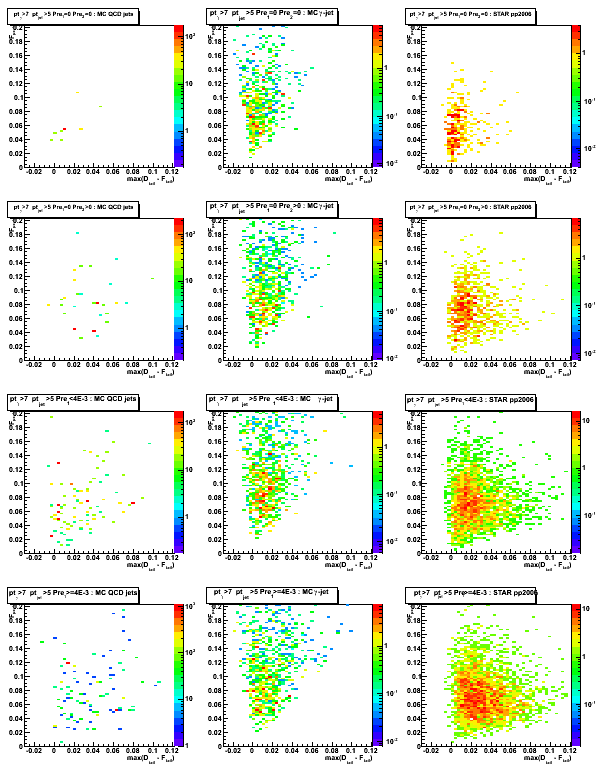
Figure 2: max(D_tail-F_tail) distribution (projection on horizontal axis from Fig.1)
Some observations:
Results for pp2006 and MC gamma-jet are consistent for pre1=0 pre2=0 case (upper left plot)
Results for pp2006 and MC QCD background jets are also in agrees for pre1>0 case (lower left and right plots)
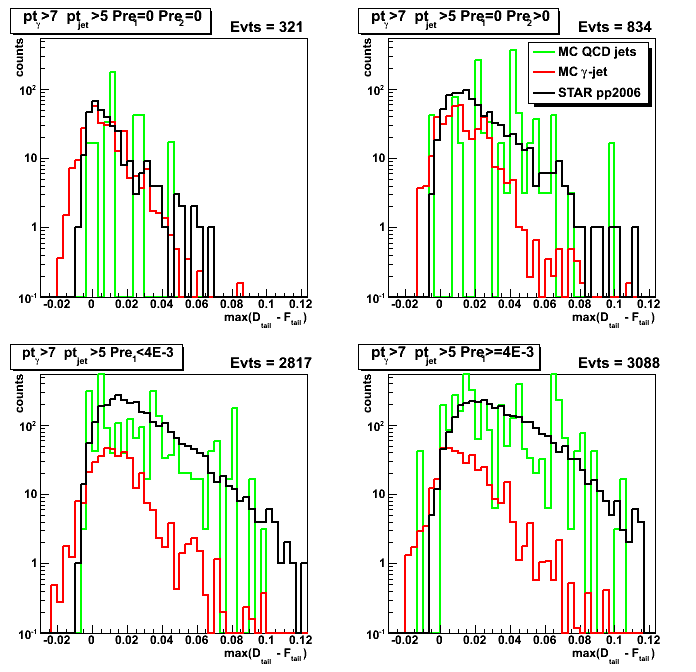
Figure 3: F_peak distribution (projection on vertical axis from Fig.1)