10 Oct
October 2008 posts
2008.10.13 Jet trees for Michael's gamma filtered events
Ilya Selyuzhenkov October 13, 2008
I have finished production of jet trees for Michael's gamma filtered events
You can find jet and skim file lists in my directory at IUCF disk (RCF):
- Jet trees: /star/institutions/iucf/IlyaSelyuzhenkov/simu/JetTrees/JetTrees.list
- Skim trees: /star/institutions/iucf/IlyaSelyuzhenkov/simu/JetTrees/SkimTrees.list
- Log files: /star/institutions/iucf/IlyaSelyuzhenkov/simu/JetTrees/LogFiles.list
Number of jet events is 1284581 (1020 files).
Production size, including archived log files, is 4.0G.
The script to run jet finder:
/star/institutions/iucf/IlyaSelyuzhenkov/simu/JetTrees/20081008_gJet/StRoot/macros/RunJetSimuSkimFinder.C
JetFinder and JetMaker code:
/star/institutions/iucf/IlyaSelyuzhenkov/simu/JetTrees/20081008_gJet/StRoot/StJetFinder
/star/institutions/iucf/IlyaSelyuzhenkov/simu/JetTrees/20081008_gJet/StRoot/StJetMaker
For more details see these threads of discussions:
- jetfinding list: thread 814
- photon reconstruction list: thread 271 and thread 256
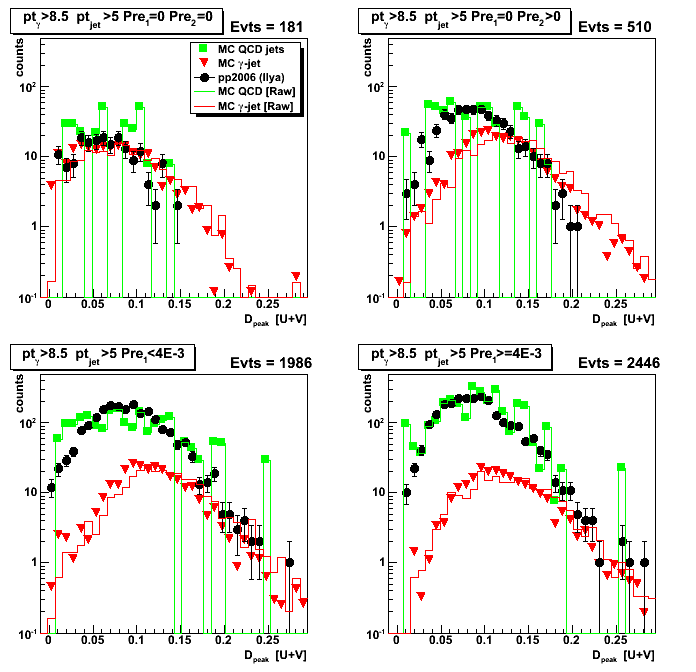
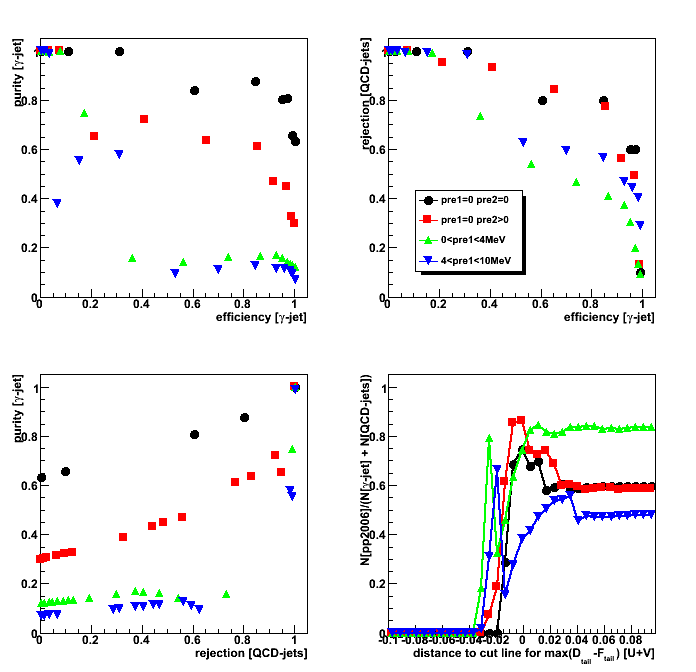
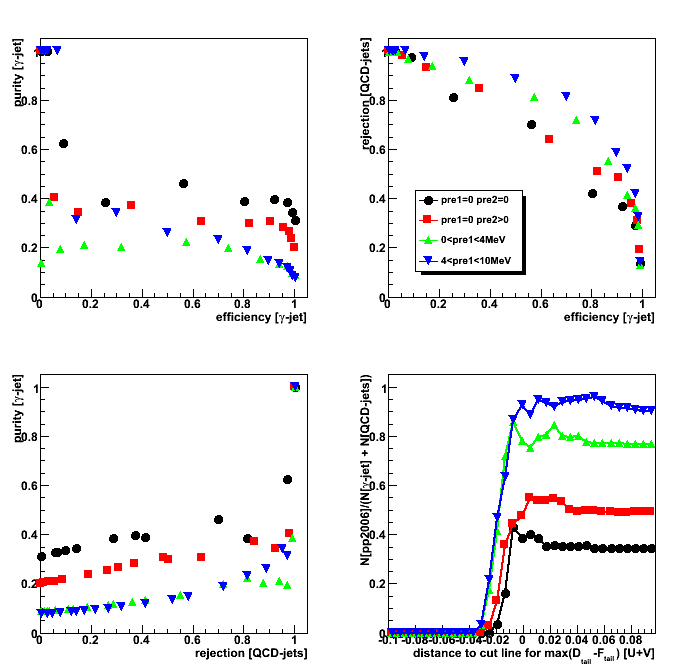
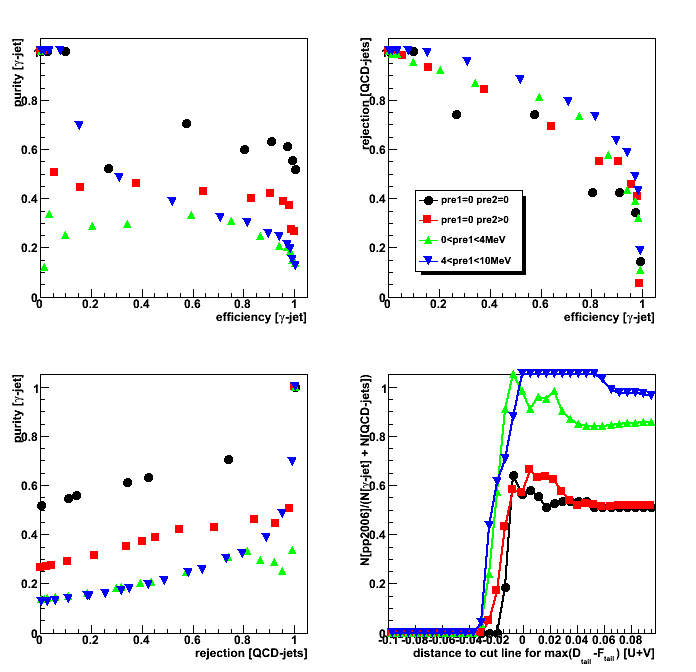
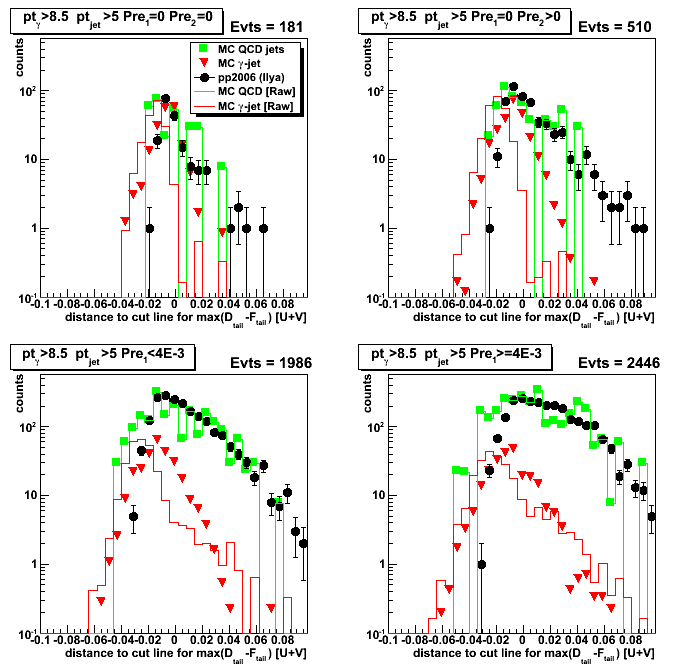
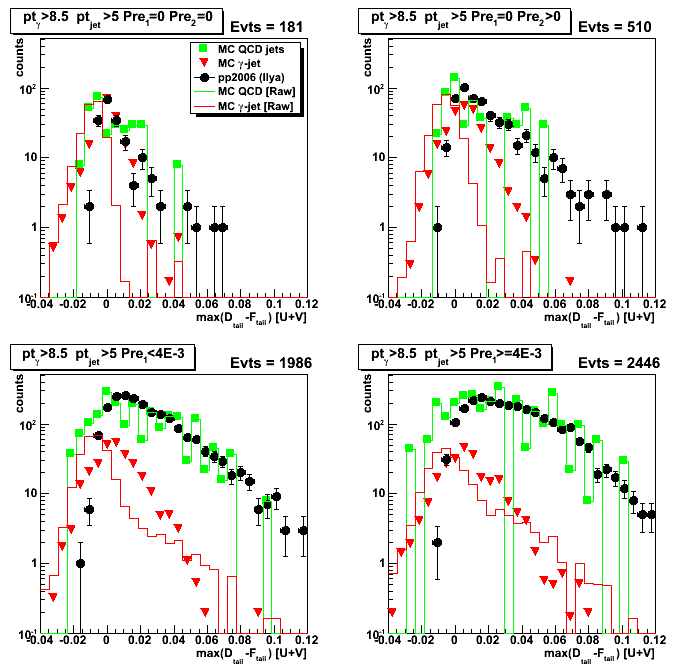
2008.10.14 Purity, efficiency, and background rejection: R_cluster > 0.98
Ilya Selyuzhenkov October 14, 2008
Data sets:
- pp2006 - STAR 2006 pp longitudinal data (~ 3.164 pb^1)
after applying gamma-jet isolation cuts (note: R_cluster > 0.98 is used below). - gamma-jet - data-driven Pythia gamma-jet sample (~170K events). Partonic pt range 5-35 GeV.
- QCD jets - data-driven Pythia QCD jets sample (~4M events). Partonic pt range 3-65 GeV.
Figure 1: Horizontal distance from 4th order polynomial function to max(D_tail-F_tail)
See this page for definition and more details
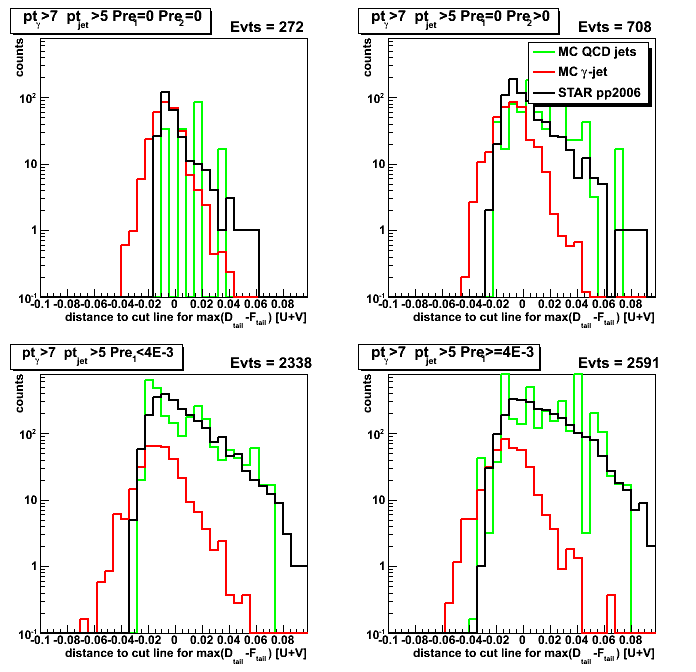
Figure 2:
purity[g-jet] vs. efficiency[g-jet] (upper left);
rejection[QCD] vs. efficiency[g-jet] (upper right);
purity[g-jet] vs. rejection[QCD] (lower left);
pp2006 to MC ratio, N[pp2006]/(N[g-jet]+N[QCD]), vs. horizontal distance (lower right)
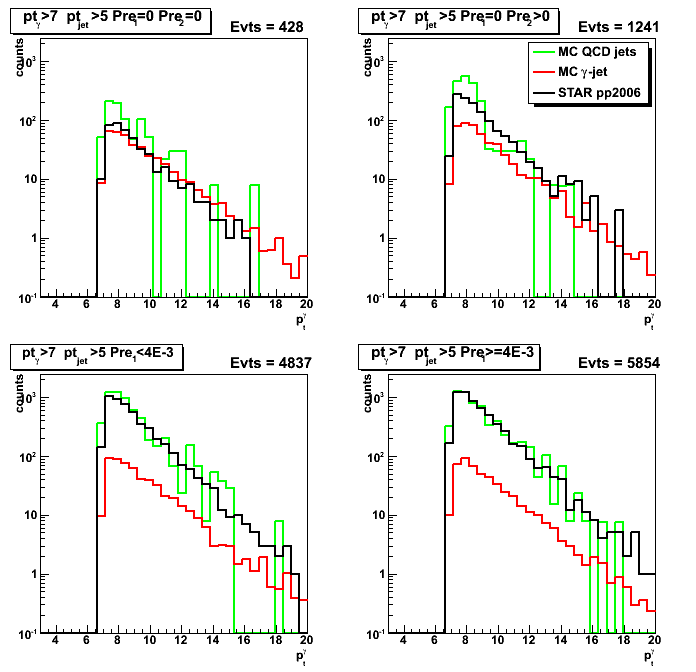
2008.10.15 Comparison of gamma-jets from Michael's filtered events vs. old MC samples
Ilya Selyuzhenkov October 15, 2008
Data sets:
- pp2006 - STAR 2006 pp longitudinal data (~ 3.164 pb^1)
after applying gamma-jet isolation cuts (note: R_cluster > 0.9 is used below). - gamma-jet[gamma-filtered] - data-driven Prompt Photon [p6410EemcGammaFilter] events.
Partonic pt range 2-25 GeV. - QCD jets[gamma-filtered] - data-driven QCD [p6410EemcGammaFilter] events.
Partonic pt range 2-25 GeV. - gamma-jet [old] - data-driven Pythia gamma-jet sample (~170K events).
Partonic pt range 5-35 GeV.
Details on jet trees production for Michael's gamma filtered events can be found here. - QCD jets [old] - data-driven Pythia QCD jets sample (~4M events).
Partonic pt range 3-65 GeV.
Some observations:
- Both Fig. 1a vs. Fig. 1b shows good statistics for old and new (gamma-filtered) MC gamma-jet samples
- Fig. 1c shows poor statistics for QCD background sample
within partonic pt range 5-10GeV (only 3 counts for "pre1=0 & pre2=0" condition).
Fig. 1d (new QCD sample) has much more counts in the same region,
but it is still only 20-25 entries for the case when
none of EEMC pre-shower layers fired (upper left corner - our purest gamma-jet sample).
This may be still insufficient for a various cuts systematic study. - Fig. 2 and Fig. 3 shows nice agreement between data and MC
for both old and new (gamma-filtered) MC samples.
For pre-shower1>0 case this agreement persists across full range of gamma's pt (7GeV and above).
Upper plots in Fig. 3 shows some difference between data and Monte-Carlo,
what could be effect from l2gamma trigger,
which has not been yet applied for MC events.
Figure 1a: partonic pt for gamma-jet [old] events
after analysis cuts and partonic pt bin weighting
(Note:Arbitrary absolute scale)
Figure 1b: partonic pt for gamma-jet [gamma-filtered] events after analysis cuts.
Michael's StBetaWeightCalculator has been used to caclulate partonic pt weights
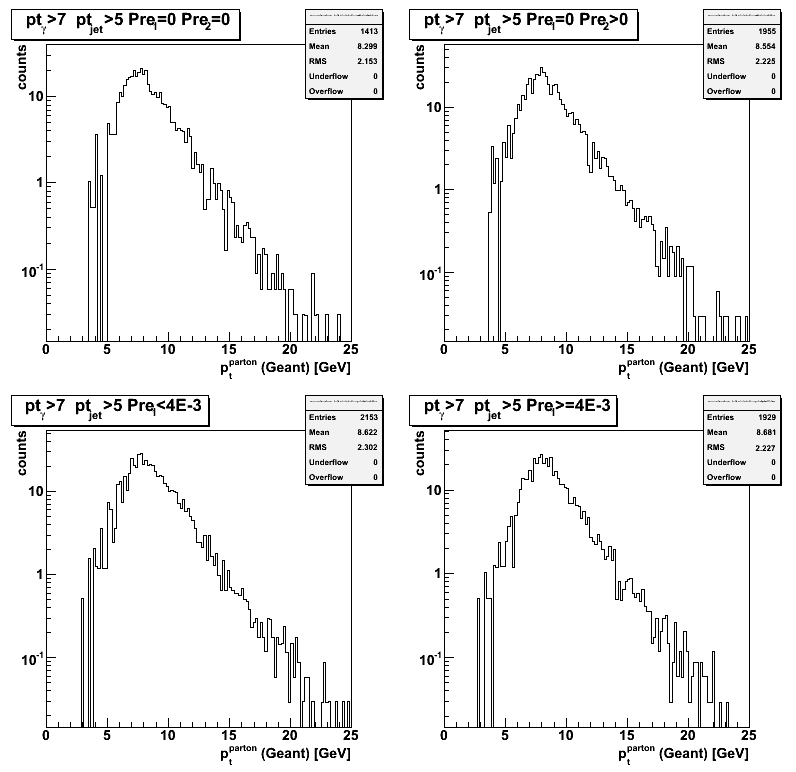
Figure 1c: partonic pt for QCD jets [old] events
after analysis cuts and partonic pt bin weighting
(Note:Arbitrary absolute scale)
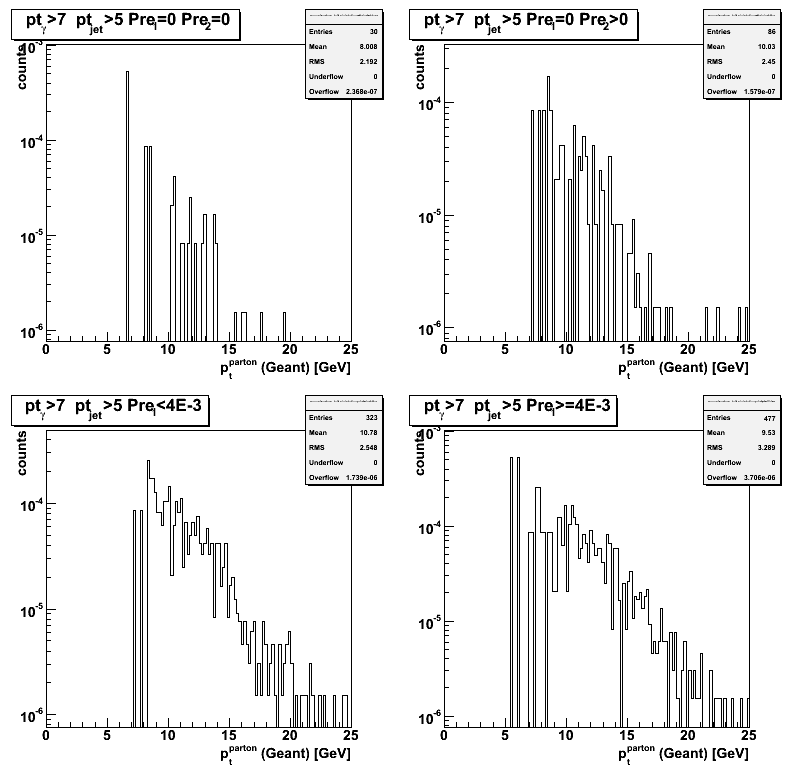
Figure 1d: partonic pt for QCD jets [gamma-filtered] events after analysis cuts.
Michael's StBetaWeightCalculator has been used to caclulate partonic pt weights
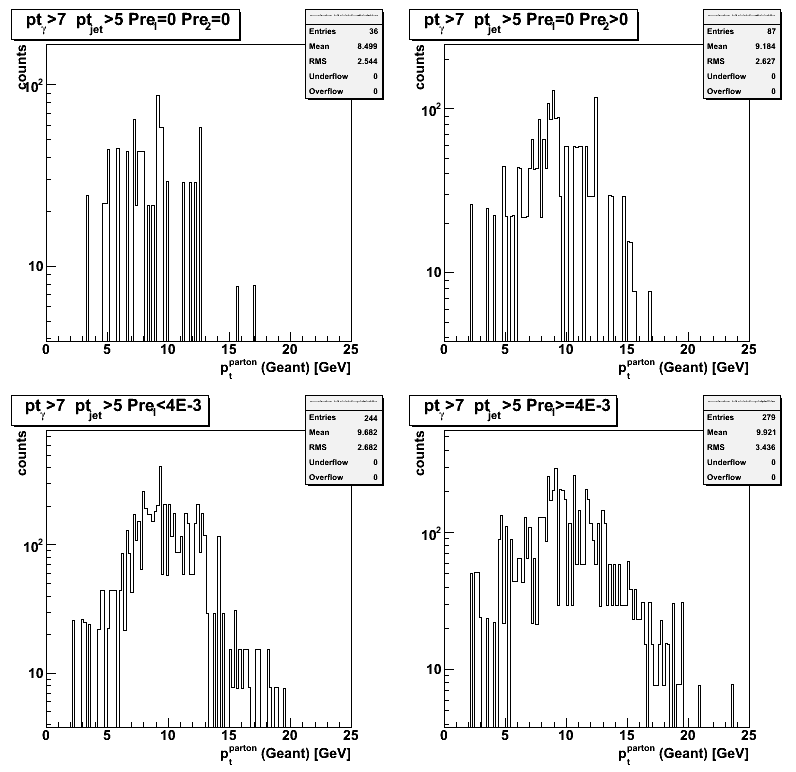
Figure 2: reconstructed gamma pt: old MC vs. pp2006 data (scaled to the same luminosity)

Figure 3: reconstructed gamma pt: gamma-filtered MC vs. pp2006 data (scaled to the same luminosity)
2008.10.15 Purity vs. efficiency from gamma-filtered events: R_cluster > 0.9 vs. R_cluster > 0.98
Ilya Selyuzhenkov October 15, 2008
Data sets:
- pp2006 - STAR 2006 pp longitudinal data (~ 3.164 pb^1)
after applying gamma-jet isolation cuts (note: R_cluster > 0.9 or > 0.98 is used below). - gamma-jet[gamma-filtered] - data-driven Prompt Photon [p6410EemcGammaFilter] events.
Partonic pt range 2-25 GeV. - QCD jets[gamma-filtered] - data-driven QCD [p6410EemcGammaFilter] events.
Partonic pt range 2-25 GeV.
Gamma-jet candidates from MC gamma filtered events: R_cluster > 0.9
Figure 1: Horizontal distance from sided residual plot: R_cluster > 0.9
(see Figs. 1-5 from this post for horizontal distance definition)
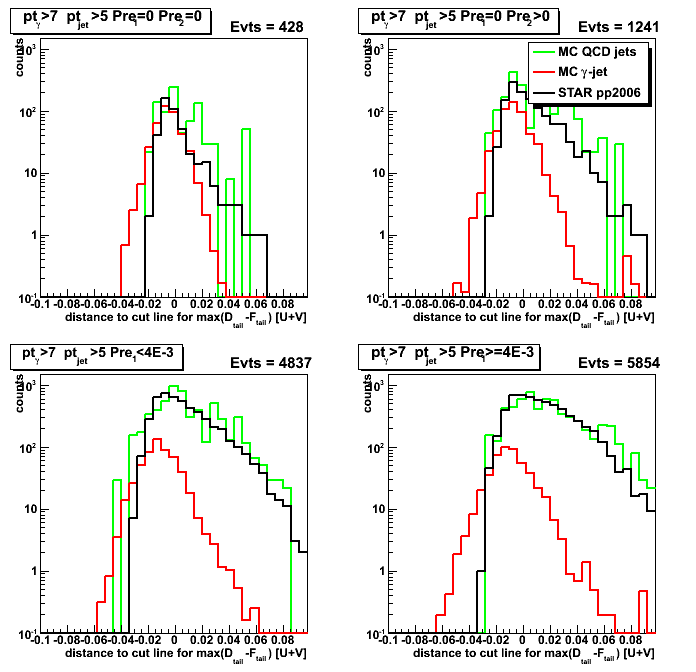
Figure 2: Purity/efficiency/rejection, and data to MC[gamma-jet+QCD] ratio plots: R_cluster > 0.9
(see text above Fig. 6 from this post for purity, efficiency, and background rejection definition)
Gamma-jet candidates from MC gamma filtered events: R_cluster > 0.98
Figure 3: Reconstructed gamma pt: R_cluster > 0.98
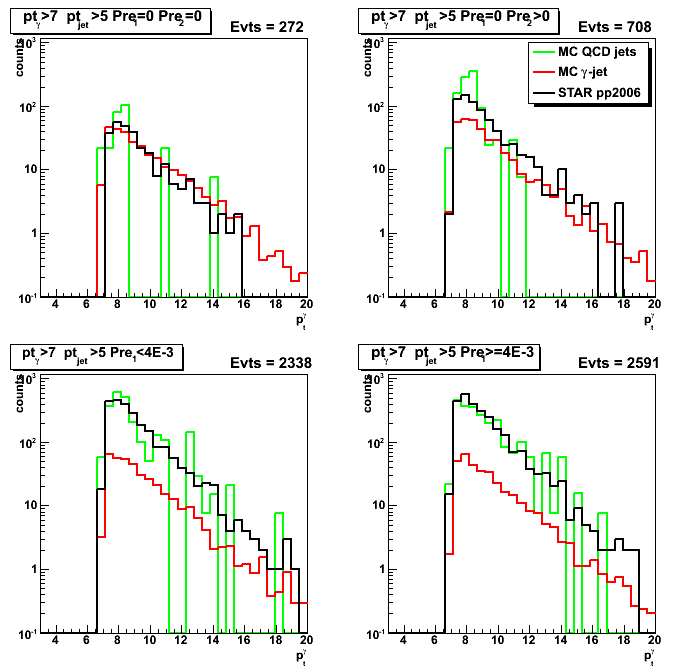
Figure 4: Horizontal distance from sided residual plot: R_cluster > 0.98
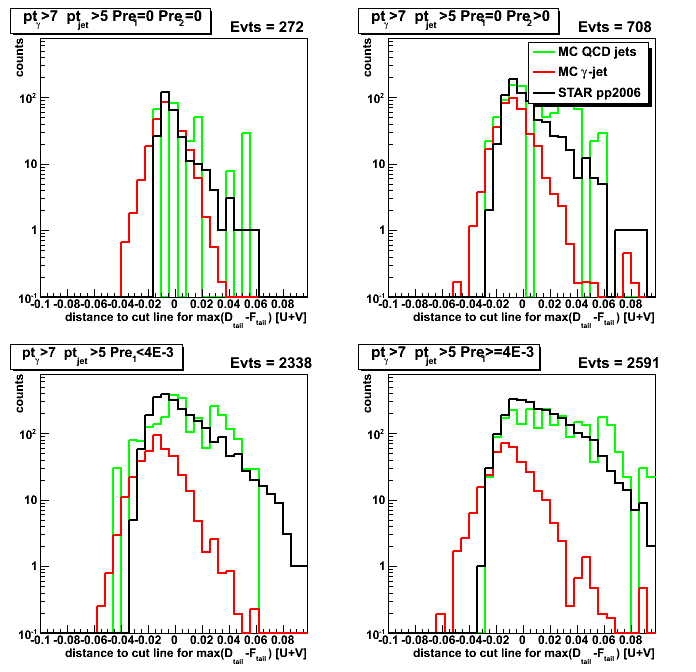
Figure 5: Purity/efficiency/rejection, and data to MC[gamma-jet+QCD] ratio plots: R_cluster > 0.98
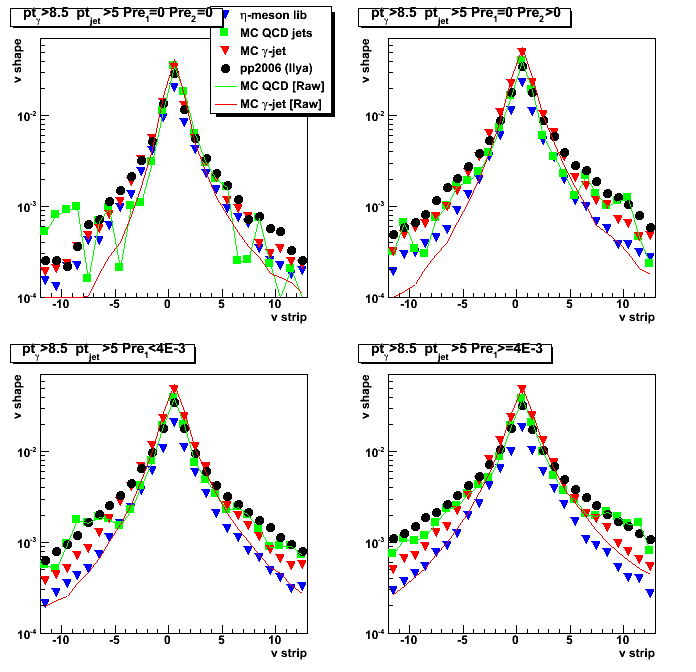
2008.10.21 Shower shapes, 5/25 strips cluster energy, raw vs. data-driven MC
Ilya Selyuzhenkov October 21, 2008
Data sets:
- pp2006 - STAR 2006 pp longitudinal data (~ 3.164 pb^1)
after applying gamma-jet isolation cuts (R_cluster > 0.9 is used below). - gamma-jet[gamma-filtered] - data-driven Prompt Photon [p6410EemcGammaFilter] events.
Partonic pt range 2-25 GeV. - QCD jets[gamma-filtered] - data-driven QCD [p6410EemcGammaFilter] events.
Partonic pt range 2-25 GeV.
Some comments:
- Overall comment: effect of data-driven shower shape replacement procedure
on QCD background events is small, except probably pre1=0 pre2=0 case. -
Fig. 1-3, upper left plots (pre1=0 pre2=0) show that
average energy per strip in data-driven gamma-jet MC (i.e. solid red square in Fig. 3)
is systematically higher than that for pp2006 data (black circles in Fig. 3).Note, that there is an agreement between SMD shower shapes
for pp2006 data and data-driven gamma-jet simulations
if one scales them to the same peak value
(Compare red vs. black in upper left plot from Fig. 1 at this link) -
Fig. 4, upper left plot (pre1=0 pre2=0):
Integrated SMD energy from 25 strips
in raw gamma-jet simulations (red line) match pp2006 data (black line)
in the region where signal to background ratio is high, E_smd(25-strips)>0.1GeV.
This indicates that raw MC does a good job in
reproducing total energy deposited by direct photon. -
Fig. 5, upper left plot (pre1=0 pre2=0):
There is mismatch between distributions of energy in 25 strips cluster
from data-driven gamma-jet simulations and pp2006 data.
This probably reflects the way we scale our library shower shapes
in data-driven shower shape replacement procedure.
Currently, the scaling factor for the library shape is calculated based on the ratio
of direct photon energy from Geant record to the energy of the library photon.
Our library is build out of photons from eta-meson decay,
which has been reconstructed by running pi0 finder.
The purity of the library is about 70% (see Fig. 1 at this post for more details).The improvement of scaling procedure could be to
preserve total SMD energy deposited within 25 strips from raw MC,
and use that energy to scale shower shapes from the library. -
Fig. 6, upper left plot (pre1=0 pre2=0):
Mismatch between integrated 5-strip energy for raw MC and pp2006 in Fig. 6
corresponds to "known" difference in shower shapes from raw Monte-Carlo and real data.
Figure 1: SMD shower shapes: data, raw, and data-driven MC (40 strips).
Vertical axis shows average energy per strip (no overall shower shapes scaling)
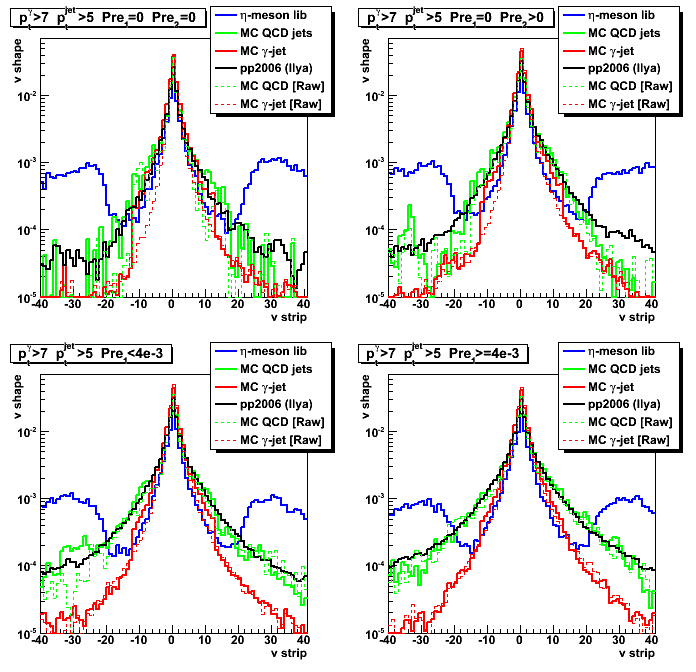
Figure 2: Shower shapes: data, raw, and data-driven MC (12 strips)
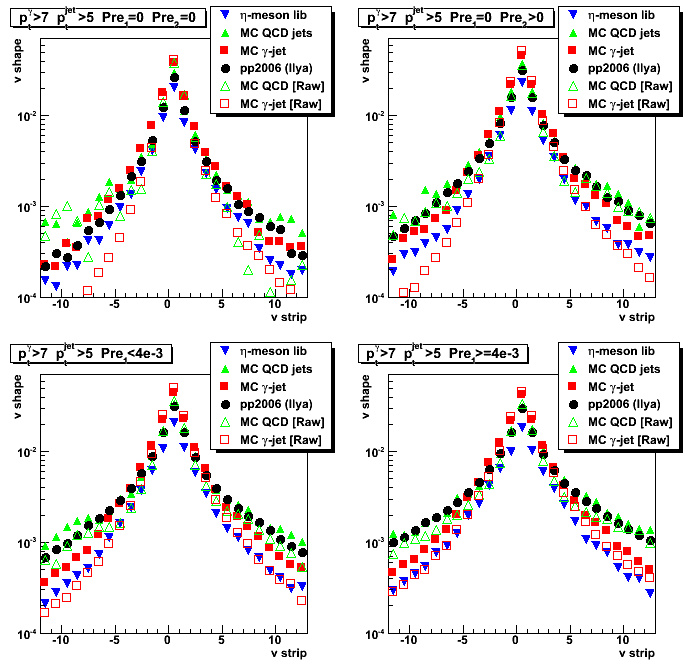
Figure 3: Shower shapes: data, raw, and data-driven MC (5 strips)
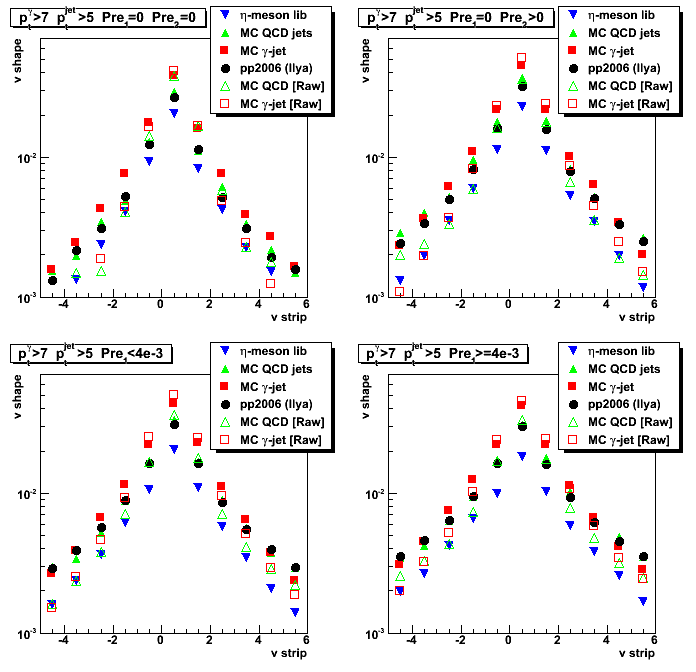
Figure 4: 25 strips SMD cluster energy for raw Monte-Carlo
(Note: type in x-axis lables, should be "25 strip peak" instead of 5)
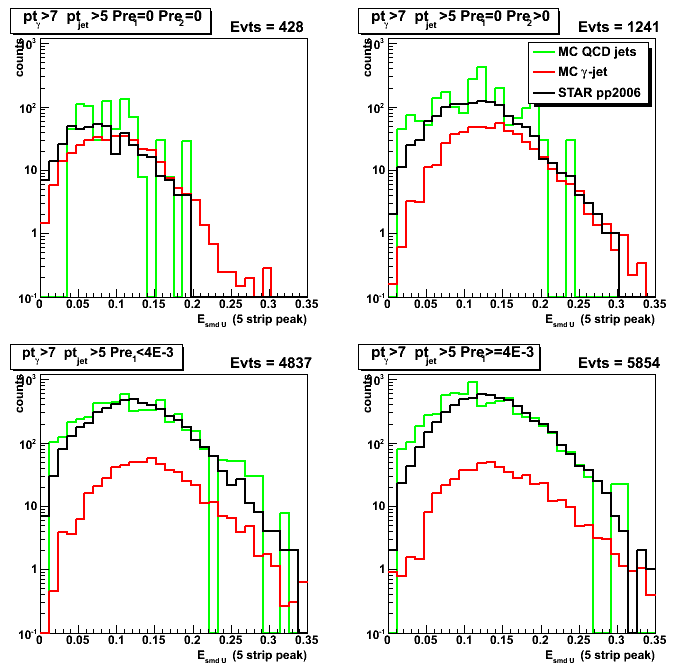
Figure 5: 25 strips SMD cluster energy for data-driven Monte-Carlo
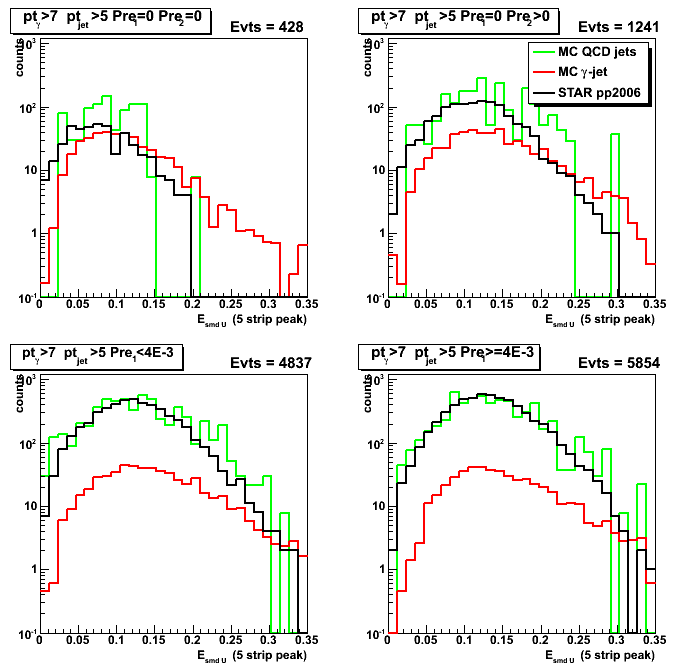
Figure 6: 5 strips SMD peak energy for raw Monte-Carlo
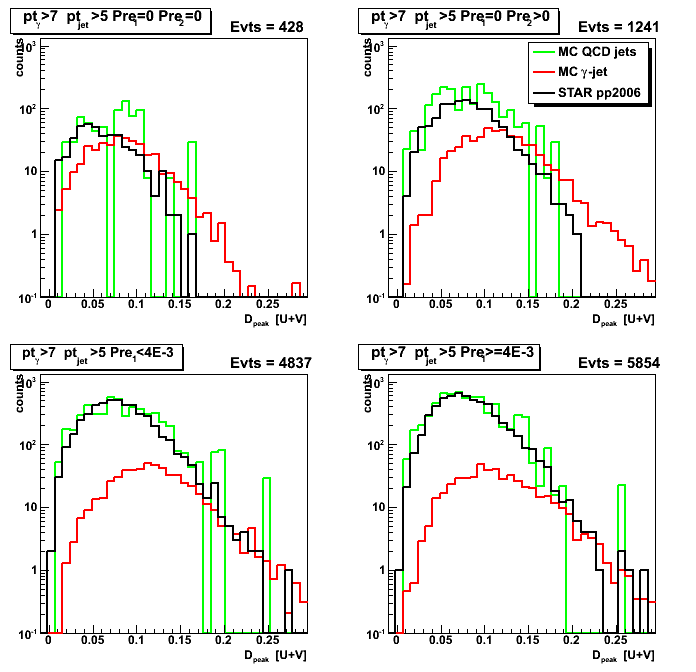
Figure 7: 5 strips SMD peak energy for data-driven Monte-Carlo
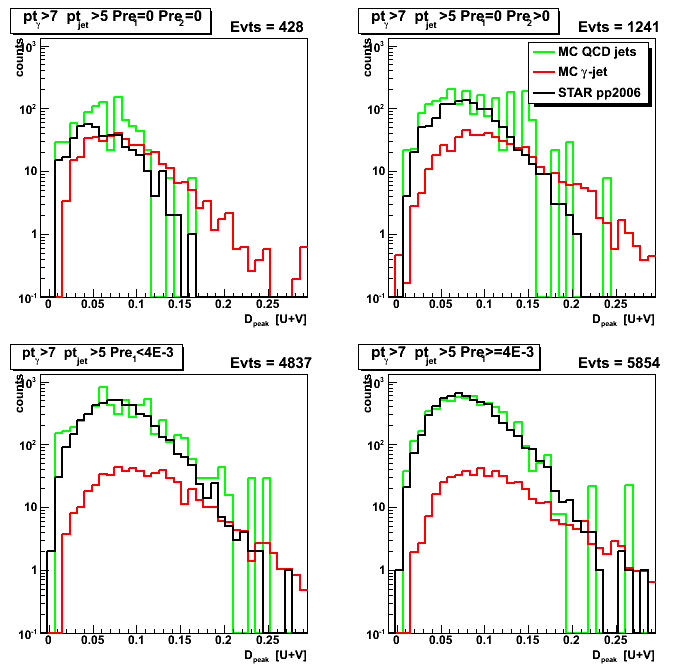
Figure 8:Energy from the right tail (up to 30 strips) for raw Monte-Carlo
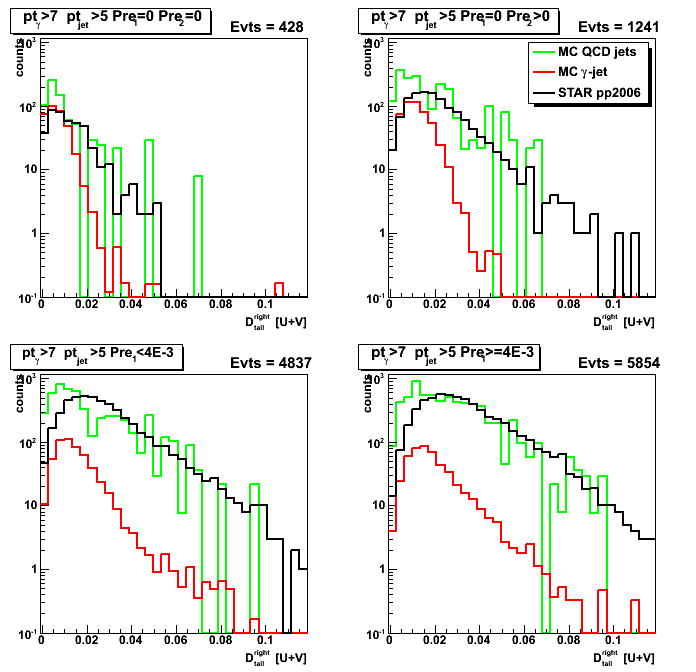
Figure 9:Energy from the right tail (up to 30 strips) for data-driven Monte-Carlo
2008.10.27 SMD-based shower shape scaling: 25 strips cluster energy, raw vs. data-driven MC
Ilya Selyuzhenkov October 27, 2008
Data sets:
- pp2006 - STAR 2006 pp longitudinal data (~ 3.164 pb^1)
after applying gamma-jet isolation cuts (R_cluster > 0.9 is used below). - gamma-jet[gamma-filtered] - data-driven Prompt Photon [p6410EemcGammaFilter] events.
Partonic pt range 2-25 GeV. - QCD jets[gamma-filtered] - data-driven QCD [p6410EemcGammaFilter] events.
Partonic pt range 2-25 GeV.
Shower shapes scaling options in data-driven maker:
- scale = E_smd^geant / E_smd^library (default)
E_smd^geant is SMD energy associated with given photon
integrated over +/- 12 strips from raw Monte-Carlo,
and E_smd^library is SMD energy from +/- 12 strips for the library photon. - scale = E_Geant / E_library (used before in all posts)
E_Geant is thrown photon energy from Geant record,
and E_library is stand for energy of the library photon.
In all figures below (exept for pp2006 data and raw Monte-Carlo)
the SMD based shower shape scaling has been used.
Figure 1: SMD shower shapes: data, raw, and data-driven MC (40 strips).
Vertical axis shows average energy per strip (no overall shower shapes scaling)
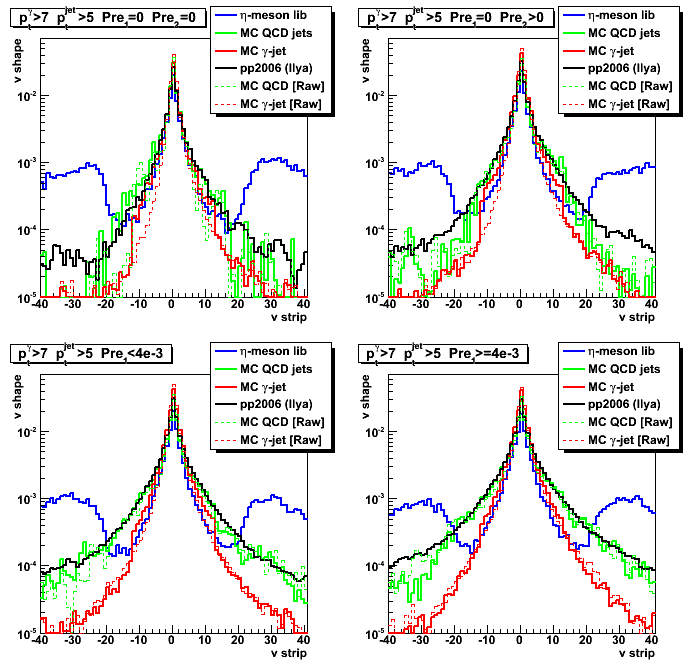
Figure 2: Shower shapes: data, raw, and data-driven MC (12 strips)
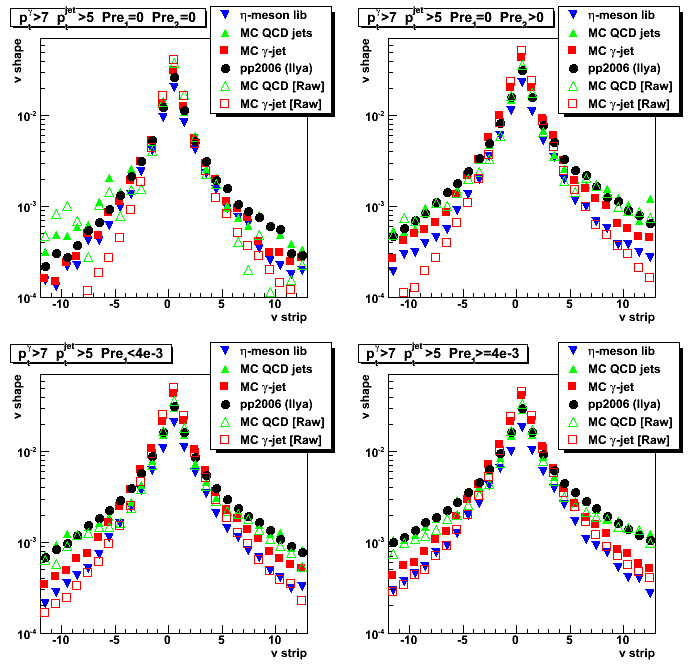
Figure 3: Shower shapes: data, raw, and data-driven MC (5 strips)
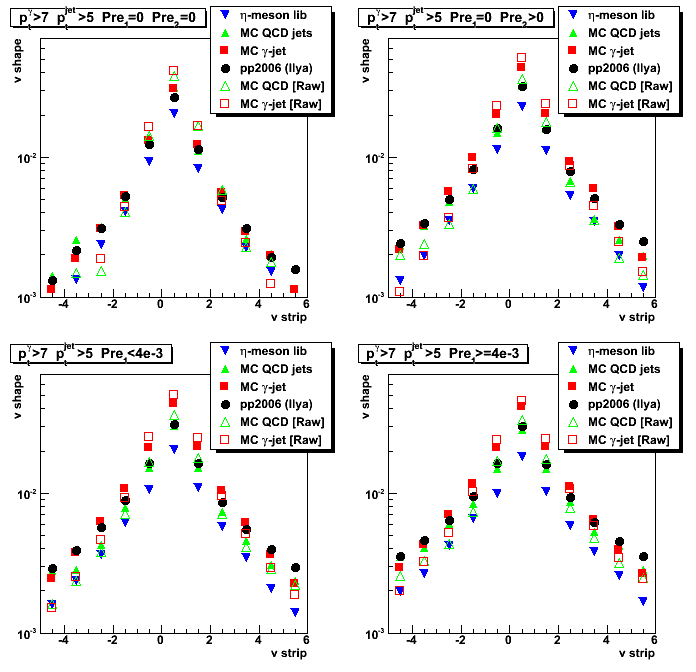
Figure 4: 25 strips SMD cluster energy for data-driven Monte-Carlo
(SMD based shower shape scaling)

Figure 5: 25 strips SMD cluster energy for raw Monte-Carlo
Note, the difference between results in Fig. 4 and 5. for MC gamma-jets (shown in red)
at low energy (Esmd < 0.04) for pre1=0 pre2=0 case.
This effect is due to the "Number of strips fired in 5-strips cluster > 3" cut.
In data-driven Monte-Carlo we may have shower shapes
with small number of strips fired (rejected in raw Monte-Carlo)
to be replaced by library shape with different (bigger) number of strips fired.
This mostly affects photons which starts to shower
later in the detector and only fires few strips (pre1=0 pre2=0 case)
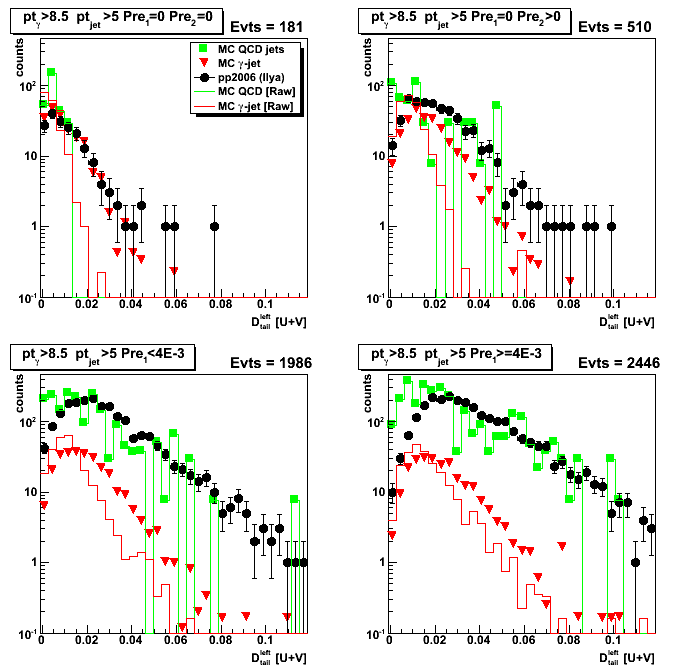
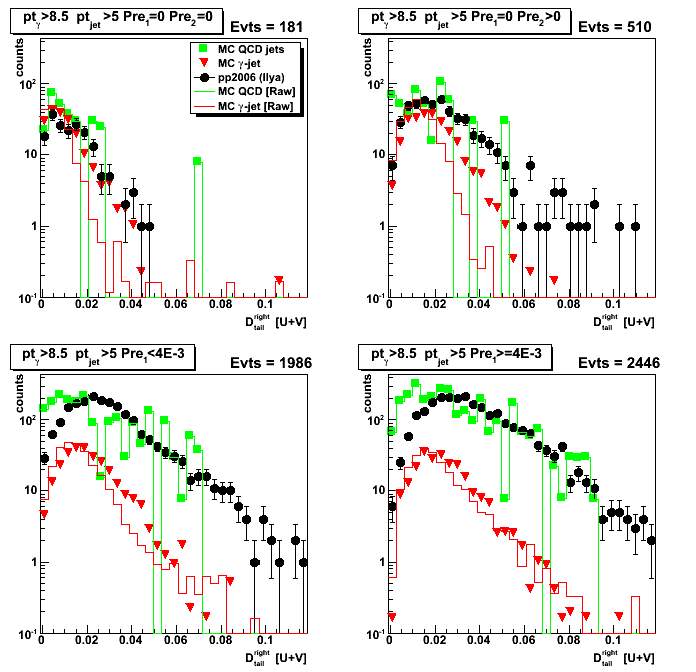
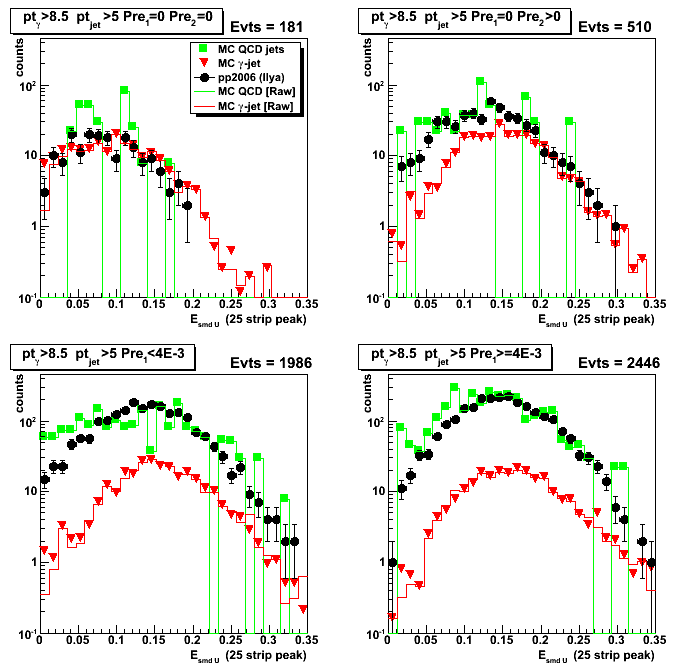
2008.10.30 Various cuts study (pt, Esmd, 8 strips replaced)
Ilya Selyuzhenkov October 30, 2008
Below are links to drupal pages
with various SMD energy distributions and shower shapes
for the following set of cuts/conditions:
- Case A: pt > 7 GeV, +/- 12 strips replaced
- Case B: pt > 7 GeV, +/- 8 strips replaced
- Case C: pt > 7 GeV, +/- 12 strips replaced, E_smd(25strips) > 0.1
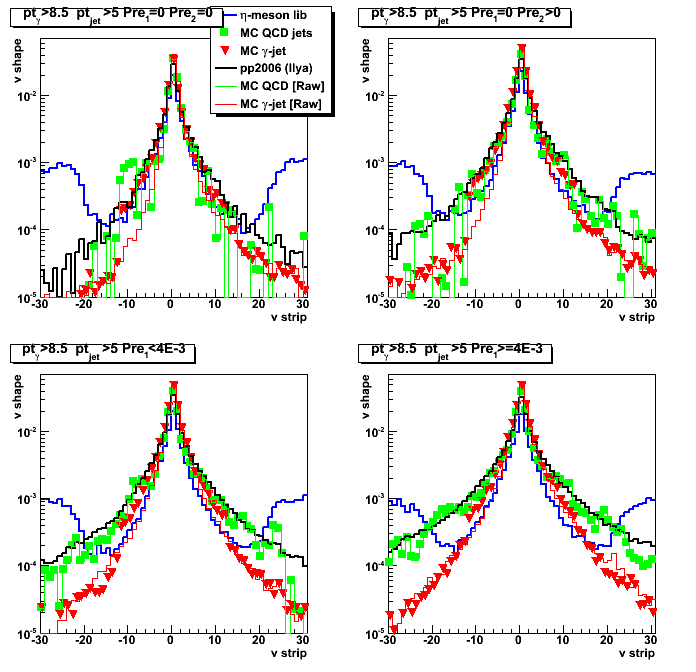
- Case D: pt > 8.5 GeV, +/- 12 strips replaced
2008.10.30 Distance to cut line from sided residual
Figure 1: Case A
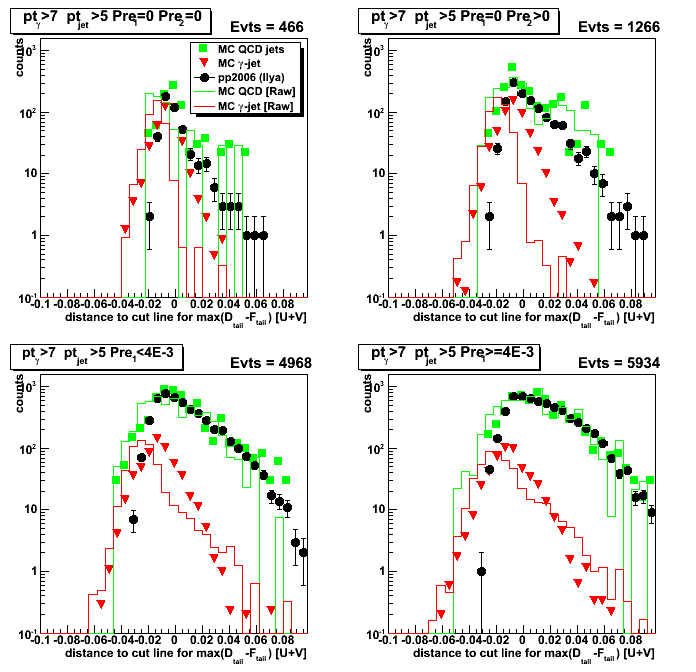
Figure 2:Case B
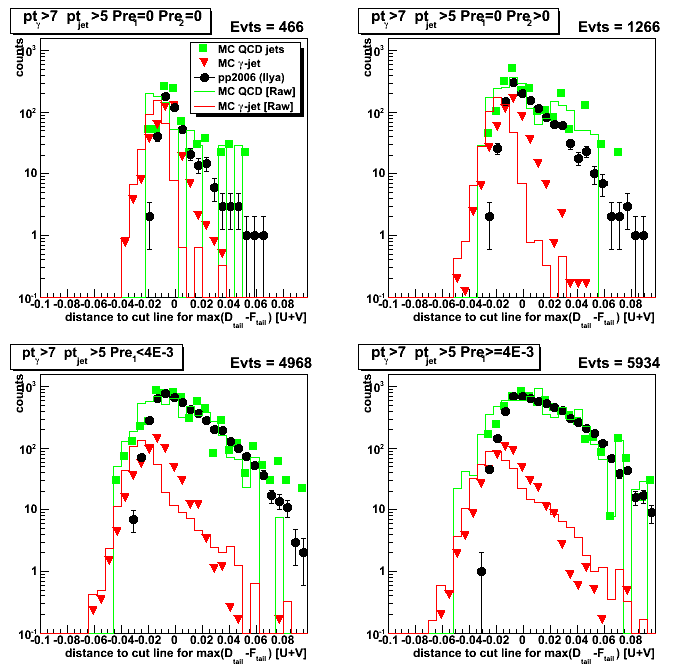
Figure 3:Case C
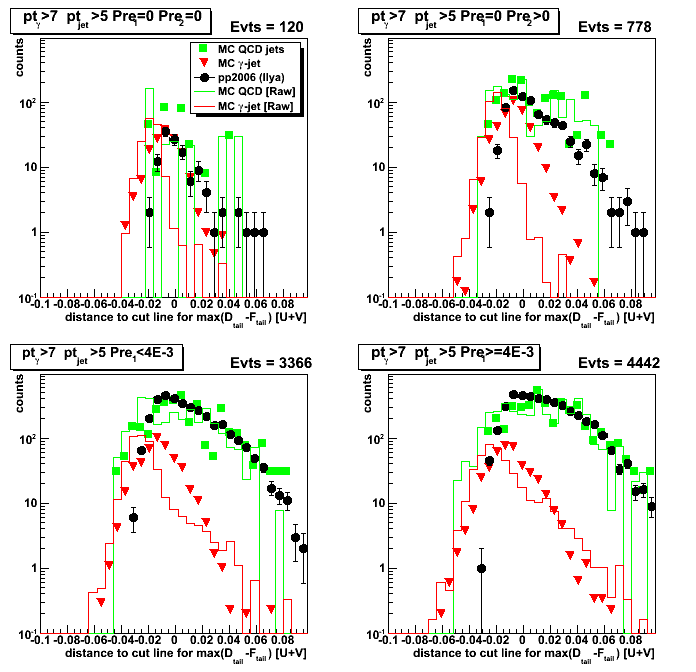
Figure 4:Case D
2008.10.30 SMD shower shapes: data, raw, and data-driven MC (12 strips)
Figure 1: Case A
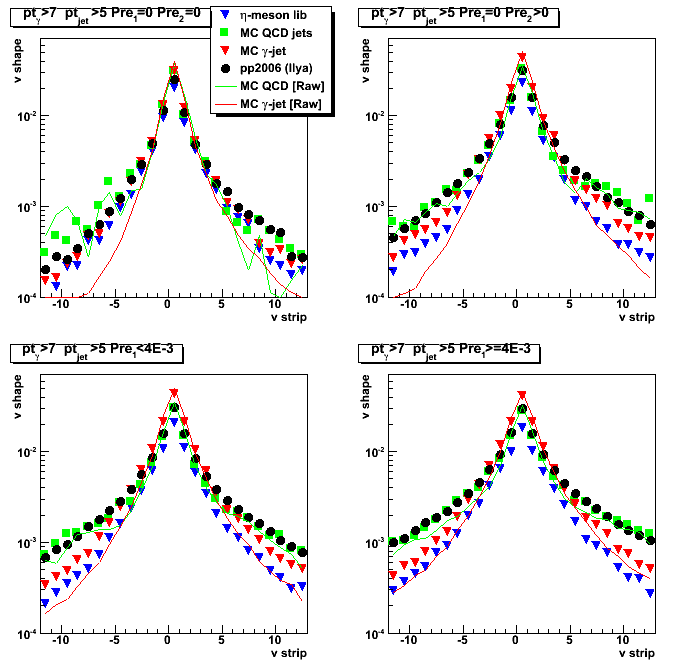
Figure 2:Case B
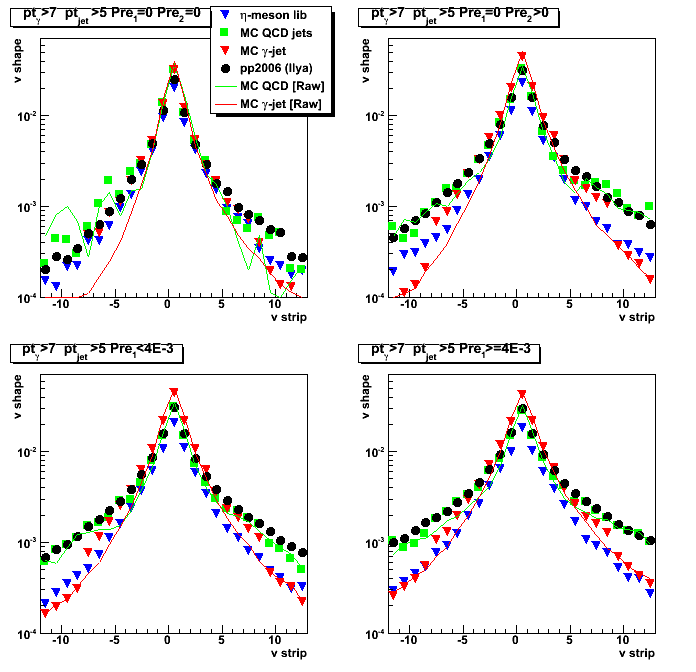
Figure 3:Case C
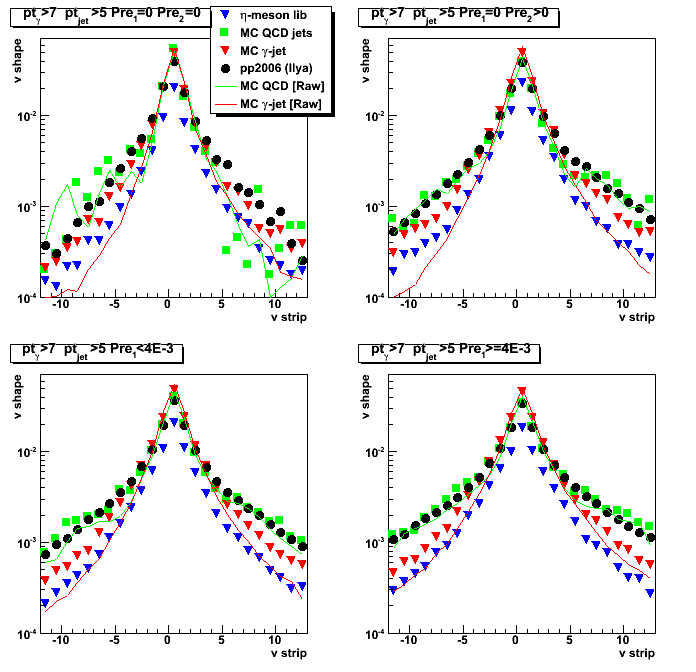
Figure 4:Case D
2008.10.30 SMD shower shapes: data, raw, and data-driven MC (30 strips)
Figure 1: Case A
Figure 2: Case B
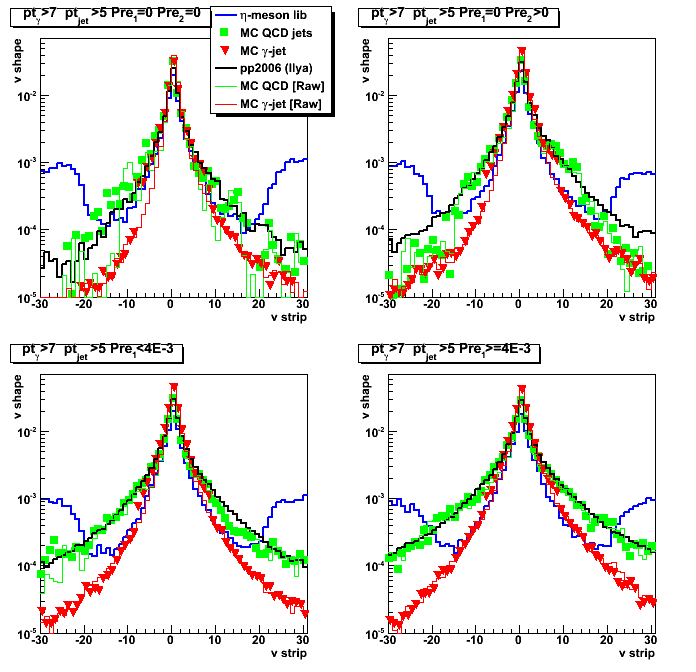
Figure 3: Case C
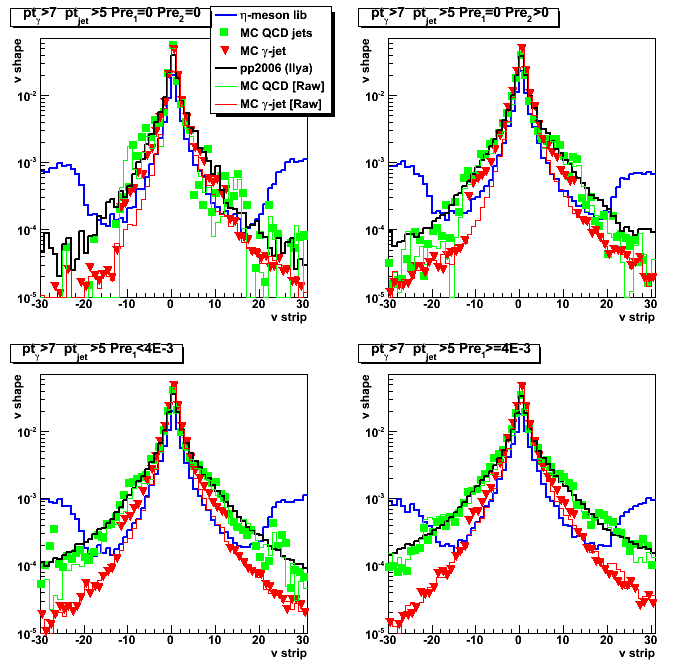
Figure 4: Case D
2008.10.30 Sided residual
Figure 1: Case A
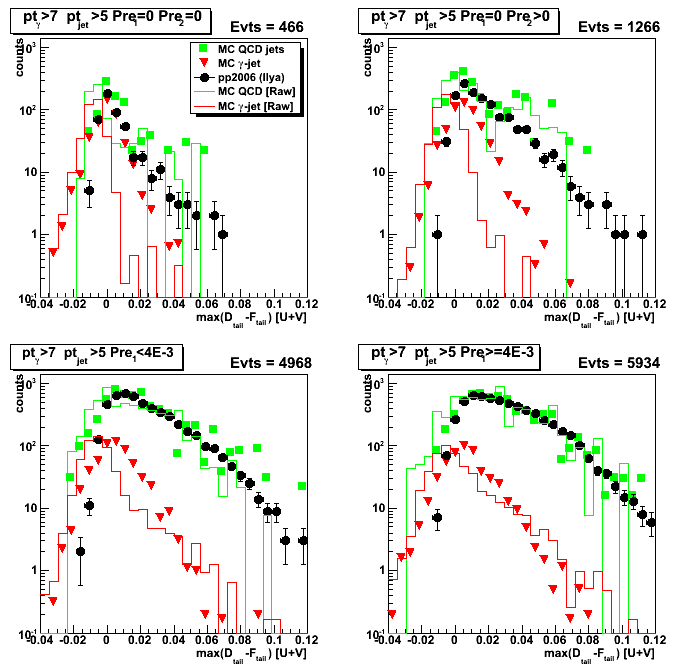
Figure 2:Case B
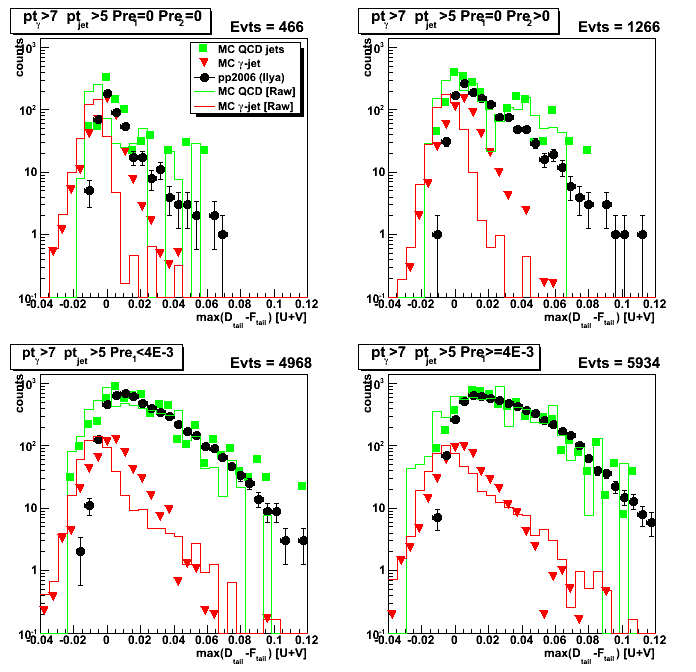
Figure 3:Case C
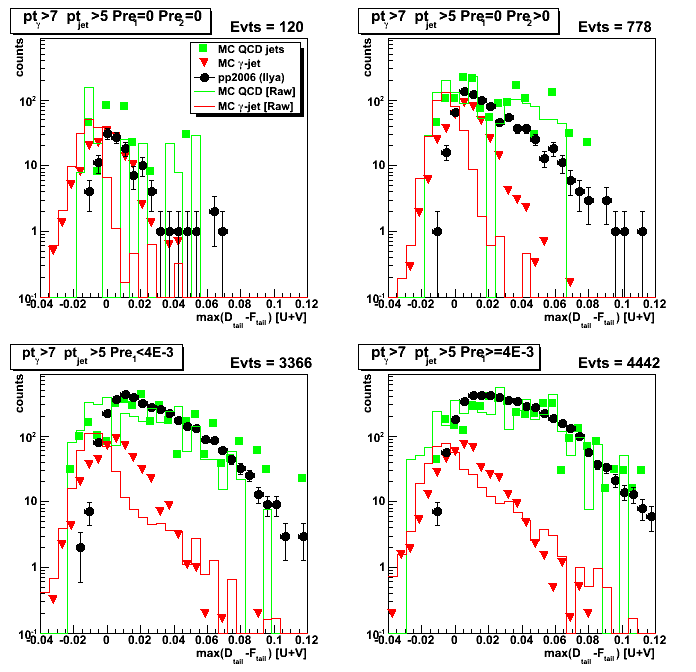
Figure 4:Case D
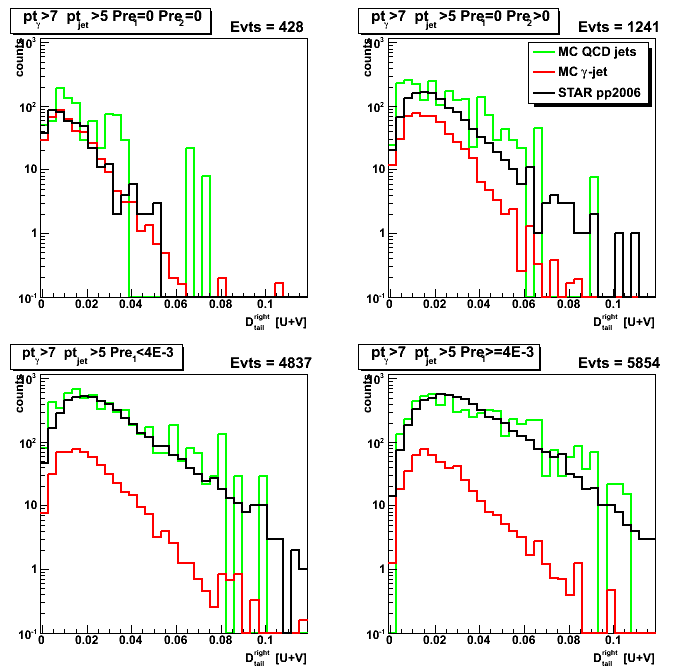
2008.10.30 Smd emergy for left tail (-3 to -30 strips)
Figure 1: Case A

Figure 2:Case B
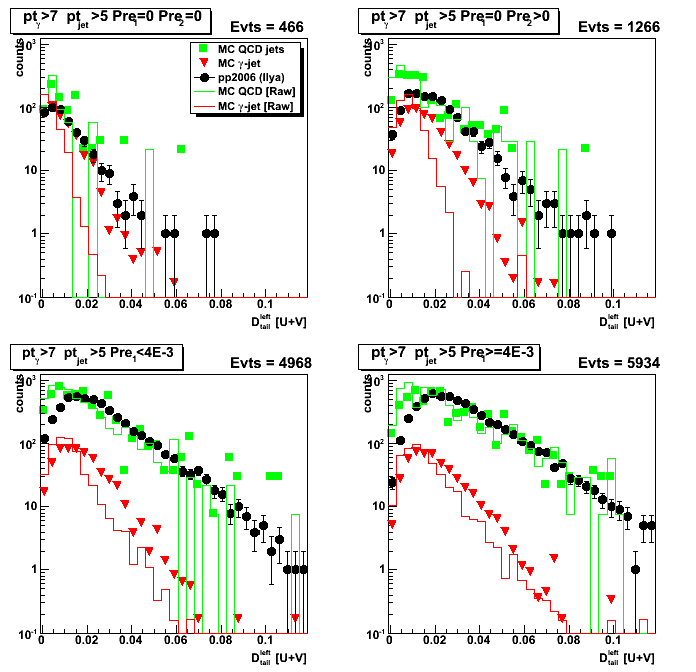
Figure 3:Case C
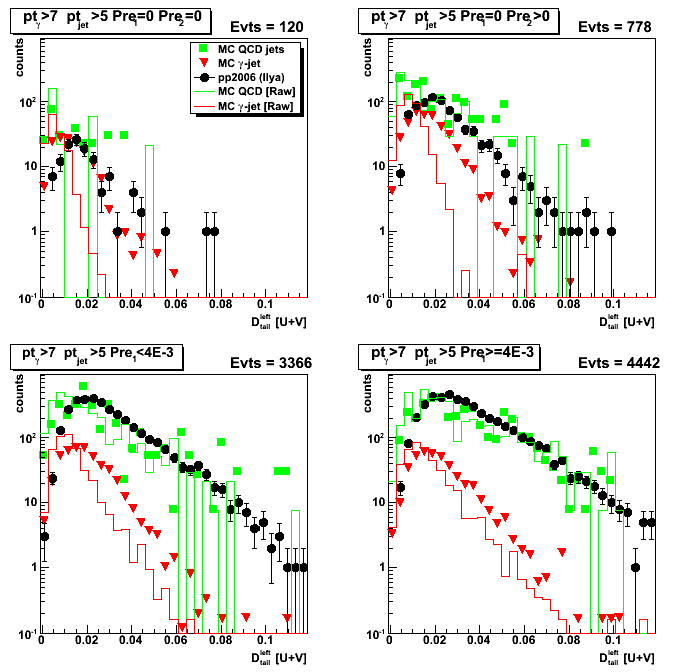
Figure 4:Case D
2008.10.30 Smd emergy for right tail (3 to 30 strips)
Figure 1: Case A
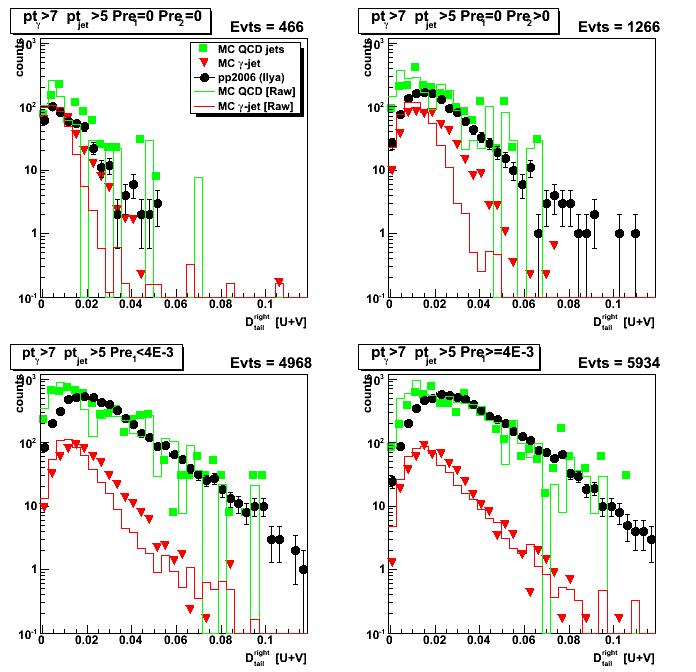
Figure 2:Case B
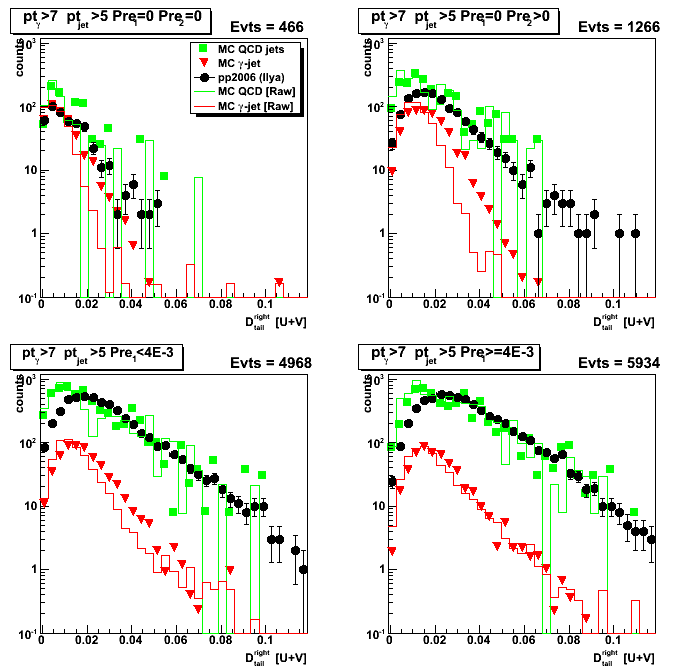
Figure 3:Case C
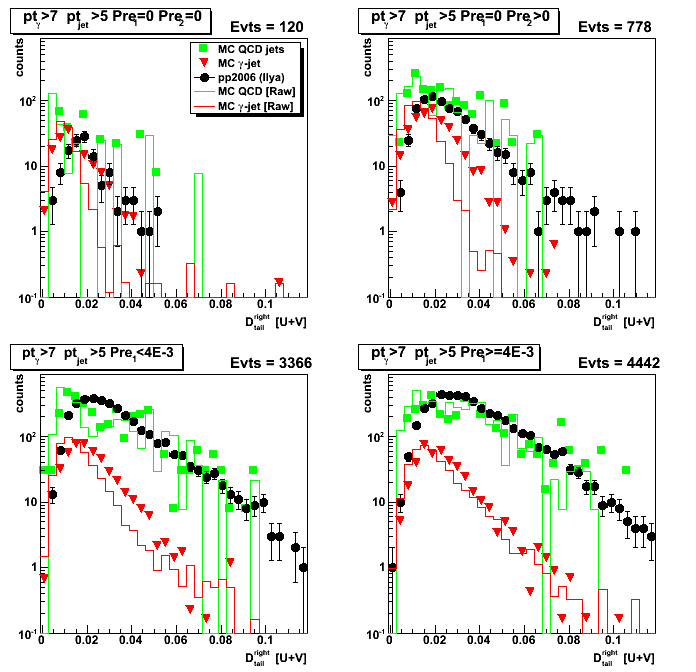
Figure 4:Case D
2008.10.30 Smd energy for 25 central strips
Figure 1: Case A
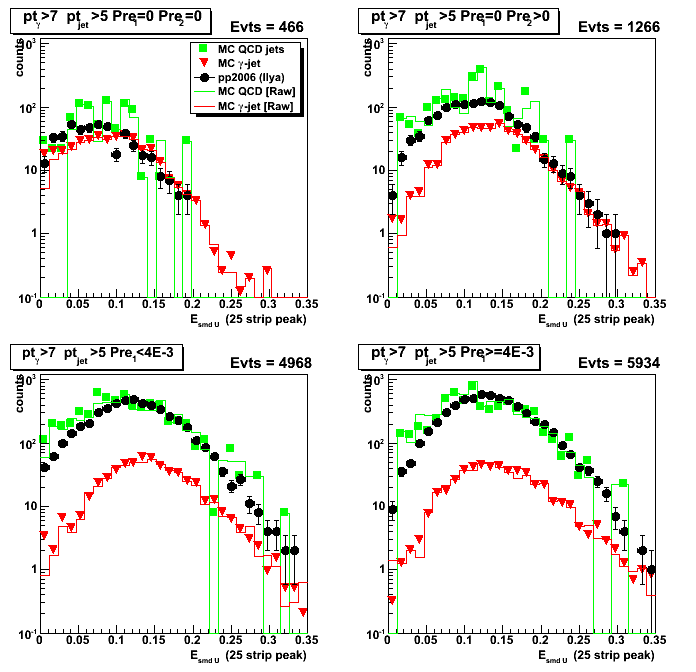
Figure 2:Case B

Figure 3:Case C
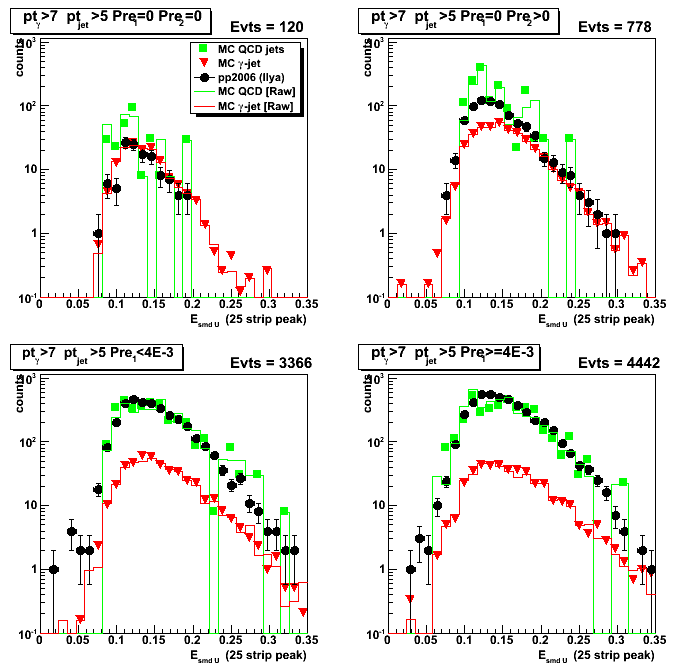
Figure 4:Case D
2008.10.30 Smd energy for 5 central strips
Figure 1: Case A
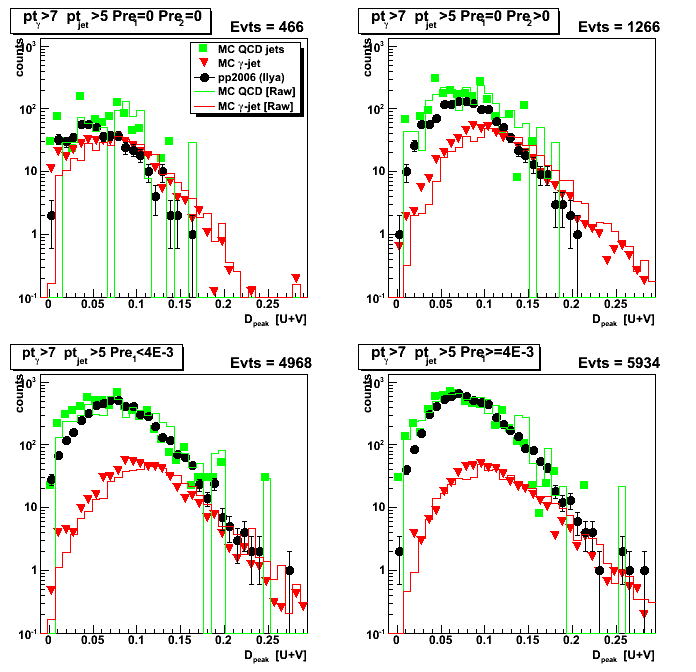
Figure 2:Case B
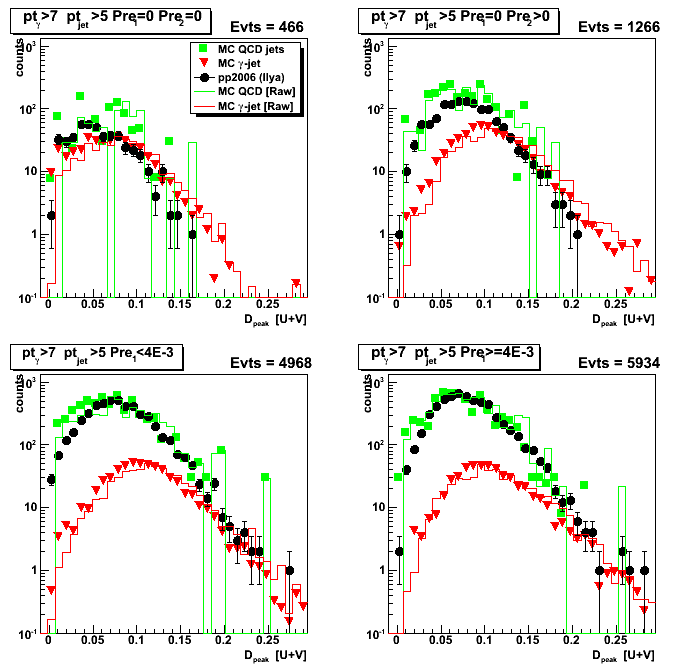
Figure 3:Case C
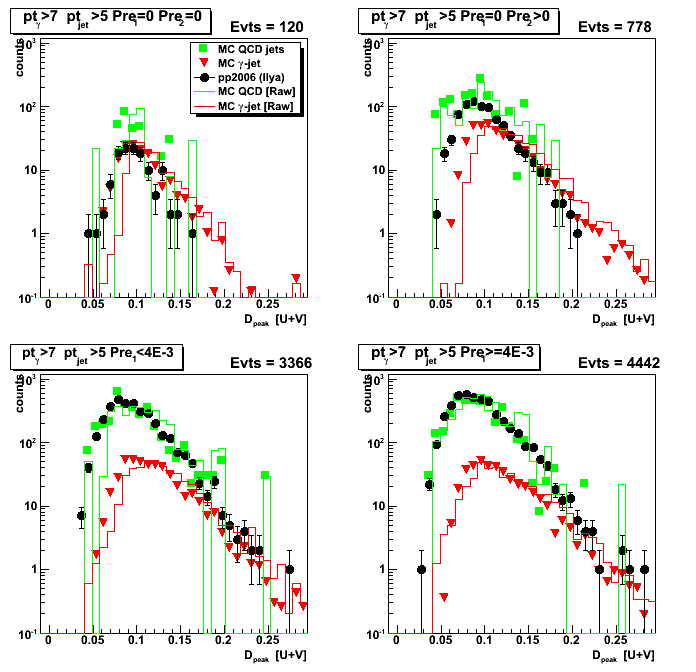
Figure 4:Case D