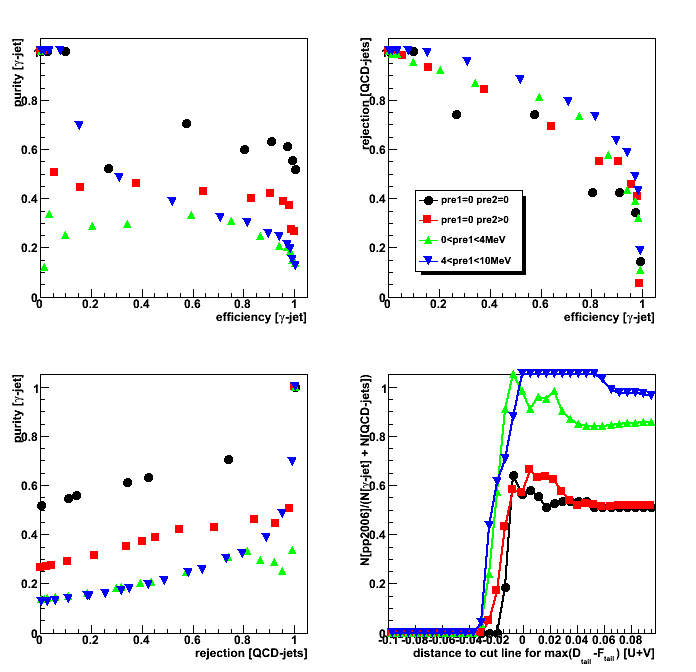
2008.10.15 Purity vs. efficiency from gamma-filtered events: R_cluster > 0.9 vs. R_cluster > 0.98
Ilya Selyuzhenkov October 15, 2008
Data sets:
- pp2006 - STAR 2006 pp longitudinal data (~ 3.164 pb^1)
after applying gamma-jet isolation cuts (note: R_cluster > 0.9 or > 0.98 is used below). - gamma-jet[gamma-filtered] - data-driven Prompt Photon [p6410EemcGammaFilter] events.
Partonic pt range 2-25 GeV. - QCD jets[gamma-filtered] - data-driven QCD [p6410EemcGammaFilter] events.
Partonic pt range 2-25 GeV.
Gamma-jet candidates from MC gamma filtered events: R_cluster > 0.9
Figure 1: Horizontal distance from sided residual plot: R_cluster > 0.9
(see Figs. 1-5 from this post for horizontal distance definition)
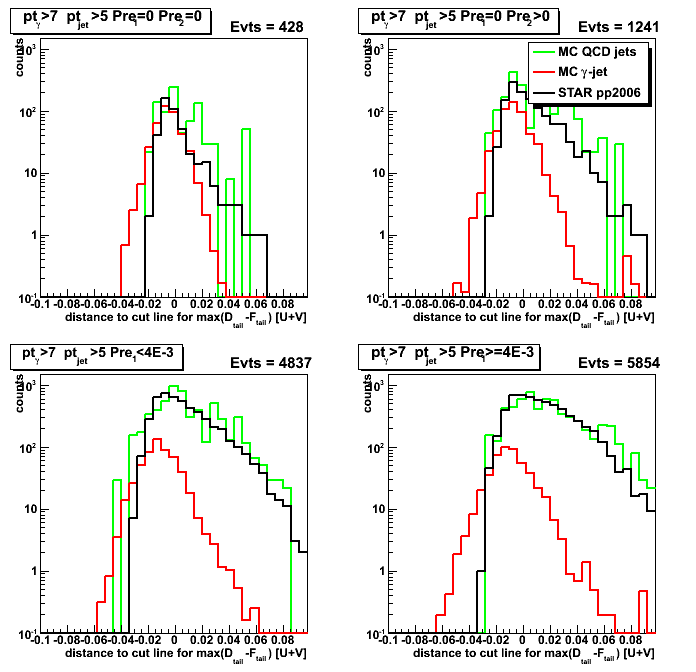
Figure 2: Purity/efficiency/rejection, and data to MC[gamma-jet+QCD] ratio plots: R_cluster > 0.9
(see text above Fig. 6 from this post for purity, efficiency, and background rejection definition)
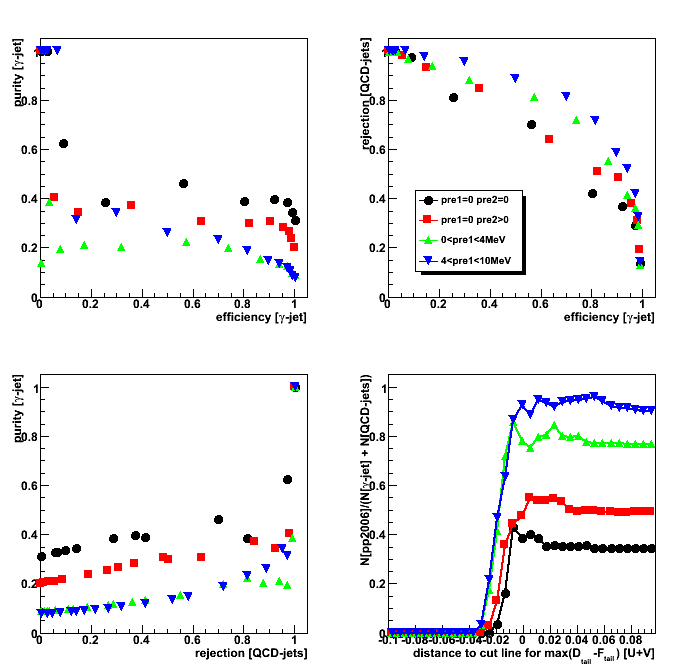
Gamma-jet candidates from MC gamma filtered events: R_cluster > 0.98
Figure 3: Reconstructed gamma pt: R_cluster > 0.98
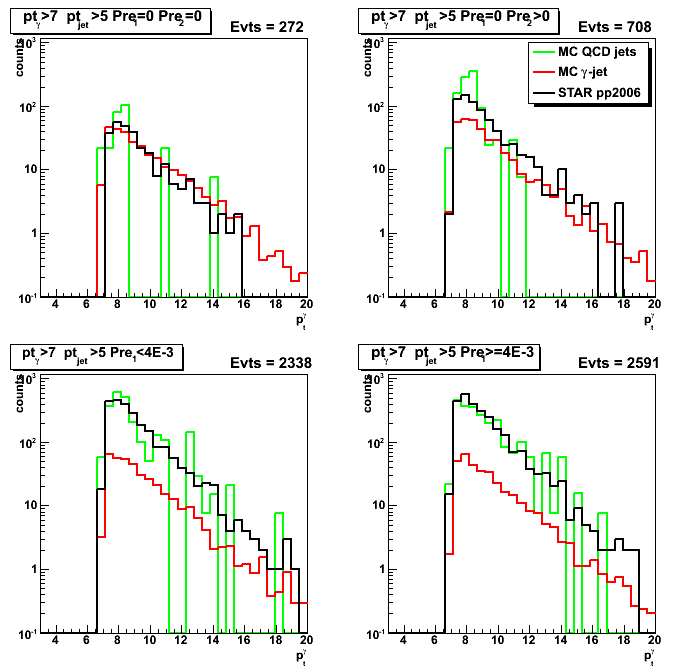
Figure 4: Horizontal distance from sided residual plot: R_cluster > 0.98
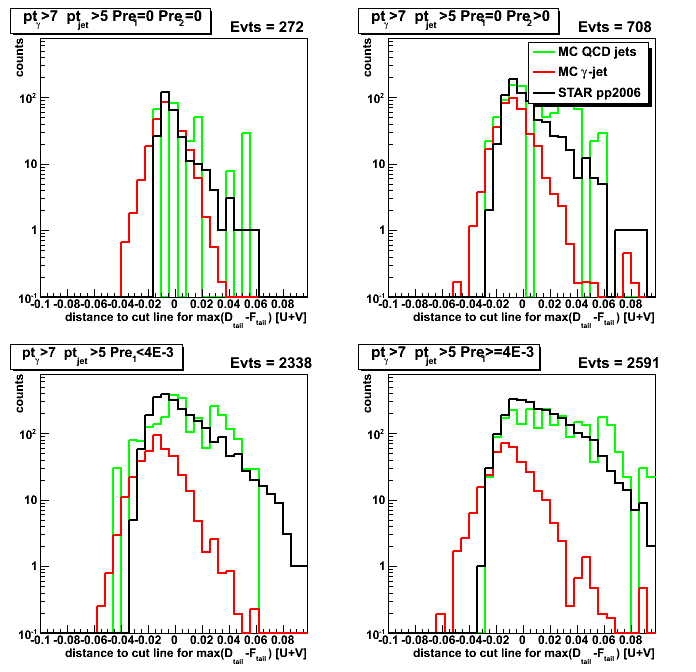
Figure 5: Purity/efficiency/rejection, and data to MC[gamma-jet+QCD] ratio plots: R_cluster > 0.98
