11 Nov
November 2008 posts
2008.11.06 Gamma-jet reconstruction with the Endcap EMC (Analysis status update)
Ilya Selyuzhenkov November 06, 2008
Gamma-jet reconstruction with the Endcap EMC (Analysis status update for Spin PWG)
- latest version (pdf)
- Version 3: pdf or odp (for spin PWG)
- Version 2: pdf or odp (after phana comments)
- Version 1: pdf or odp (draft for phana meeting)
2008.11.11 Yields vs. analysis cuts
Ilya Selyuzhenkov November 11, 2008
Data sets:
- pp2006 - STAR 2006 pp longitudinal data (~ 3.164 pb^1)
after applying gamma-jet isolation cuts (R_cluster > 0.9 is used below). - gamma-jet[gamma-filtered] - data-driven Prompt Photon [p6410EemcGammaFilter] events.
Partonic pt range 2-25 GeV. - QCD jets[gamma-filtered] - data-driven QCD [p6410EemcGammaFilter] events.
Partonic pt range 2-25 GeV.
Figure 1: Reconstructed gamma pt for di-jet events and
Geant cuts: pt_gamma[Geant] > 7GeV and 1.05 < eta_gamma[Geant] < 2.0
Total integral for the histogram is: N_total = 5284
(after weighting different partonic pt bins and scaled to 3.164pb^-1).
Compare with number from Jim Sowinski study for
Endcap East+West gamma-jet and pt>7 GeV: N_Jim = 5472
( Jim's numbers are scaled to 3.164pb^-1 : [2539+5936]*3.164/4.9) 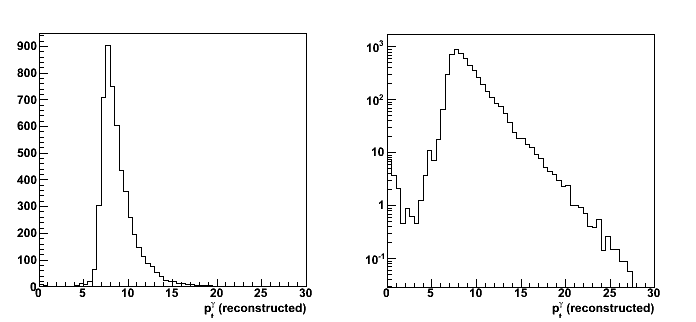
Figure 2: Reconstructed jet pt for di-jet events and the same cuts as in Fig. 1

Yield vs. various analysis cuts
List of cuts (sorted by bin number in Figs. 2 and 3):
- N_events : total number of di-jet events found by the jet-finder
- cos(phi_gamma - phi_jet) < -0.8 : gamma-jet opposite in phi
- R_{3x3cluster} > 0.9 : Energy in 3x3 cluster of EEMC tower to the total jet energy
- R_EM^jet < 0.9 : neutral energy fraction cut for on away side jet
- N_ch=0 : no charge tracks associated with a gamma candidate
- N_bTow = 0 : no barrel towers associated with a gamma candidate (gamma in the endcap)
- N_(5-strip cluster)^u > 2 : minimum number of strips in EEMC SMD u-plane cluster around peak
- N_(5-strip cluster)^v > 2 : minimum number of strips in EEMC SMD v-plane cluster around peak
- gamma-algo fail : my algorithm failed to match tower with SMD uv-intersection, etc...
- Tow:SMD match : SMD uv-intersection has a tower which is not in a 3x3 cluster
Figure 3: Number of accepted events vs. various analysis cuts
The starting number of events (shown in first bin of the plots) is
the number of di-jets with reconstructed gamma_pt>7 GeV and jet_pt>5 GeV
upper left: cuts applied independently
upper right: cuts applied sequentially
lower left: ratio of pp2006 data vs. MC sum of gamma-jet and QCD-jets events (cuts applied independently)
lower right:ratio of pp2006 data vs. MC sum of gamma-jet and QCD jets events (cuts applied sequentially)
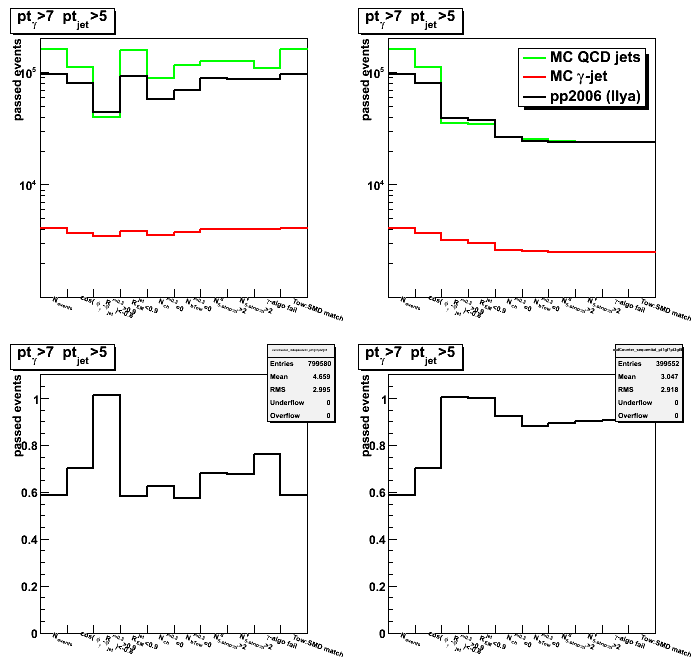
Figure 4: Number of accepted events vs. various analysis cuts
Data from Fig. 3 (upper plots) scaled to the initial number of events from first bin:
left: cuts applied independently
right: cuts applied sequentially

2008.11.18 Cluster isolation cuts: 2x1 vs. 2x2 vs. 3x3
Ilya Selyuzhenkov November 18, 2008
Data sets:
- pp2006 - STAR 2006 pp longitudinal data (~ 3.164 pb^1)
after applying gamma-jet isolation cuts (no R_cluster cut applied for this study). - gamma-jet[gamma-filtered] - data-driven Prompt Photon [p6410EemcGammaFilter] events.
Partonic pt range 2-25 GeV. - QCD jets[gamma-filtered] - data-driven QCD [p6410EemcGammaFilter] events.
Partonic pt range 2-25 GeV.
2x1, 2x2, and 3x3 clusters definition:
- 3x3 cluster: tower energy sum for 3x3 patch around highest tower
- 2x2 cluster: tower energy sum for 2x2 patch
which are closest to 3x3 tower patch centroid.
3x3 tower patch centroid is defined based
on tower energies weighted wrt tower centers:
centroid = sum{E_tow * r_tow} / sum{E_tow}.
Here r_tow=(x_tow, y_tow) denotes tower center. - 2x1 cluster: tower energy sum for high tower plus second highest tower in 3x3 patch
- r=0.7 energy is calculated based on towers
within a radius of 0.7 (in delta phi and eta) from high tower
Cuts applied
all gamma-jet candidate selection cuts except 3x3/r=0.7 energy isolation cut
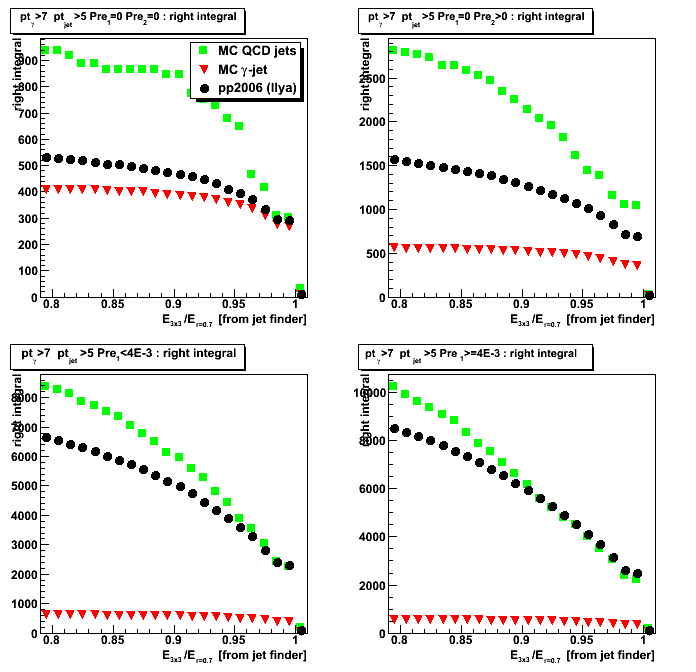
Results for 2x1, 2x2, and 3x3 clusters
- Energy fraction in NxN cluster in r=0.7 radius
2x1, 2x2, 3x3 patch to jet radius of 0.7 energy ratios - Yield vs. NxN cluster energy fraction in r=0.7
For a given cluster energy fraction yield is defined as an integral on the right - Efficiency vs. NxN cluster energy fraction in r=0.7
For a given cluster energy fraction
efficiency is defined as the yield (on the right)
normalized by the total integral (total yield)
Efficiency vs. NxN cluster energy fraction in r=0.7
Efficiency vs. NxN cluster energy fraction in r=0.7
Figure 1b: 2x1/0.7 ratio
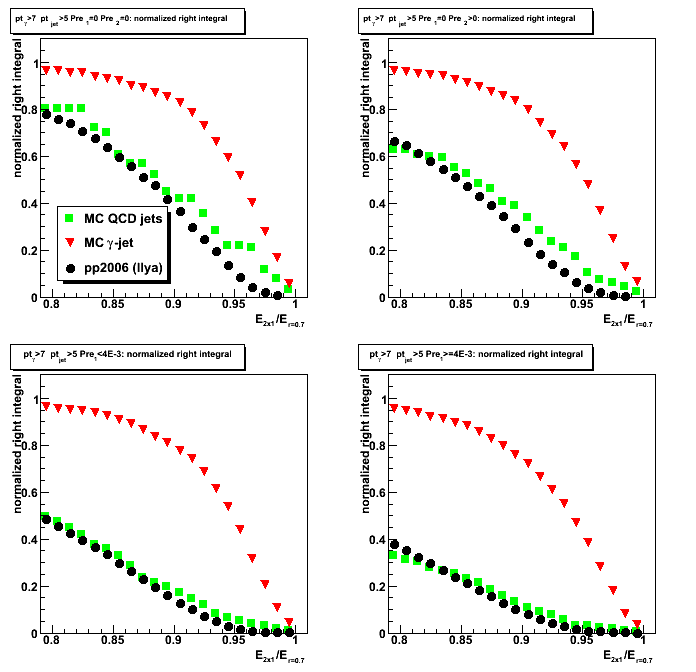
Figure 2b: 2x2/0.7 ratio
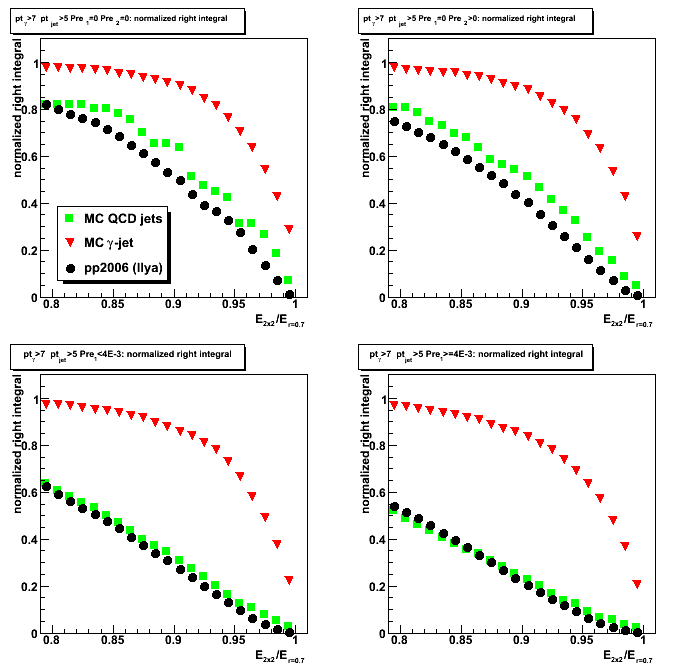
Figure 3b: 3x3/0.7 ratio
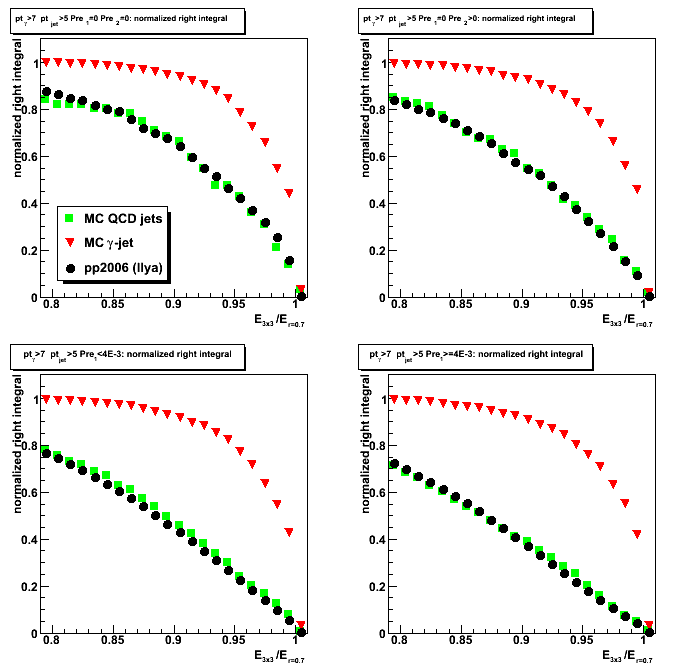
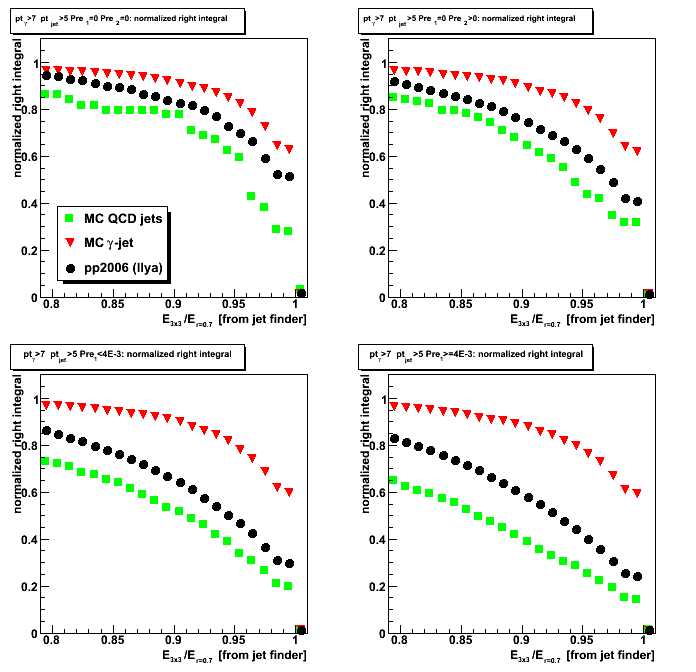
Figure 4b: 3x3/0.7 ratio but only using towers which passed jet finder threshold
Energy fraction in NxN cluster within r=0.7 radius
Energy fraction in NxN cluster within r=0.7 radius
Figure 1a: 2x1/0.7 ratio
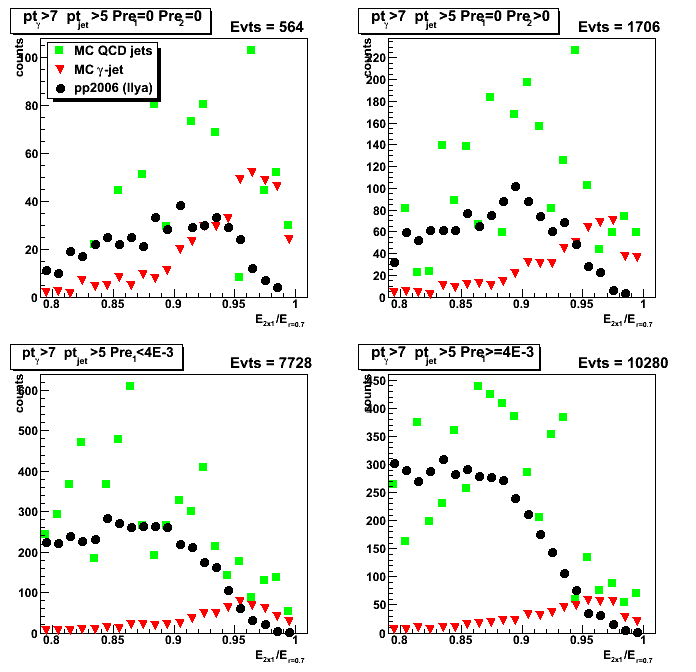
Figure 2a: 2x2/0.7 ratio
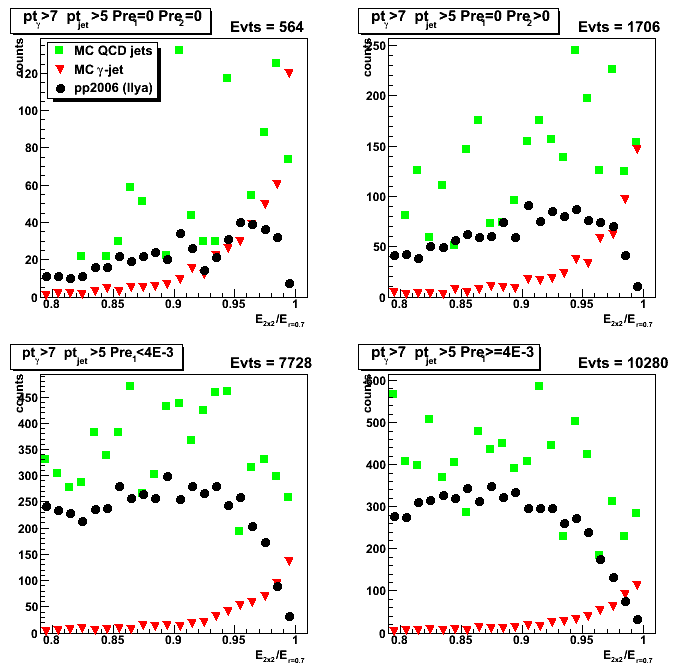
Figure 3a: 3x3/0.7 ratio
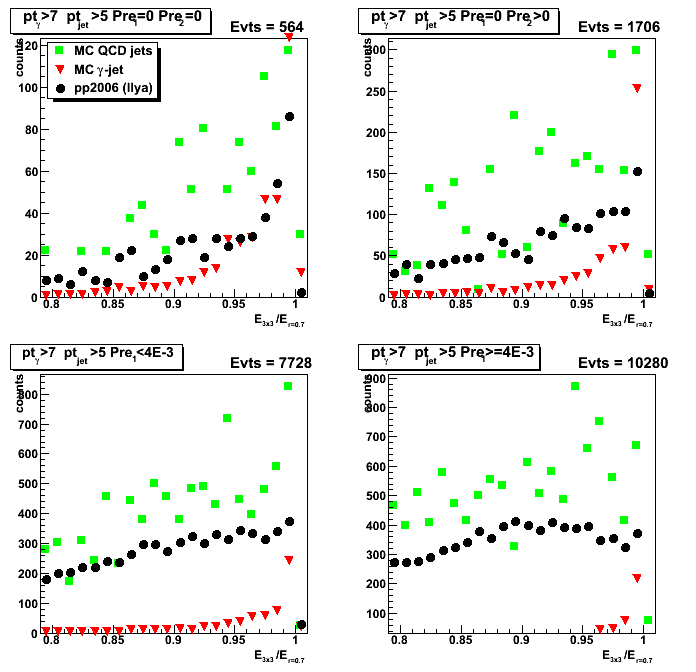
Figure 4a: 3x3/0.7 ratio but only using towers which passed jet finder threshold
Yield vs. NxN cluster energy fraction in r=0.7
Yield vs. NxN cluster energy fraction in r=0.7
Figure 1c: 2x1/0.7 ratio
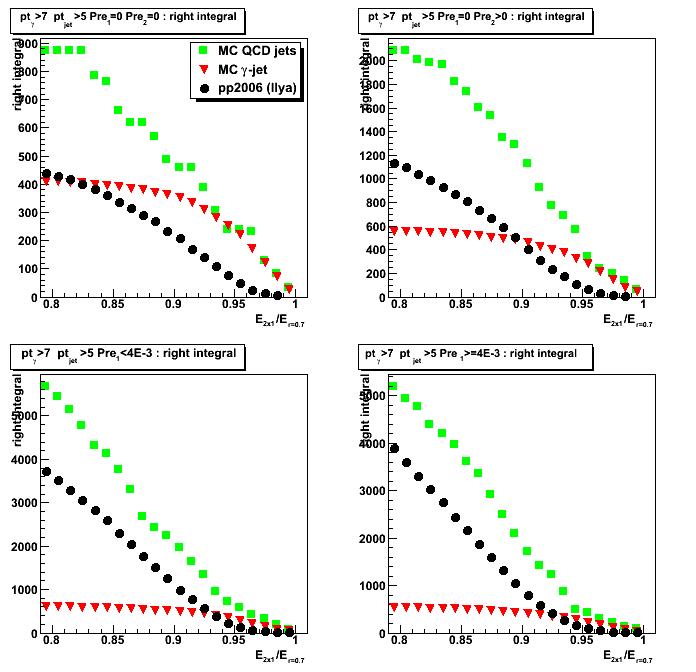
Figure 2c: 2x2/0.7 ratio

Figure 3c: 3x3/0.7 ratio
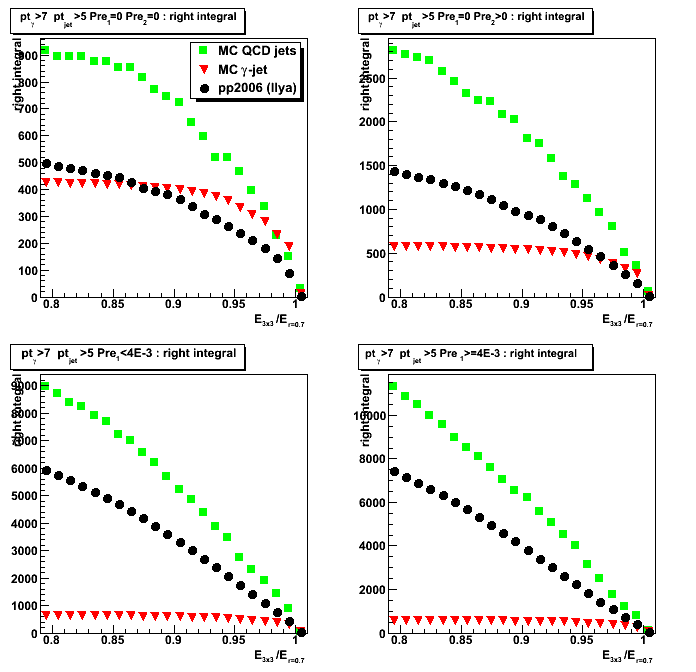
Figure 4c: 3x3/0.7 ratio but only using towers which passed jet finder threshold
2008.11.21 Energy fraction from 2x1 vs. 2x2 vs. 3x3 or 0.7 radius: rapidity dependence
Ilya Selyuzhenkov November 21, 2008
Data sets:
- pp2006 - STAR 2006 pp longitudinal data (~ 3.164 pb^1)
after applying gamma-jet isolation cuts (no R_cluster cut applied for this study). - gamma-jet[gamma-filtered] - data-driven Prompt Photon [p6410EemcGammaFilter] events.
Partonic pt range 2-25 GeV. - QCD jets[gamma-filtered] - data-driven QCD [p6410EemcGammaFilter] events.
Partonic pt range 2-25 GeV.
2x1, 2x2, and 3x3 clusters definition:
- 3x3 cluster: tower energy sum for 3x3 patch around highest tower
- 2x2 cluster: tower energy sum for 2x2 patch
which are closest to 3x3 tower patch centroid.
3x3 tower patch centroid is defined based
on tower energies weighted wrt tower centers:
centroid = sum{E_tow * r_tow} / sum{E_tow}.
Here r_tow=(x_tow, y_tow) denotes tower center. - 2x1 cluster: tower energy sum for high tower plus second highest tower in 3x3 patch
- r=0.7 energy is calculated based on towers
within a radius of 0.7 (in delta phi and eta) from high tower
Cuts applied
all gamma-jet candidate selection cuts except 3x3/r=0.7 energy isolation cut
Results
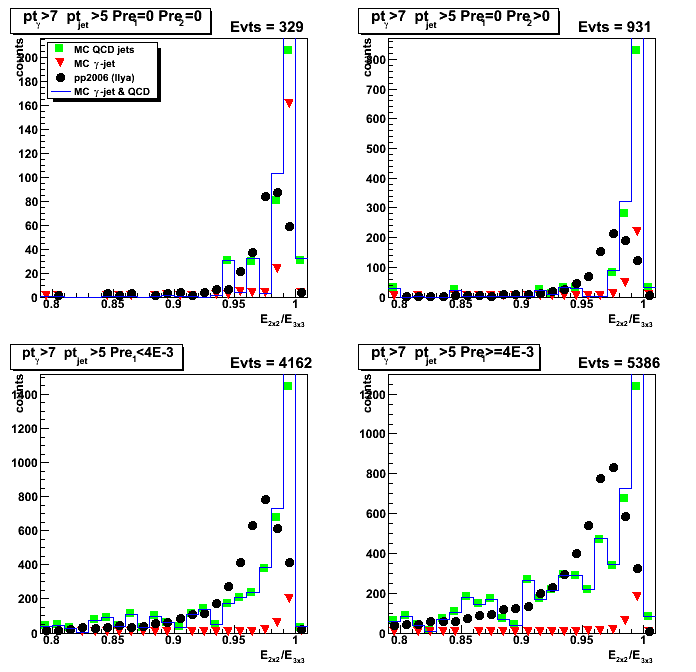
There are two sets of figures in links below:
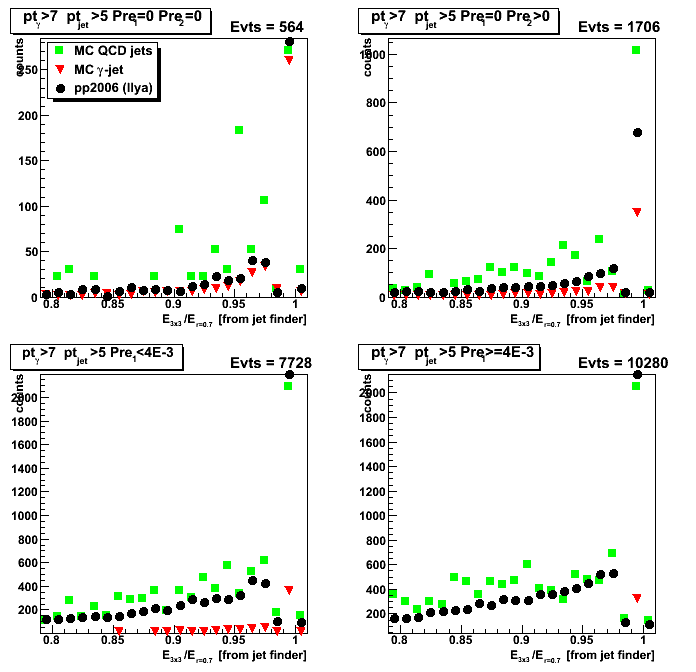
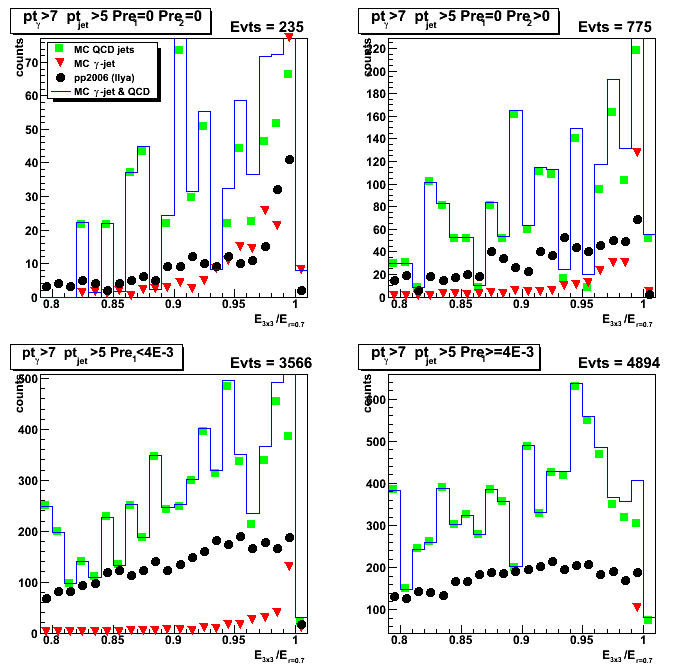
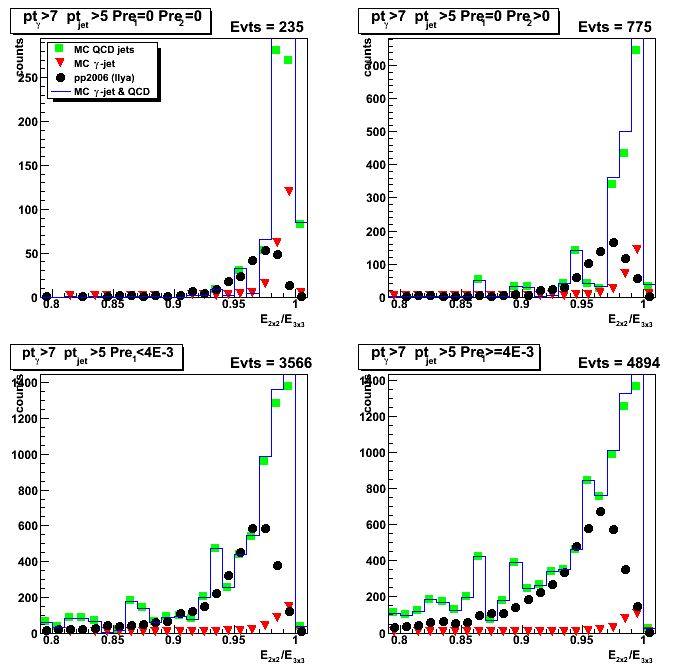
- Number of counts for a given energy fraction
- Yield above given energy fraction
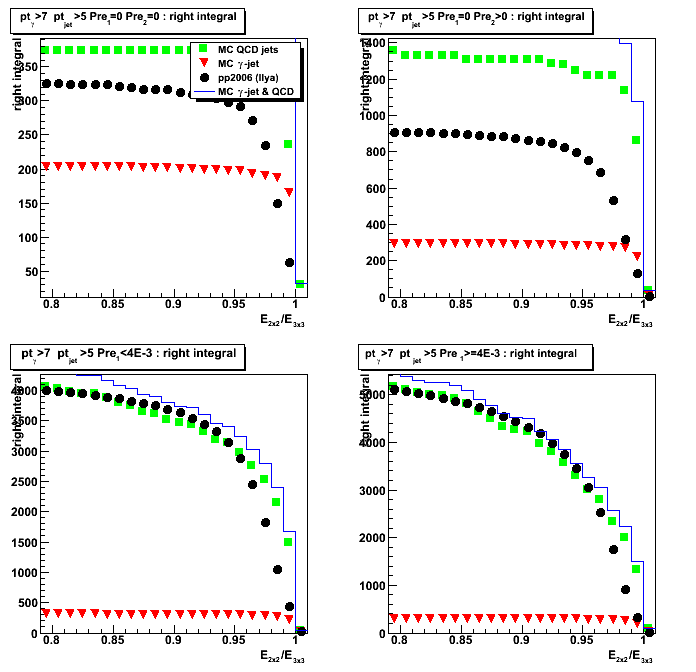
[figures with right integral in the caption]
Yield is defined as the integral above given energy fraction
up to the maximum value of 1
Gamma candidate detector eta < 1.5
(eta region where we do have most of the TPC tracking):
Gamma candidate detector eta > 1.5:
(smaller tower size)
Some observation
- For pre1>0 condition (contains most of events)
yield in Monte-Carlo for eta > 1.5 case
is about factor of two different than that from pp2006 data,
while for eta < 1.5 Monte-Carlo yield agrees with data within 10-15%.
This could be due to trigger effect? - For pre1=0 case yiled for both eta > 1.5 and eta < 1.5 are different in data and MC
This could be due to migration of counts from pre1=0 to pre1>0
in pp2006 data due to more material budget than it is Monte-Carlo - For pre1=0 condition pp2006 data shapes are not reproduced by gamma-jet Monte-Carlo.
With a larger cluster size (2x1 -> 3x3) the pp2006 and MC gamma-jet shapes
are getting closer to each other. - For pre1>0 condition (with statistics available),
pp2006 data shapes are consistent with QCD Monte-Carlo.
Cluster energy fraction in 0.7 radius: detector eta < 1.5
Energy fraction in NxN cluster within r=0.7 radius: detector eta < 1.5
Figure 1a: 2x1/0.7 energy fraction [number of counts per given fraction]
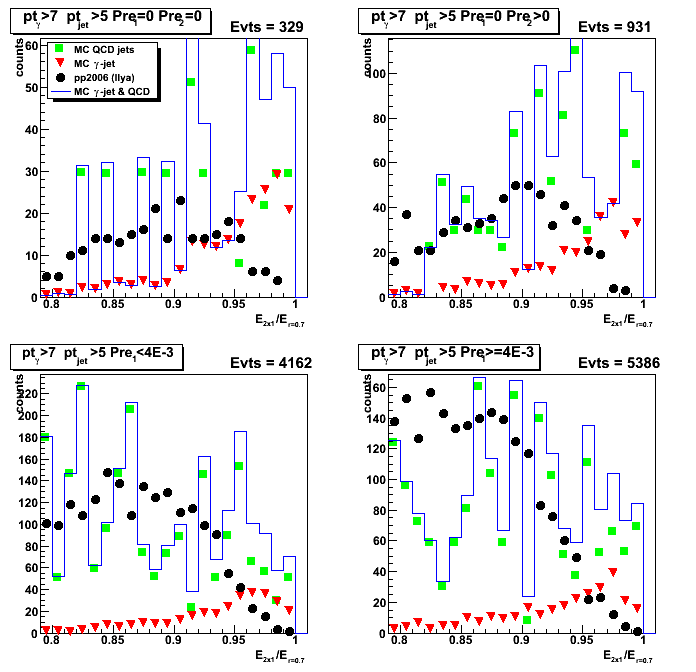
Figure 2a: 2x2/0.7 energy fraction [number of counts per given fraction]
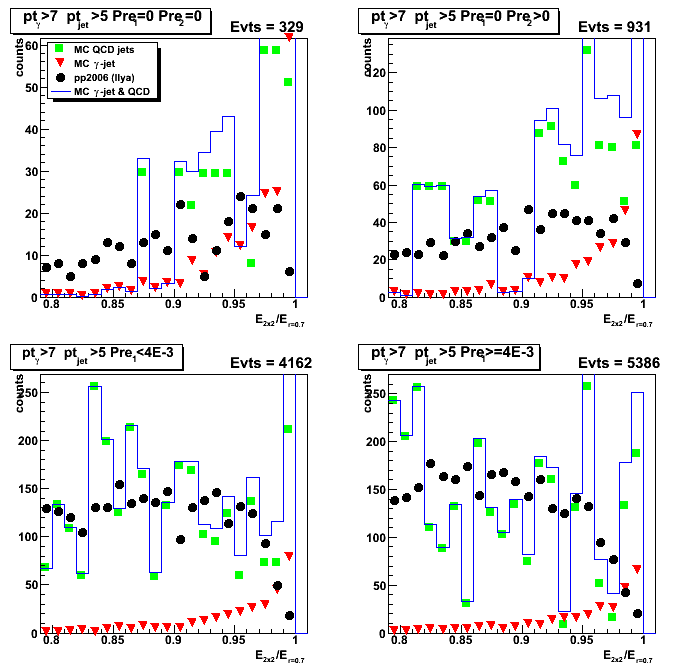
Figure 3a: 3x3/0.7 energy fraction [number of counts per given fraction]

Yield vs. NxN cluster energy fraction in r=0.7: detector eta < 1.5
Figure 4a: 2x1/0.7 energy fraction [yield]
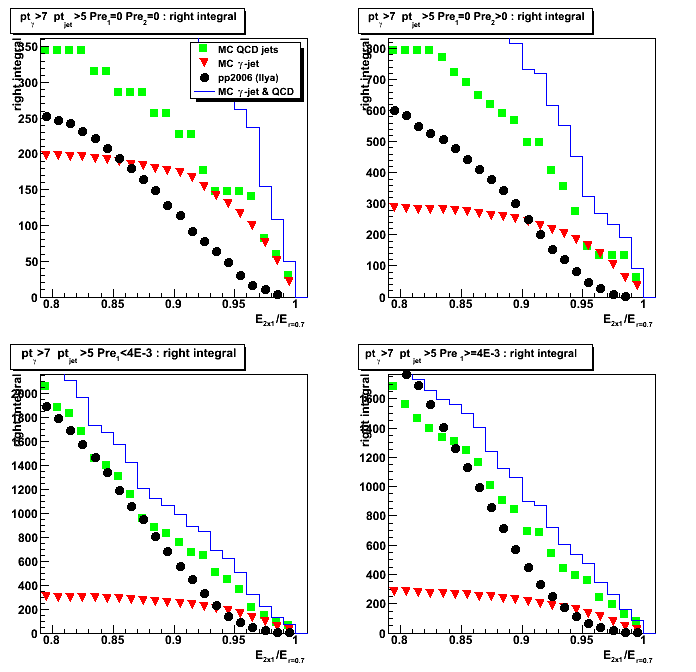
Figure 5a: 2x2/0.7 energy fraction [yield]
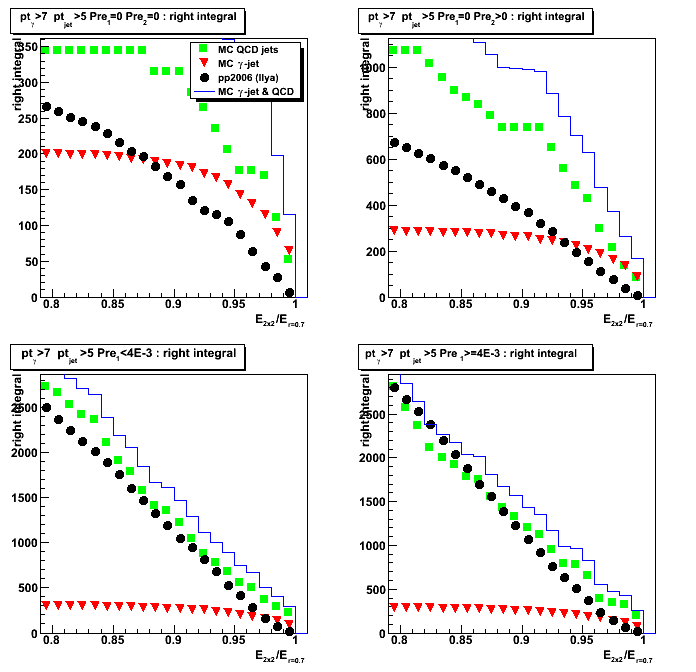
Figure 6a: 3x3/0.7 energy fraction [yield]
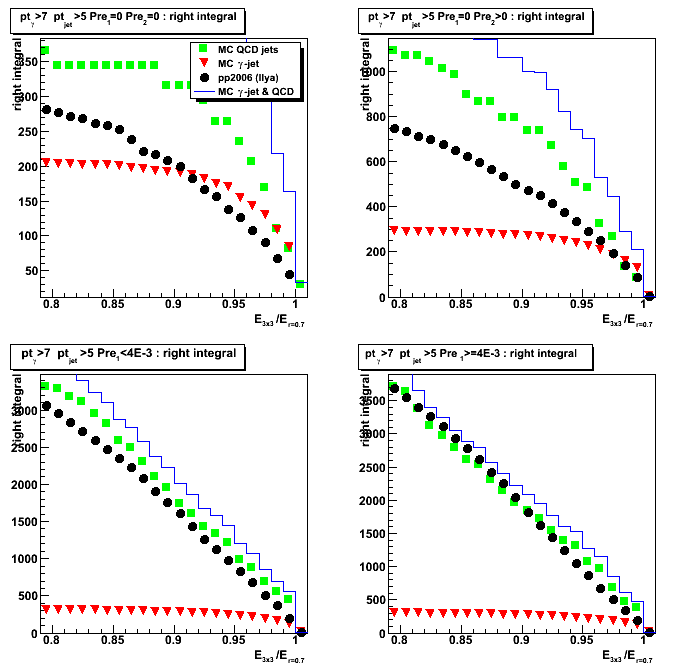
Cluster energy fraction in 0.7 radius: detector eta > 1.5
Energy fraction in NxN cluster within r=0.7 radius: detector eta < 1.5
Figure 1a: 2x1/0.7 energy fraction [number of counts per given fraction]

Figure 2a: 2x2/0.7 energy fraction [number of counts per given fraction]
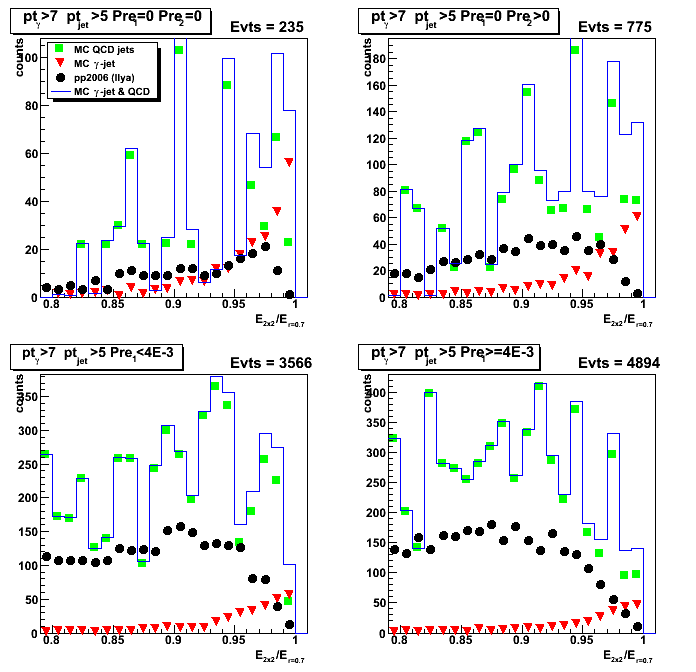
Figure 3a: 3x3/0.7 energy fraction [number of counts per given fraction]
Yield vs. NxN cluster energy fraction in r=0.7: detector eta < 1.5
Figure 4a: 2x1/0.7 energy fraction [yield]
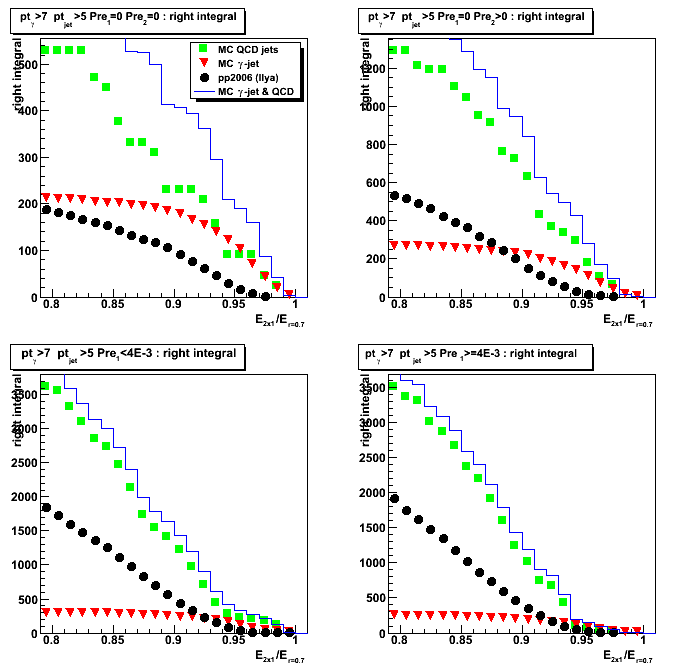
Figure 5a: 2x2/0.7 energy fraction [yield]
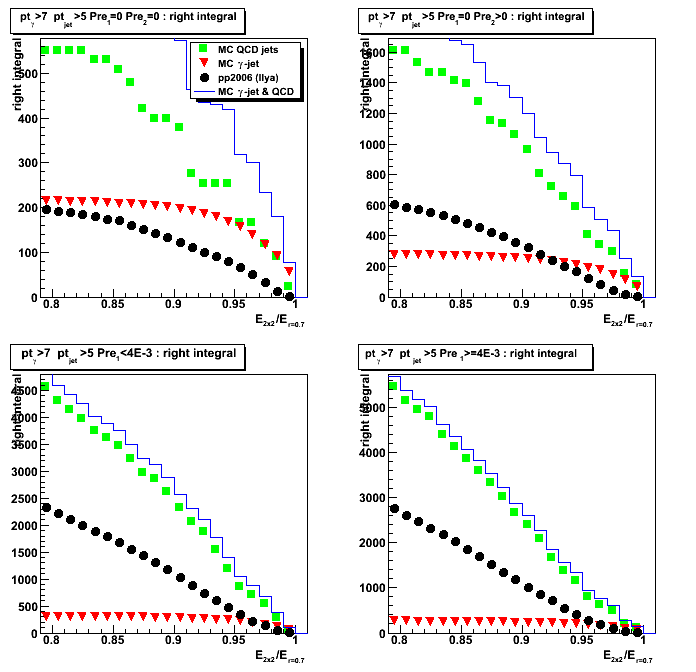
Figure 6a: 3x3/0.7 energy fraction [yield]

Cluster energy fraction in 3x3 patch: detector eta < 1.5
Energy fraction from NxN cluster in 3x3 patch: detector eta < 1.5
Figure 1a: 2x1/3x3 energy fraction [number of counts per given fraction]

Figure 2a: 2x2/3x3 energy fraction [number of counts per given fraction]
Yield vs. NxN cluster energy fraction in 3x3 patch: detector eta < 1.5
Figure 4a: 2x1/3x3 energy fraction [yield]
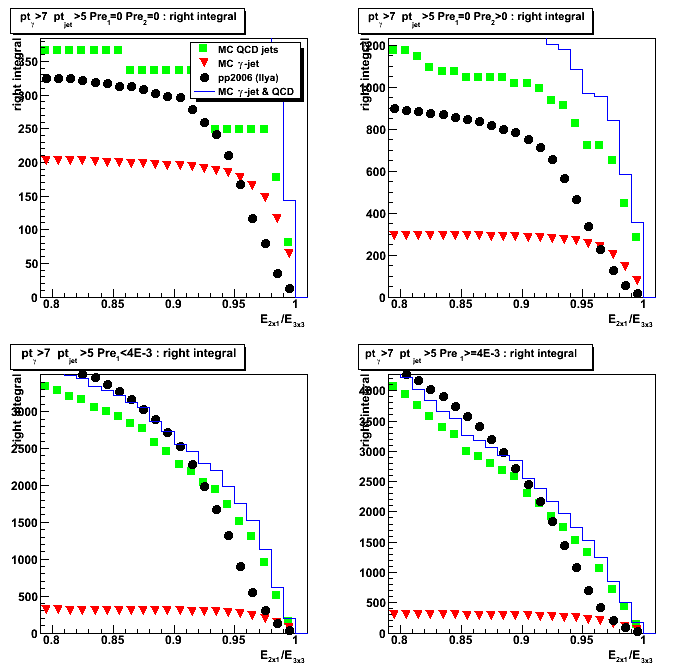
Figure 5a: 2x2/3x3 energy fraction [yield]
Cluster energy fraction in 3x3 patch: detector eta > 1.5
Energy fraction from NxN cluster in 3x3 patch: detector eta > 1.5
Figure 1a: 2x1/3x3 energy fraction [number of counts per given fraction]

Figure 2a: 2x2/3x3 energy fraction [number of counts per given fraction]
Yield vs. NxN cluster energy fraction in 3x3 patch: detector eta > 1.5
Figure 4a: 2x1/3x3 energy fraction [yield]

Figure 5a: 2x2/3x3 energy fraction [yield]

2008.11.25 Yiled vs. analysis cuts: eta dependence
Ilya Selyuzhenkov November 25, 2008
Data sets:
- pp2006 - STAR 2006 pp longitudinal data (~ 3.164 pb^1)
- gamma-jet[gamma-filtered] - data-driven Prompt Photon [p6410EemcGammaFilter] events.
Partonic pt range 2-25 GeV. - QCD jets[gamma-filtered] - data-driven QCD [p6410EemcGammaFilter] events.
Partonic pt range 2-25 GeV.
Some observation
- Fig. 1 [upper&lower left, 3rd bin] indicates that
cluster energy isolation is the most important cut
for signal/background separation - Fig.1 [lower right, 3rd bin] shows that
R_cluster cut is independent from (or orthogonal to) other cuts - Fig.1 [upper&lower left 4th bin] shows that
cut on neutral energy fraction for the away side jet
rejects more signal that background events
We probably need to reconsider that cut - Fig.2 [lower left, 5th bin] shows that
charge particle veto significantly improves
signal to background ratio - Fig.3 [lower left, 5th bin] shows that
in the region were we do not have TPC tracking (photon eta > 1.5)
charge particle veto is not efficient,
although there is still some improvement from this cut.
This probably due to tracks with eta <1.5
which fall into large isolation radius r=0.7.
Fig.2 [lower right, 5th bin] shows that
charge particle veto also independent from other cuts
Yield vs. various analysis cuts
List of cuts (sorted according to bin number in Figs. 1-3. [No SMD sided residual cuts]):
- N_events : total number of di-jet events found by the jet-finder
- cos(phi_gamma - phi_jet) < -0.8 : gamma-jet opposite in phi
- R_{3x3cluster}: Energy in 3x3 cluster of EEMC tower to the total jet energy
R_{3x3cluster}>0.9 for Fig. 1, and it is disabled in Fig. 2 and 3 - R_EM^jet < 0.9 : neutral energy fraction cut for on away side jet
- N_ch=0 : no charge tracks associated with a gamma candidate
- N_bTow = 0 : no barrel towers associated with a gamma candidate (gamma in the endcap)
- N_(5-strip cluster)^u > 2 : minimum number of strips in EEMC SMD u-plane cluster around peak
- N_(5-strip cluster)^v > 2 : minimum number of strips in EEMC SMD v-plane cluster around peak
- gamma-algo fail : my algorithm failed to match tower with SMD uv-intersection, etc...
- Tow:SMD match : SMD uv-intersection has a tower which is not in a 3x3 cluster
Figure 1: Number of accepted events vs. various analysis cuts
The starting number of events (shown in first bin of the plots) is
the number of di-jets with reconstructed gamma_pt>7 GeV and jet_pt>5 GeV
upper left: cuts applied independently
upper right: expept this cut fired
(event passed all other cuts and being rejected by this cut)
lower left: "cuts applied independently" normalized by the total number of events
lower right: "expept this cut fired" normalized by the total number of events

Figure 2: Same as Fig.1 except: no R_cluster cut and photon detector eta < 1.5
(eta region where we do have most of the TPC tracking)
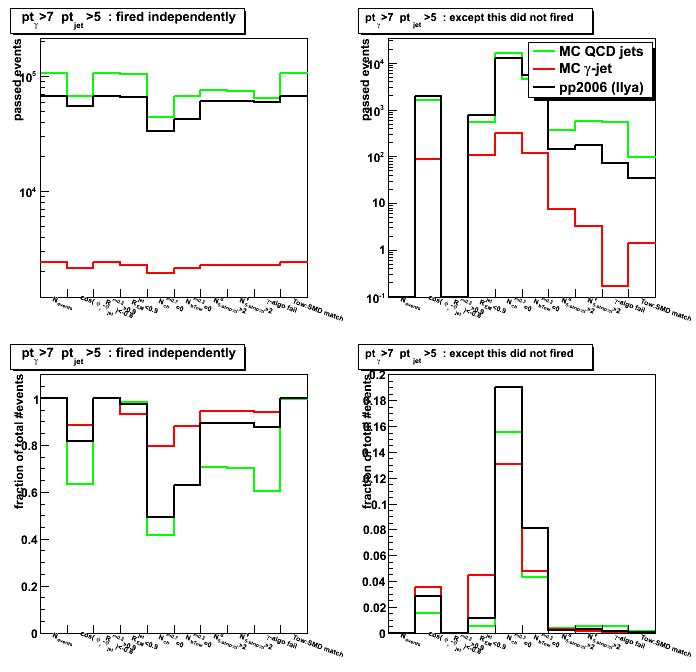
Figure 3: Same as Fig.1 except: no R_cluster cut and photon detector eta > 1.5
