2008.11.18 Cluster isolation cuts: 2x1 vs. 2x2 vs. 3x3
Ilya Selyuzhenkov November 18, 2008
Data sets:
- pp2006 - STAR 2006 pp longitudinal data (~ 3.164 pb^1)
after applying gamma-jet isolation cuts (no R_cluster cut applied for this study). - gamma-jet[gamma-filtered] - data-driven Prompt Photon [p6410EemcGammaFilter] events.
Partonic pt range 2-25 GeV. - QCD jets[gamma-filtered] - data-driven QCD [p6410EemcGammaFilter] events.
Partonic pt range 2-25 GeV.
2x1, 2x2, and 3x3 clusters definition:
- 3x3 cluster: tower energy sum for 3x3 patch around highest tower
- 2x2 cluster: tower energy sum for 2x2 patch
which are closest to 3x3 tower patch centroid.
3x3 tower patch centroid is defined based
on tower energies weighted wrt tower centers:
centroid = sum{E_tow * r_tow} / sum{E_tow}.
Here r_tow=(x_tow, y_tow) denotes tower center. - 2x1 cluster: tower energy sum for high tower plus second highest tower in 3x3 patch
- r=0.7 energy is calculated based on towers
within a radius of 0.7 (in delta phi and eta) from high tower
Cuts applied
all gamma-jet candidate selection cuts except 3x3/r=0.7 energy isolation cut
Results for 2x1, 2x2, and 3x3 clusters
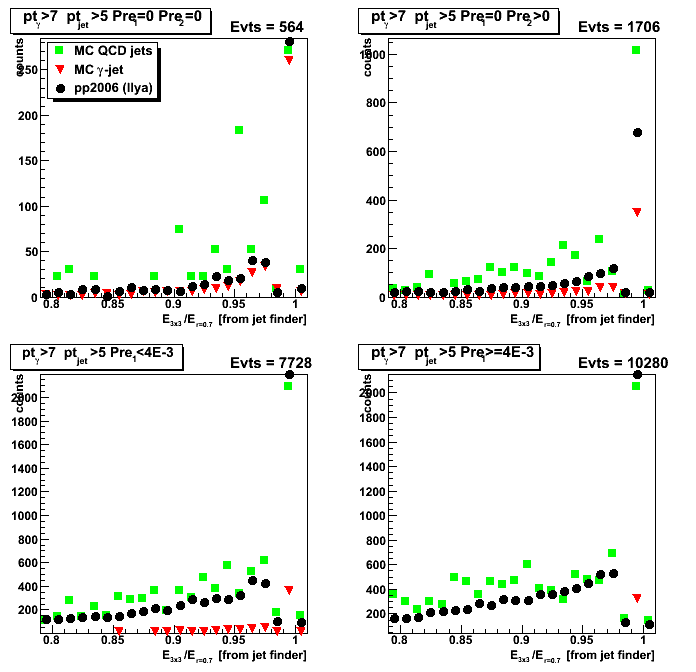
- Energy fraction in NxN cluster in r=0.7 radius
2x1, 2x2, 3x3 patch to jet radius of 0.7 energy ratios - Yield vs. NxN cluster energy fraction in r=0.7
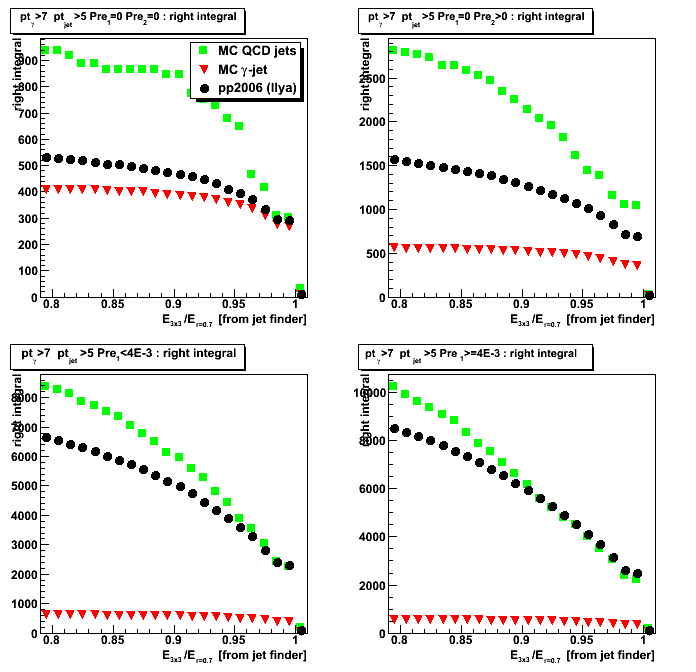
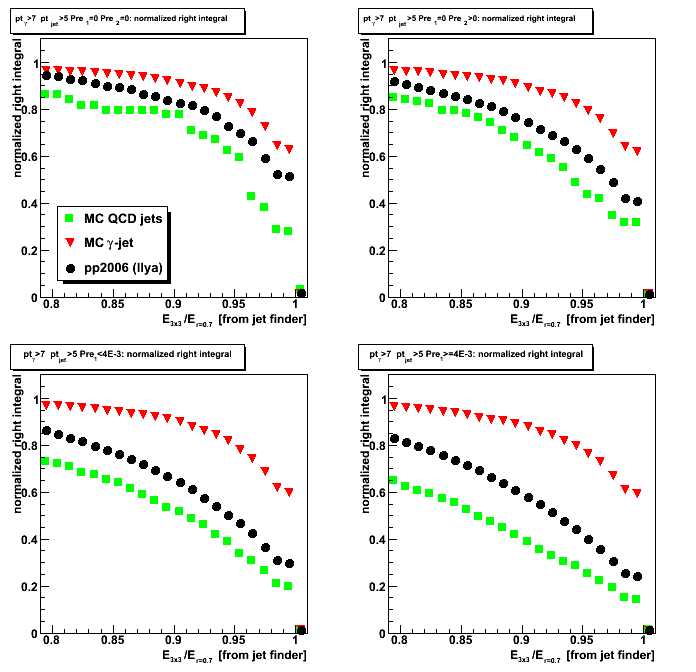
For a given cluster energy fraction yield is defined as an integral on the right - Efficiency vs. NxN cluster energy fraction in r=0.7
For a given cluster energy fraction
efficiency is defined as the yield (on the right)
normalized by the total integral (total yield)
Efficiency vs. NxN cluster energy fraction in r=0.7
Efficiency vs. NxN cluster energy fraction in r=0.7
Figure 1b: 2x1/0.7 ratio
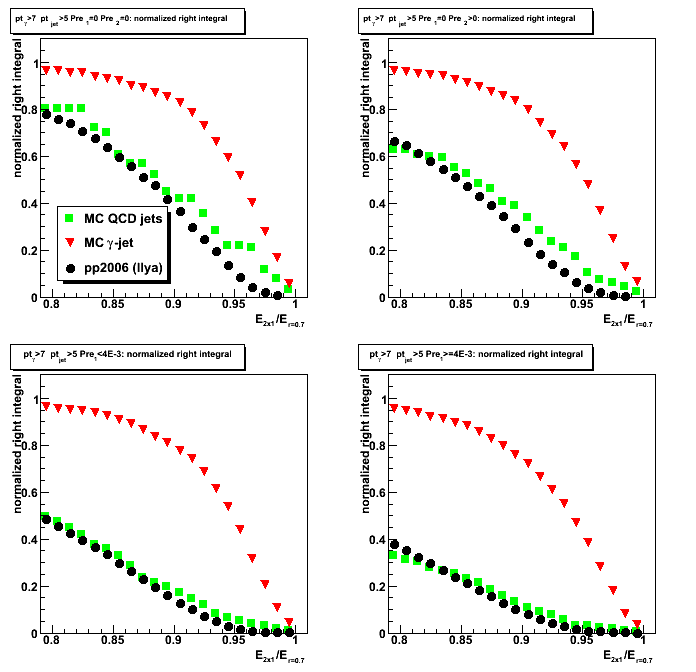
Figure 2b: 2x2/0.7 ratio
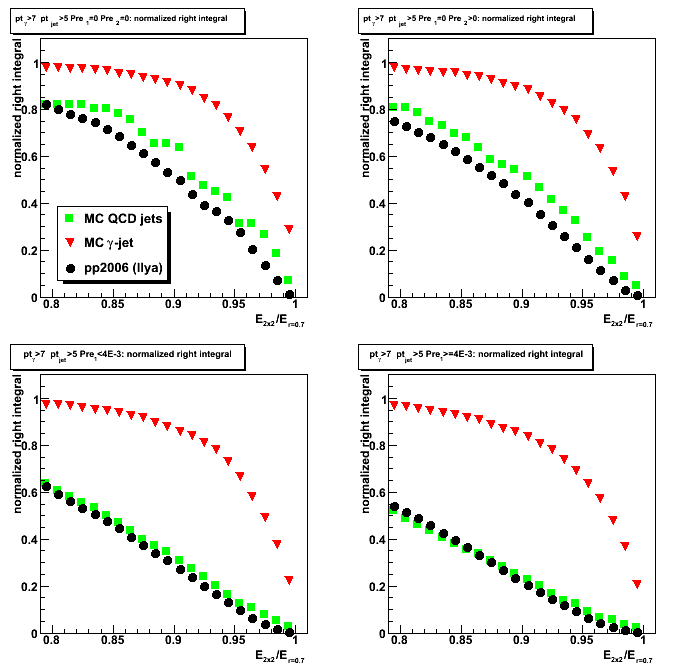
Figure 3b: 3x3/0.7 ratio
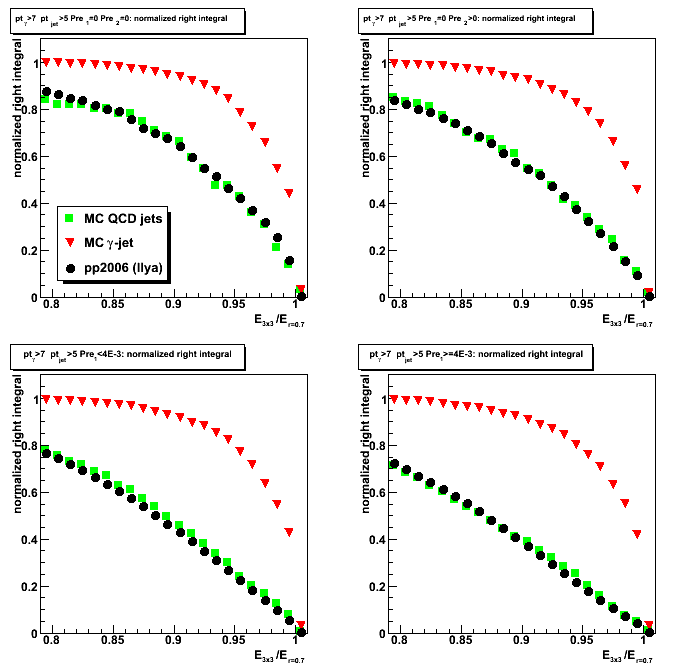
Figure 4b: 3x3/0.7 ratio but only using towers which passed jet finder threshold
Energy fraction in NxN cluster within r=0.7 radius
Energy fraction in NxN cluster within r=0.7 radius
Figure 1a: 2x1/0.7 ratio
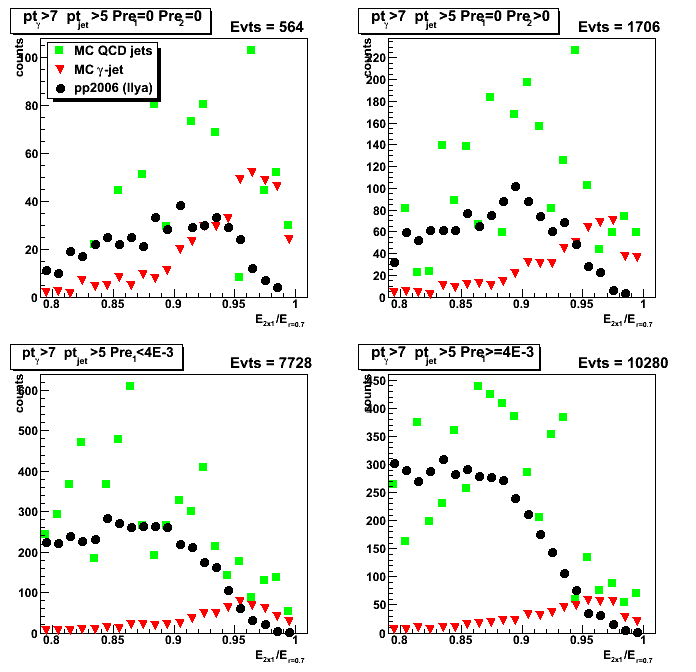
Figure 2a: 2x2/0.7 ratio
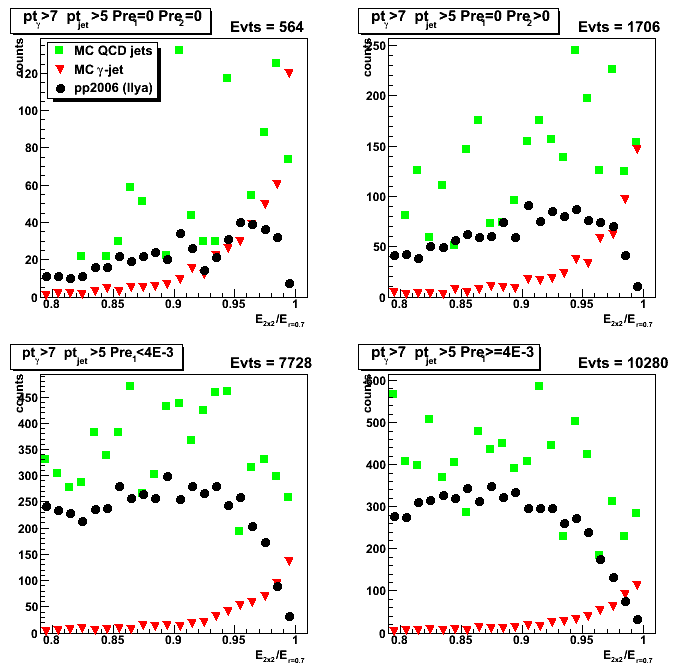
Figure 3a: 3x3/0.7 ratio
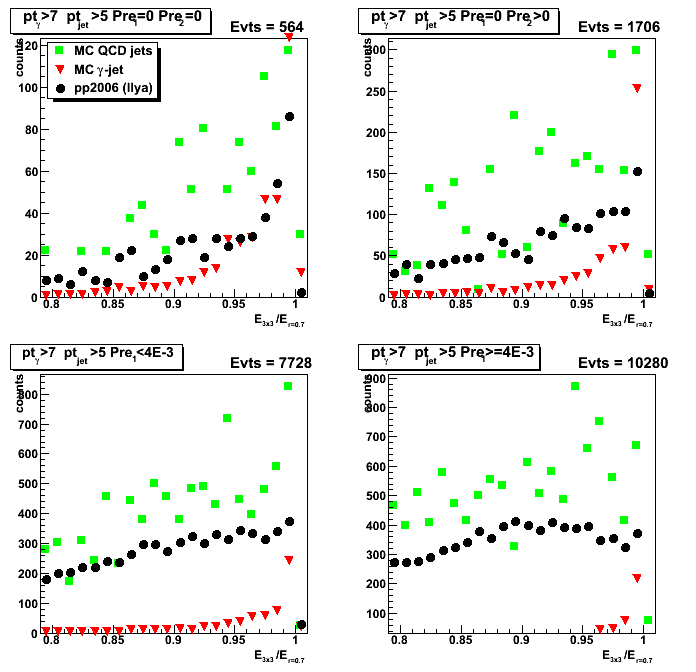
Figure 4a: 3x3/0.7 ratio but only using towers which passed jet finder threshold
Yield vs. NxN cluster energy fraction in r=0.7
Yield vs. NxN cluster energy fraction in r=0.7
Figure 1c: 2x1/0.7 ratio
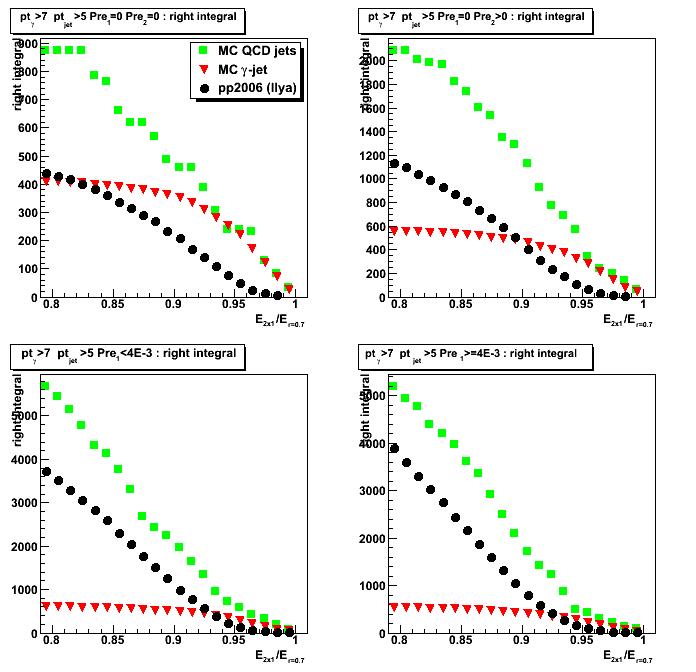
Figure 2c: 2x2/0.7 ratio

Figure 3c: 3x3/0.7 ratio
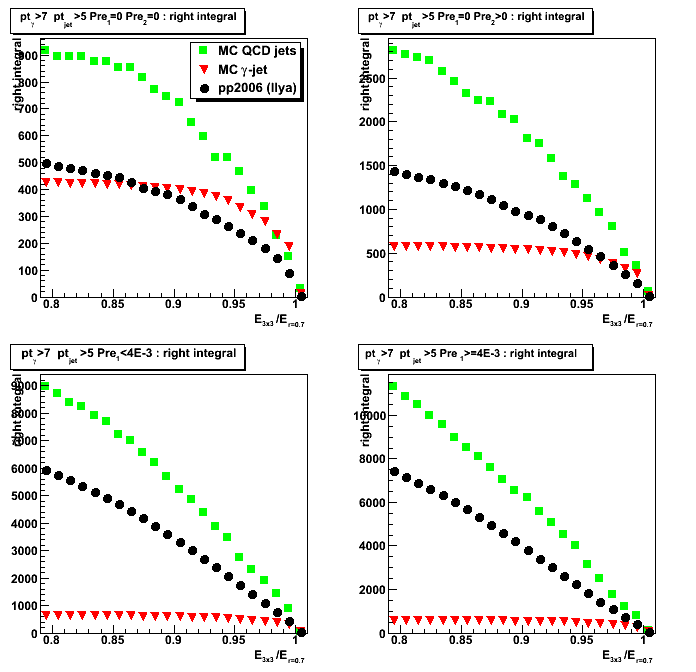
Figure 4c: 3x3/0.7 ratio but only using towers which passed jet finder threshold