2009.02.09 pp2006, pp2008, amd mc2006 comparison
Ilya Selyuzhenkov February 06, 2009
Data sets
- pp2006 - STAR 2006 pp longitudinal data (~ 3.164 pb^1)
Trigger: eemc-http-mb-L2gamma [id:137641] - mc2006: gamma-jet+QCD jets [p6410EemcGammaFilter] events.
- pp2008 - STAR 2008 pp data
Trigger: etot-mb-l2 [id:7]
Partonic pt range 2-25 GeV.
Cuts applied
- Di-jet events
- Require to reconstruct photon momentum (no gamma-jet isolation cuts)
- Gamma pt > 7GeV, jet pt > 7GeV
- L2gamma emulation in Monte-Carlo
- L2gamma triggered for pp2006 and pp2008 events
- cos (phi_jet - phi_gamma) < -0.8
- detector |eta_jet|< 0.8
- |v_z| < 100
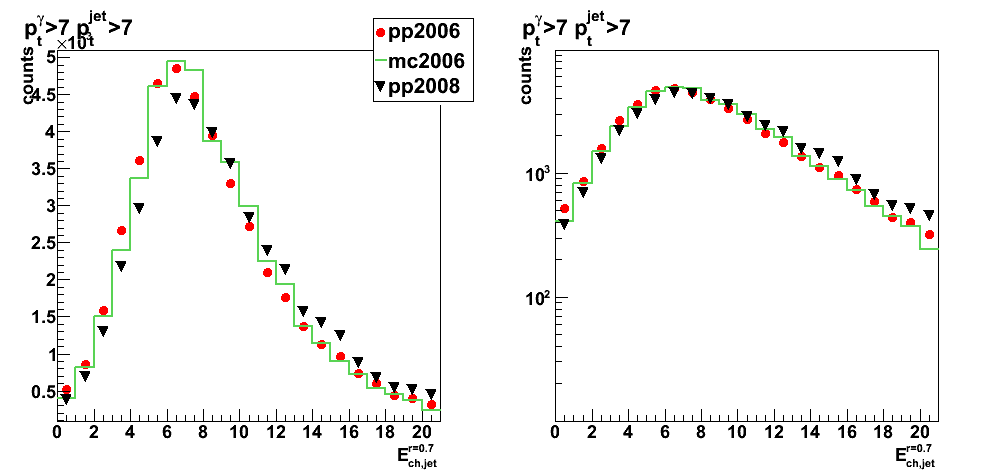
Figures
Each figure has:
- All pre-shower conditions combined, No pre-shower cuts
- Red circles show pp2006 data
- Black triangles show pp2008 data
Data scaled to match the integraled yield from pp2006 data - Green line shows MC sum: QCD + gamma-jet
Monte-Carlo results for QCD and gamma-jet samples are first
scaled to 3.164 pb^-1 according to Pythia luminosity,
added together, and then an additional fudge factor of 1.24 applied.
Fudge factor is defined as pp2006 to Monte-Carlo sum ratio
for pt_jet>7GeV and pt_gamma>7 candidates
Kinematics
Figure 1: vertex z
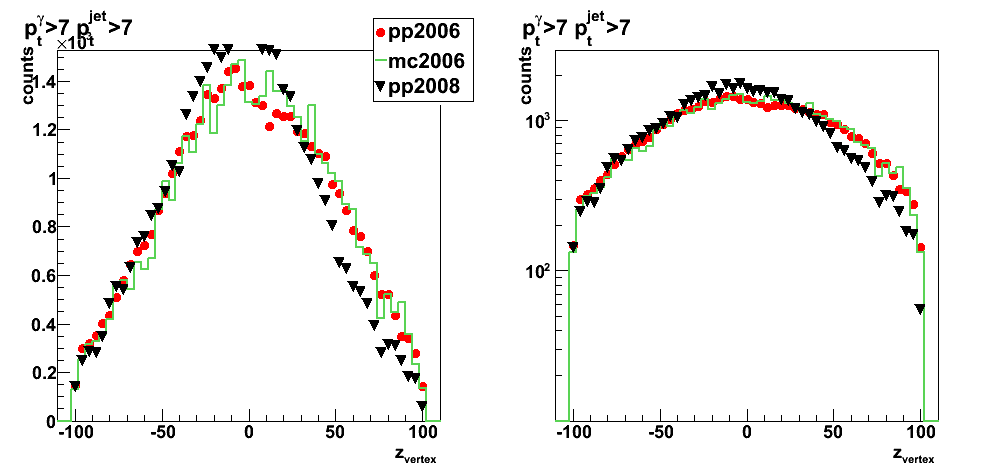
Figure 2: photon detector eta
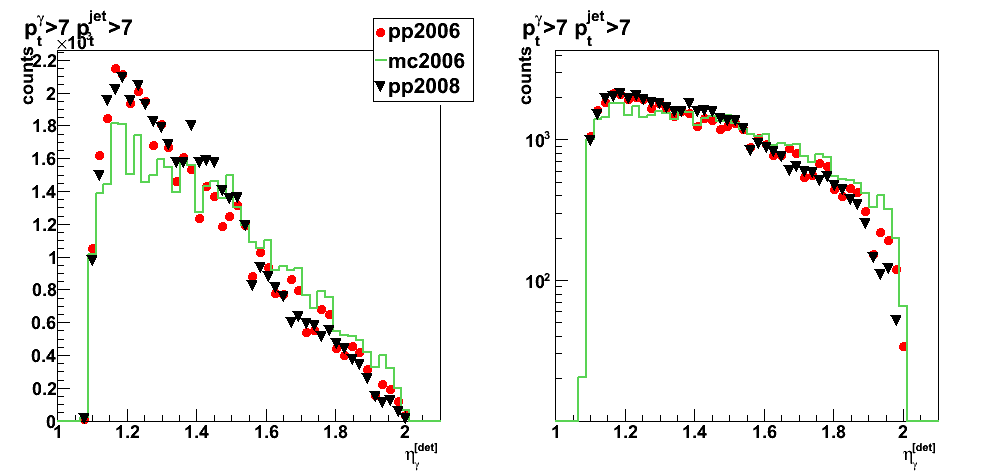
Figure 3: jet detector eta

Figure 4: photon pt

Figure 5: jet pt

Figure 6: gamma-jet pt balance
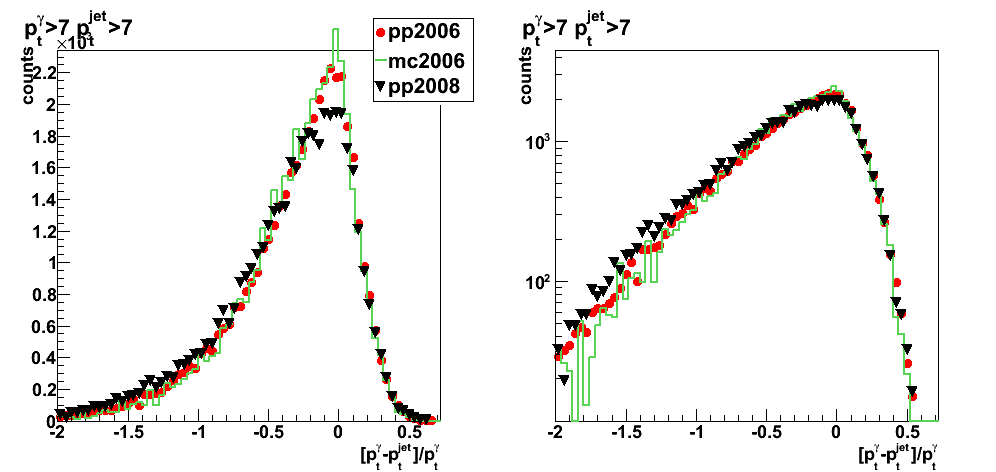
Figure 7: Photon neutral energy fraction
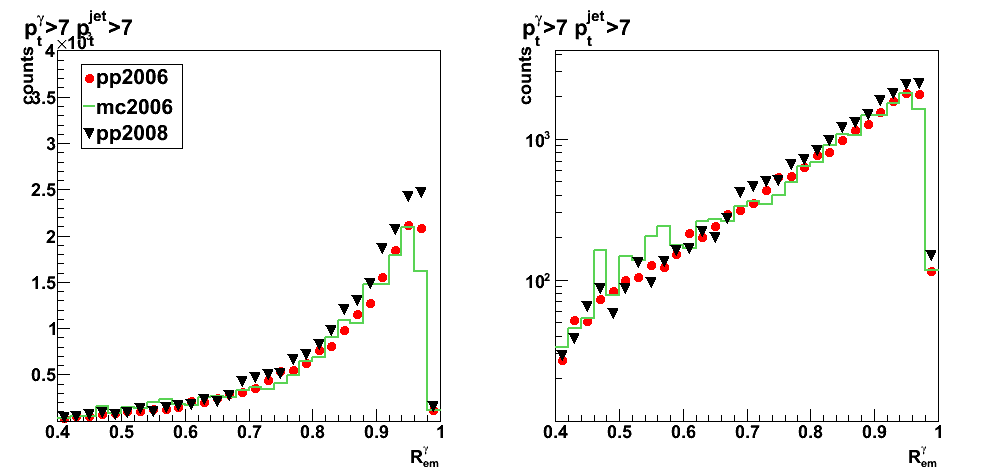
Figure 8: Jet neutral energy fraction

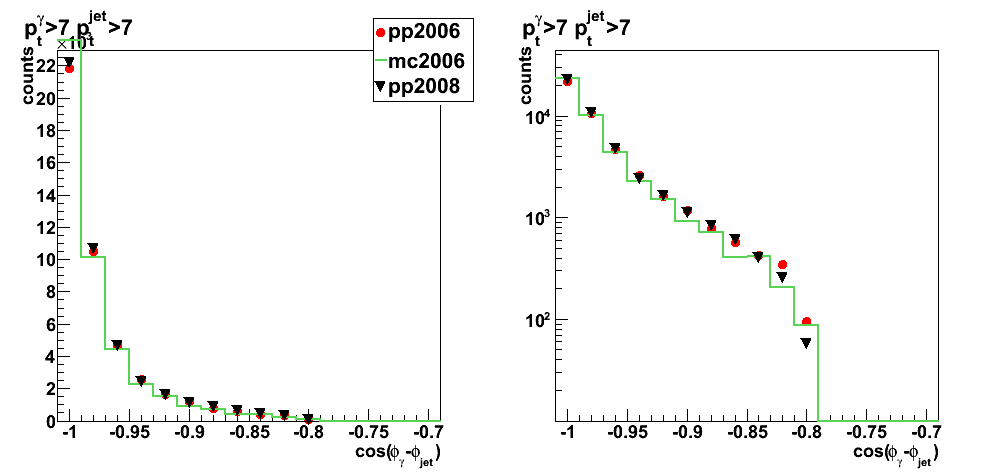
Figure 9: cos(phi_gamma-phi_jet)
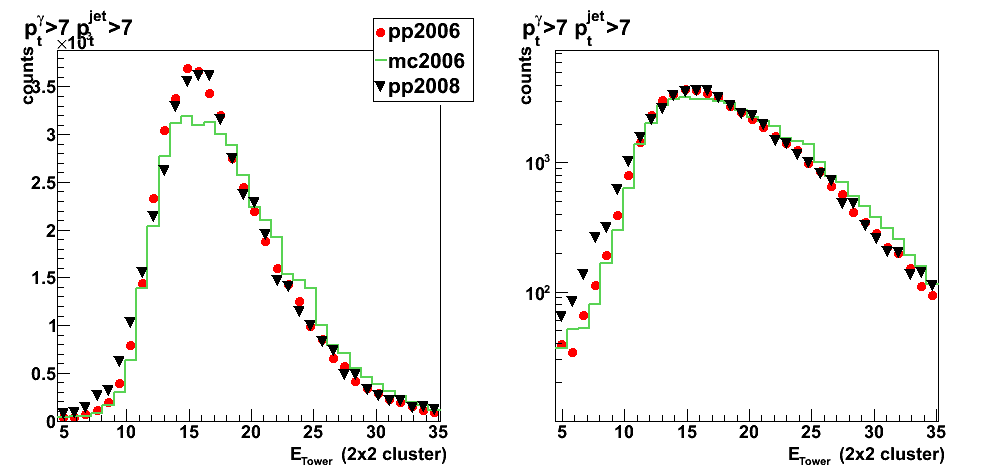
Photon candidate's 2x1, 2x2, and 3x3 tower cluser energy
Figure 10: 3x3 cluster energy
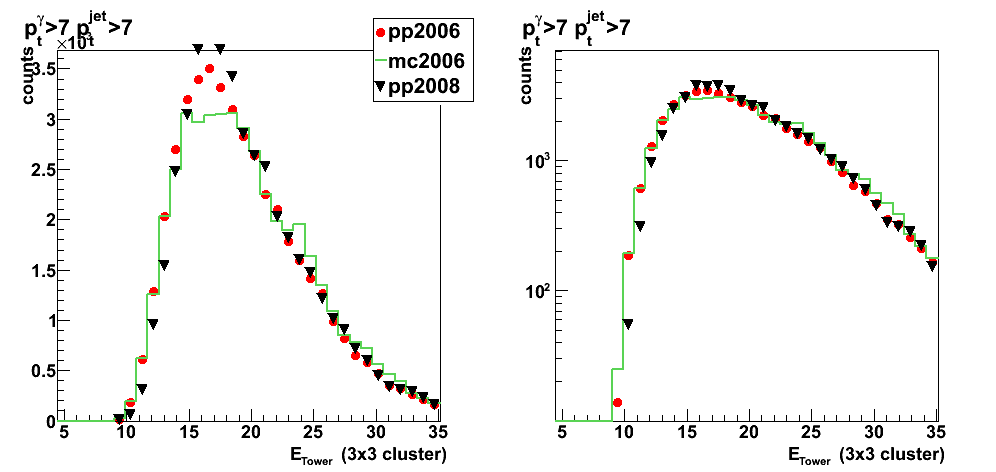
Figure 11: 2x1 cluster energy
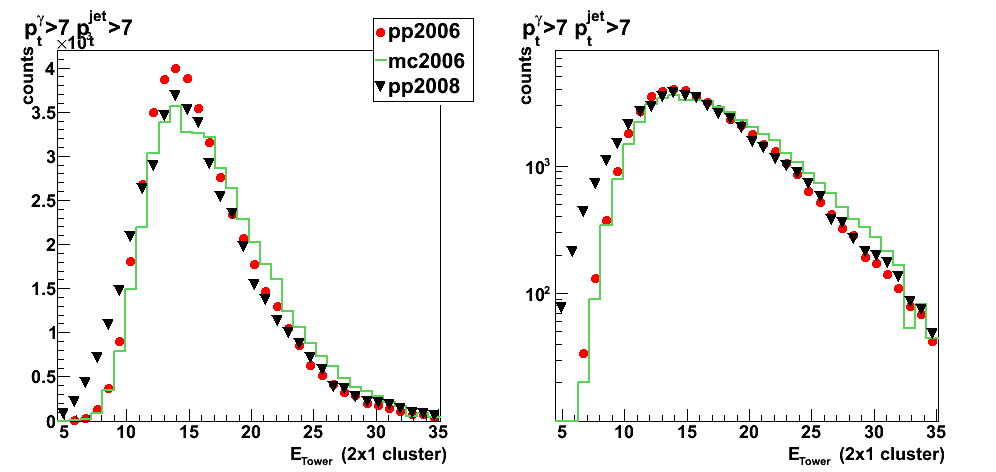
Figure 12: 2x2 cluster energy
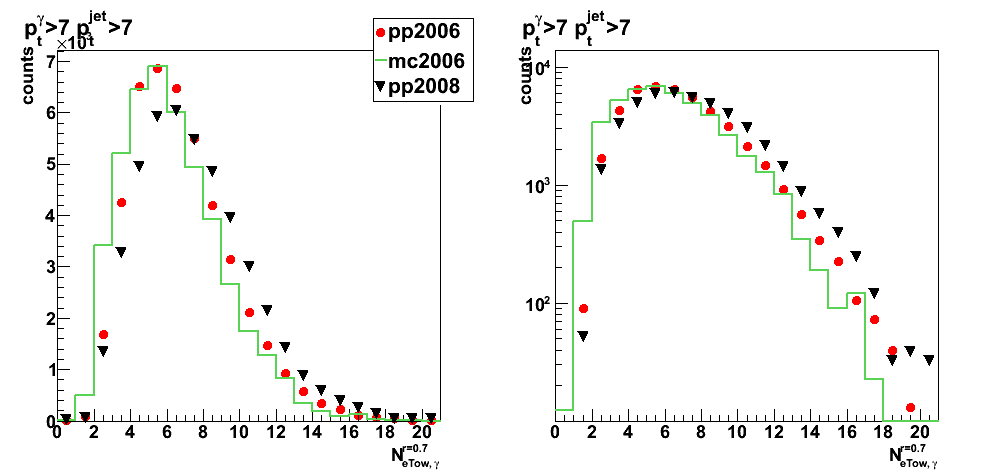
Number of charge tracks, Barrel and Endcap towers within r=0.7 for photon and gamma
Figure 13: Number of charged track associated with photon candidate

Figure 14: Number of Barrel towers associated with photon candidate
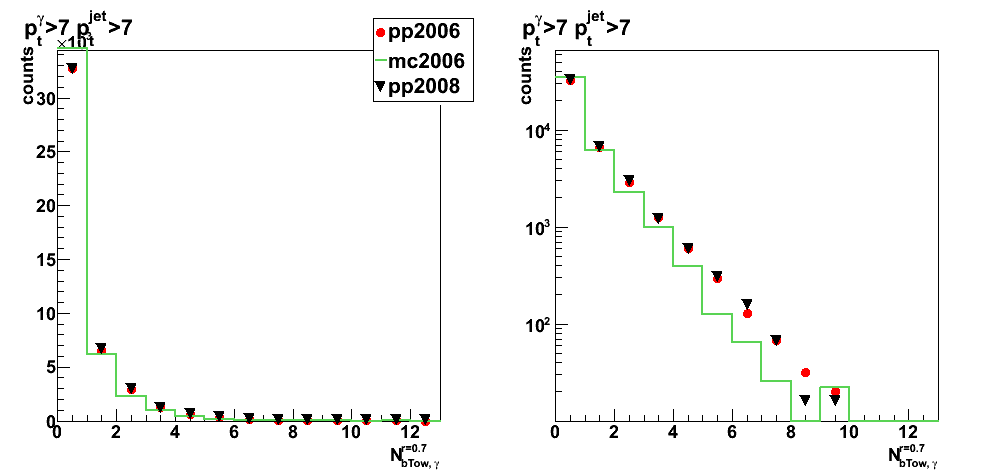
Figure 15: Number of Endcap towers associated with photon candidate
Jet energy composition
Figure 16: Jet energy part from Barrel towers
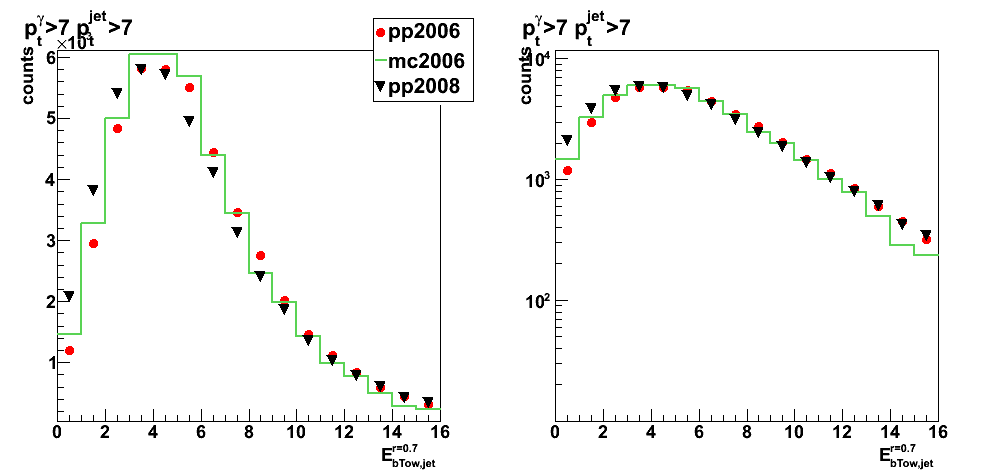
Figure 17: Jet energy part from charge tracks