05 Absolute Calibration from Electrons
We use the MIP ADC location calculated in part 03 to get a preliminary measure of the energy scale for each tower.
The following formula from SN436 provides the calibration coefficient:
C = ![]()

where E = C * (ADC - ped).
For the electron sample I select tracks with:
- 1.5 < p < 6.0 (GeV)
- dR < 0.0125 (from center of face of tower in eta/phi space)
- adc - ped > 2.5 * ped_rms in tower
- nHits > 10
- nSigmaElectron > -1
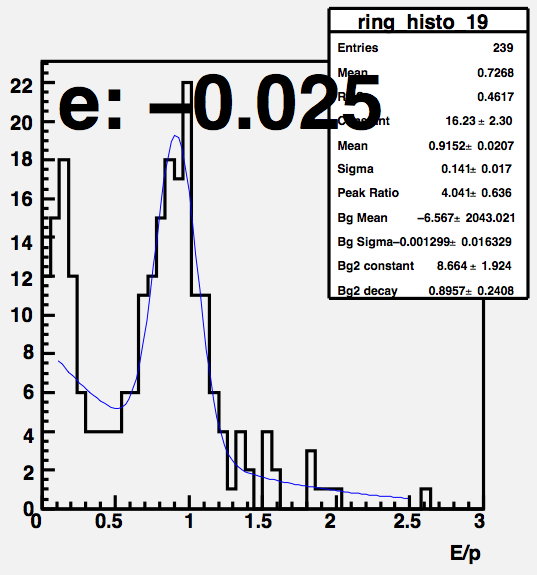
Here is one of the E/p distributions. Note the error on the mean is about 2%, which is about average.

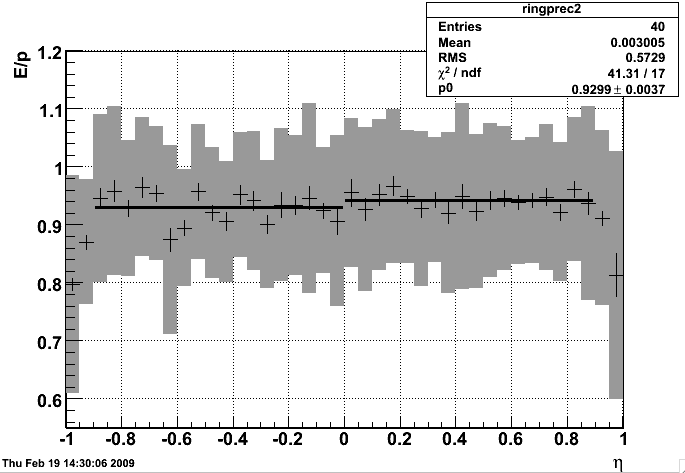
For each electron we calculate E/p and sum over eta rings. Here is the peak of E/p for each eta bin. The error bars show the error on the mean value, and the shaded bar is the sigma. I fit over the range [-0.9,0.0] and [0.0,0.9] separately. The fit for the east reports the mean is 0.9299 +/- 0.0037. For the west, I get 0.9417 +/- 0.0035.

The location of the E/p peak tells us the correction that needs to be applied to the calibration coefficients of towers in each eta ring to get the correct absolute energy.
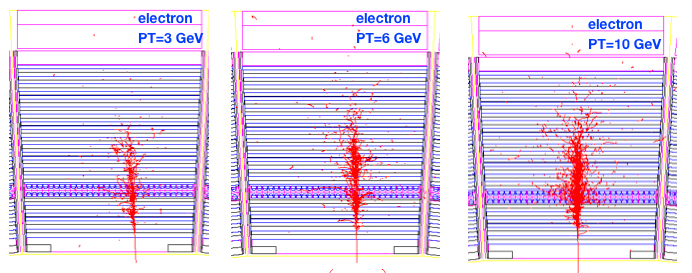
Reference plot (electron showers):
