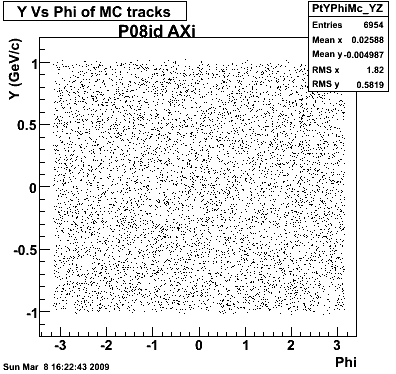
P08id (AXi -> RecoPiPlus)
AXi-> Lamba + Pion + ->P + Pion - + Pion +
(03 08 2009)
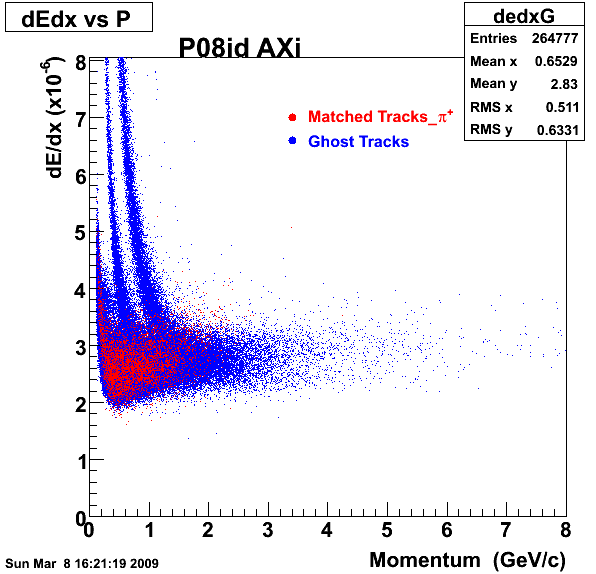
1. Dedx
2.Dca
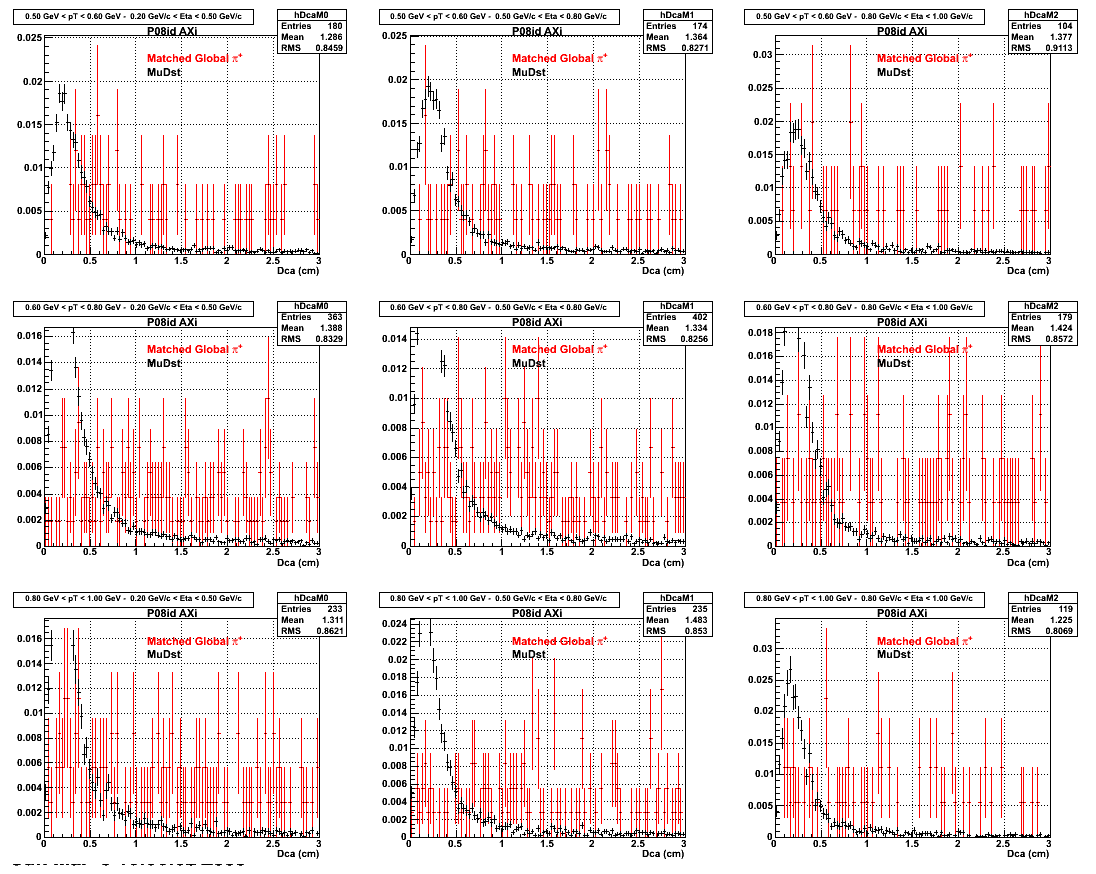
An original 3D histogram had been created and filled with pT, Eta and DCA as the 3 coordinates. Projection on PtBins and EtaBins had been made to create this "matrix" of plots.
Pt Bin array used : { 0.5, 0.6, 0.8, 1.0} (moves down) and
Eta Bin array : {0.2, 0.5, 0.8, 1.0} (moves to the right)
For the Error bars, i used the option hist->Sumw2();
3. Nfit
Similarly An Original 3D Histogram had been created with Pt, Eta and Nfit as coordinates. Respective projections had been made in the same pT and Eta Bins as the DCa distributions.
Pt Bin array used : { 0.5, 0.6, 0.8, 1.0} (moves down) and
Eta Bin array : {0.2, 0.5, 0.8, 1.0} (moves to the right)
For the Error bars, i used the option hist->Sumw2();

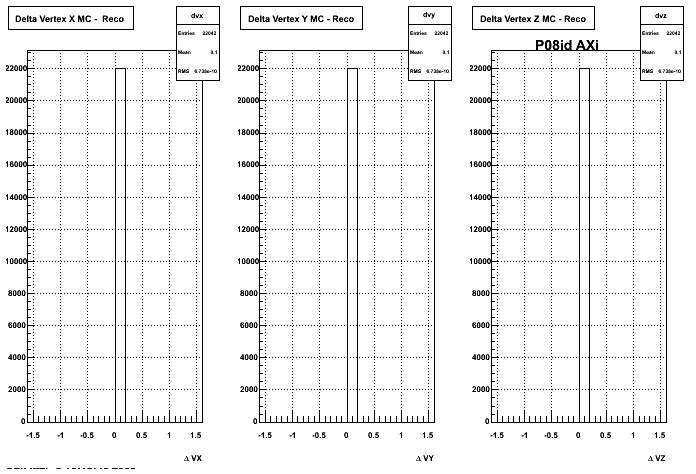
4. Delta Vertex
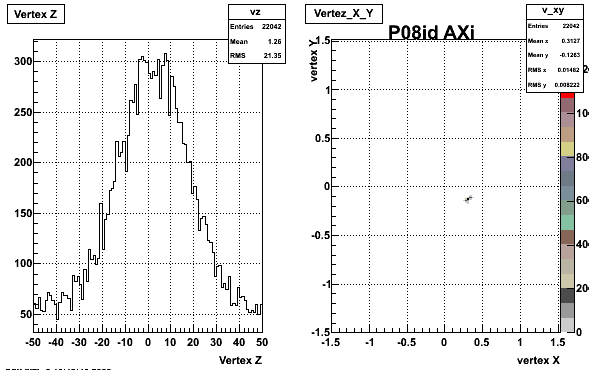
5. Z Vertex and X vs Y vertex
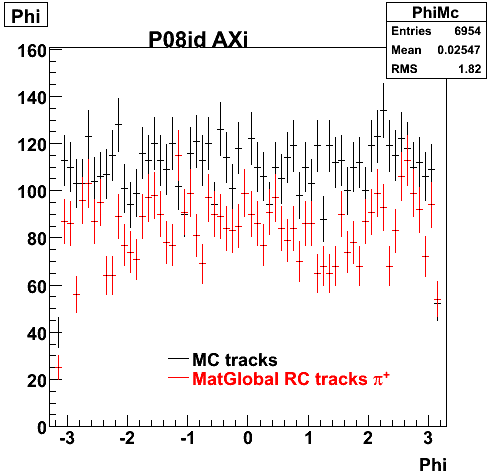
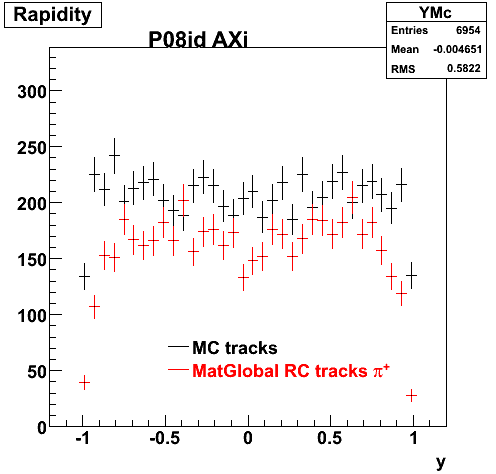
6. Global Variables : Phi and Rapidity
7. pt

8. Randomness

