2009.05.04 LDA: More SMD info, 3x3 tower energy, correlation matrix
Cut optimization with Fisher's LDA classifier
ROOT implementation for LDA:
Application for cuts optimization in the gamma-jet analysis
LDA configuration: default
LDA input parameters Set0:
- Set4 (link for results with LDA Set0-Set3):
- Energy fraction in 3x3 cluster within a r=0.7 radius:
E_3x3/E_0.7 - Photon-jet pt balance:
[pt_gamma-pt_jet]/pt_gamma - Number of charge tracks within r=0.7 around gamma candidate:
Ncharge - Number of Endcap towersL fired within r=0.7 around gamma candidate:
NtowBarrel - Number of Barrel towers fired within r=0.7 around gamma candidate
NtowEndcap - Shower shape analysis: distance to 80% cut line:
distance to cut line - Energy fraction in E_2x1 and E_2x2 witin E_3x3:
E_2x1/E_2x2 and E_2x2/E_3x3 - Energy in post-shower layer under 3x3 tower patch:
E_post^3x3 - Tower energy in 3x3 patch:
E_tow^3x3 - SMD-u energy in 25 central strips:
E_smd-u^25 - SMD-v energy in 25 central strips:
E_smd-v^25 - SMD-v peak energy (in 5 central strips):
E_peak
- Energy fraction in 3x3 cluster within a r=0.7 radius:
The number of strips in SMD u or v planes is required to be greater than 3
Pre-shower sorting (energy in tiles under 3x3 tower patch):
- pre1=0, pre2=0
- pre1=0, pre2>0
- 0 < pre1 < 0.004
- 0.004 < pre1 < 0.01
- pre1 < 0.01
- pre1 >= 0.01
Integrated yields per pre-shower bin:
| sample | total integral | pre1=0,pre2=0 | pre1=0, pre2>0 | 0 < pre1 < 0.004 | 0.004 < pre1 < 0.01 | pre1 < 0.01 | pre1 >= 0.01 |
| photon-jet | 2.5640e+03 | 3.5034e+02 | 5.2041e+02 | 5.6741e+02 | 5.2619e+02 | 1.9644e+03 | 5.9994e+02 |
| QCD | 5.6345e+04 | 1.3515e+03 | 4.3010e+03 | 1.2289e+04 | 1.5759e+04 | 3.3701e+04 | 2.2644e+04 |
| pp2006 | 6.2811e+04 | 6.8000e+02 | 2.4310e+03 | 1.2195e+04 | 1.6766e+04 | 3.2072e+04 | 3.0739e+04 |
Photon pt and rapidity cuts:
- pt>7GeV
- pt>8GeV
- pt>9GeV
- pt>10GeV
- detector eta <1.4 (pt>7GeV)
- detector eta > 1.4 (pt>7GeV)
LDA Set4
Figure 1: LDA discriminant with Set0: Data to Monte-Carlo comparison (pt>7GeV cut)
Right plot for each pre-shower condition shows the ratio of pp2006 data to sum of the Monte-Carlo samples
Colour coding:
black pp2006 data, red gamma-jet MC, green QCD MC, blue gamma-jet+QCD
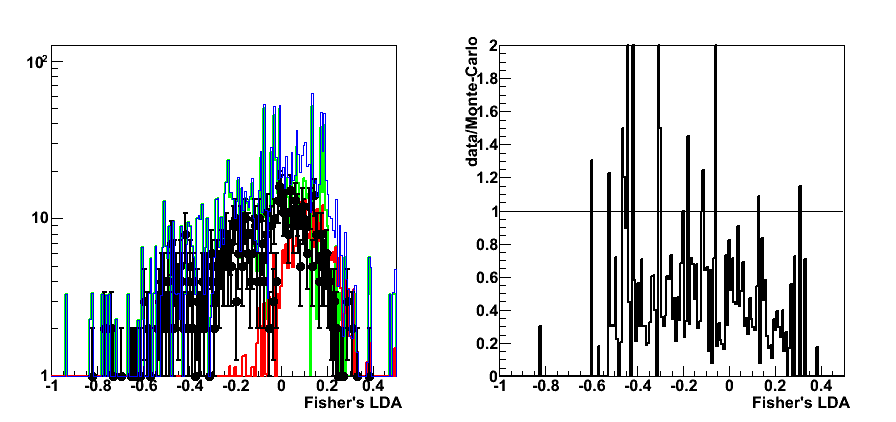
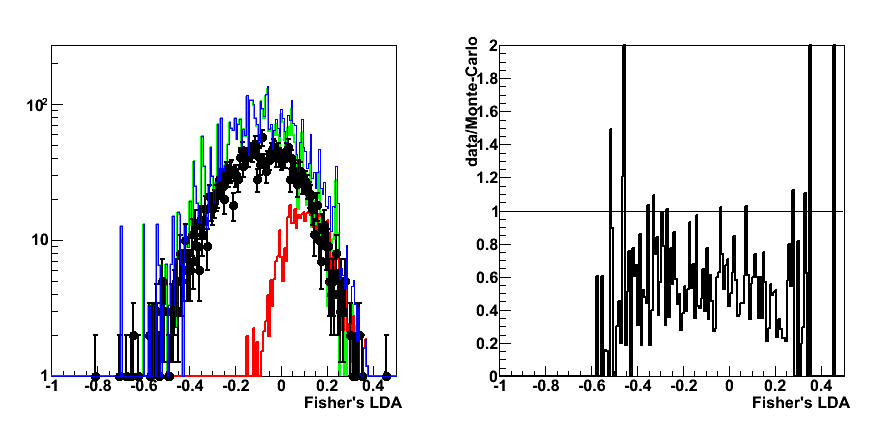
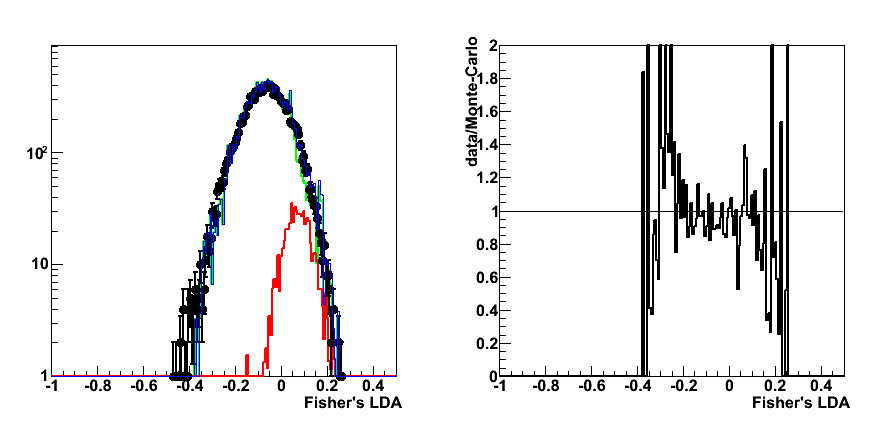
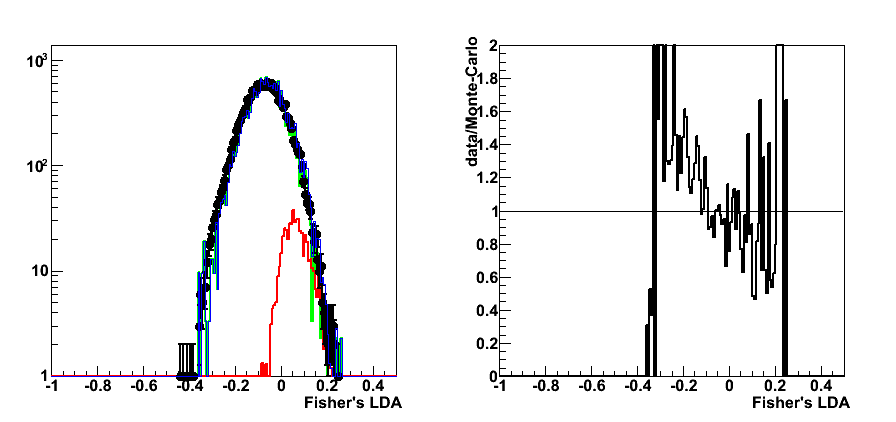
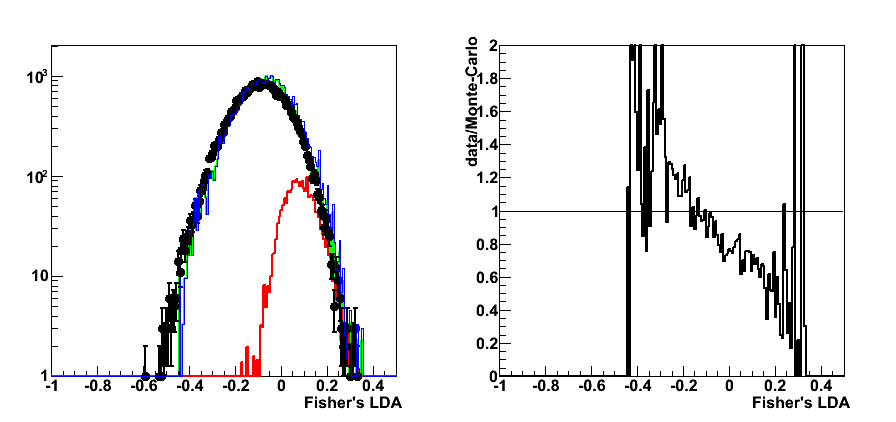
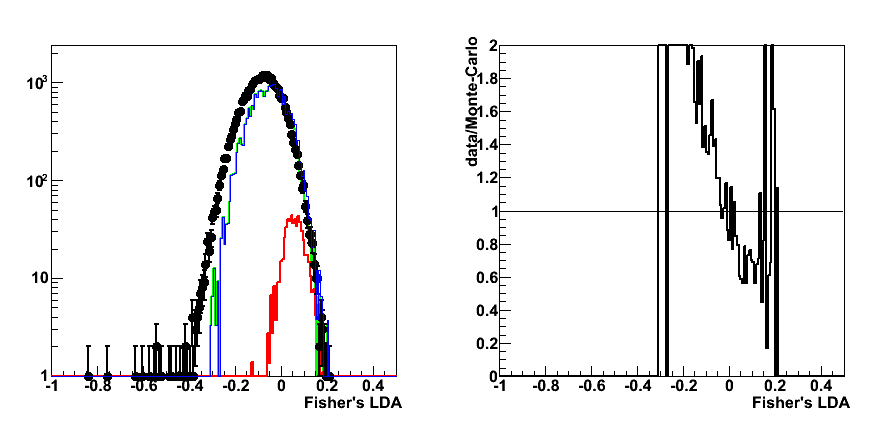
Figure 2: rejection vs. efficiency
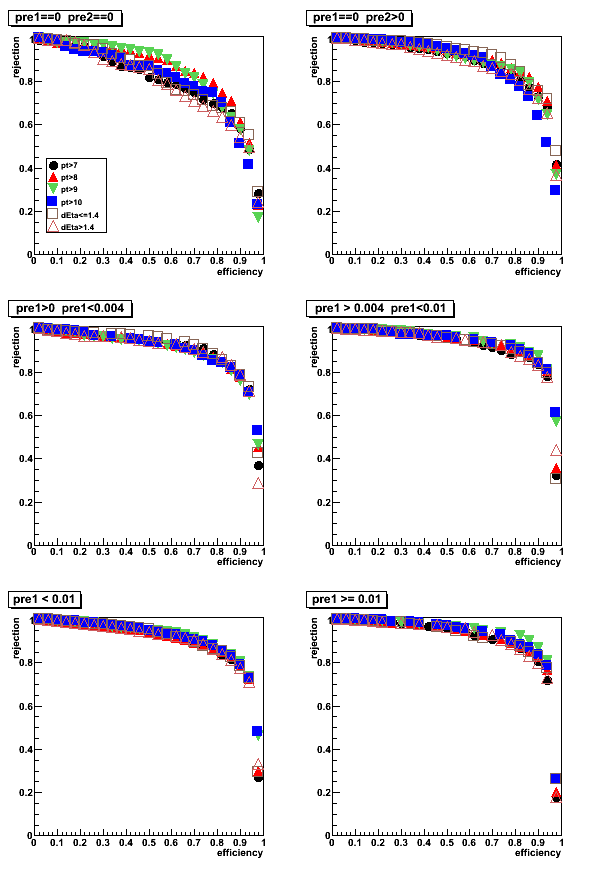
Figure 3: purity vs. efficiency
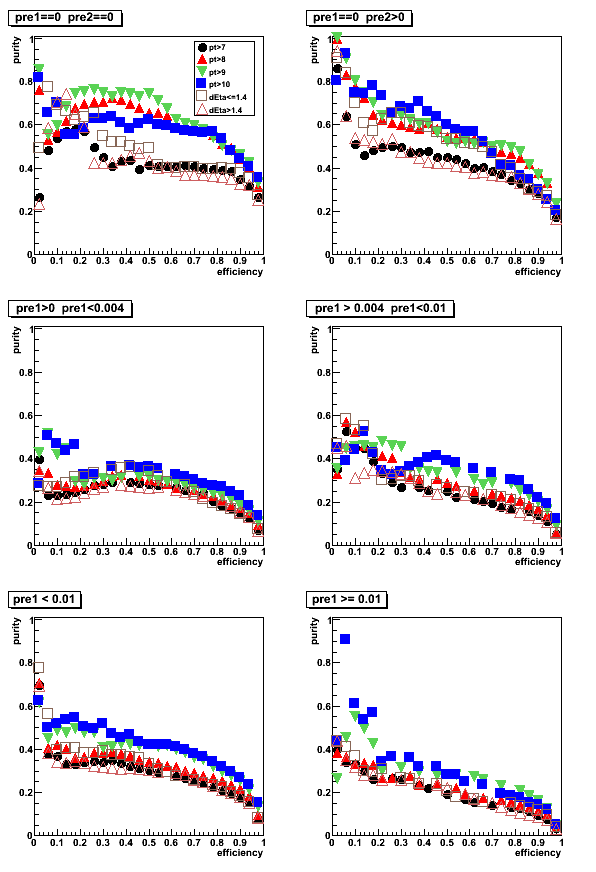
Figure 4: purity vs. rejection
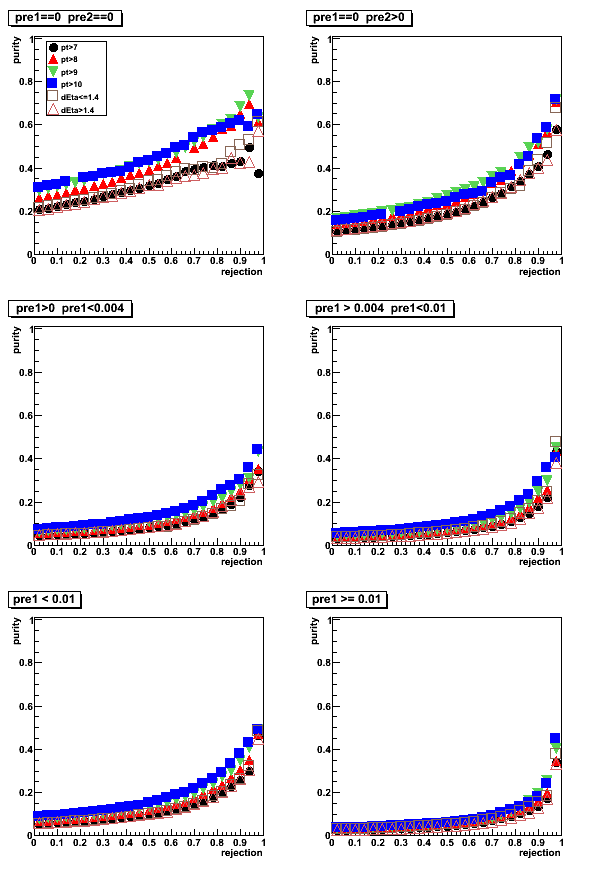
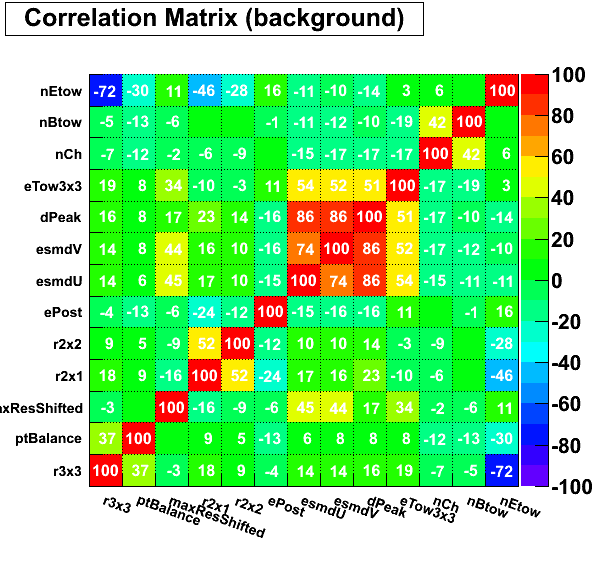
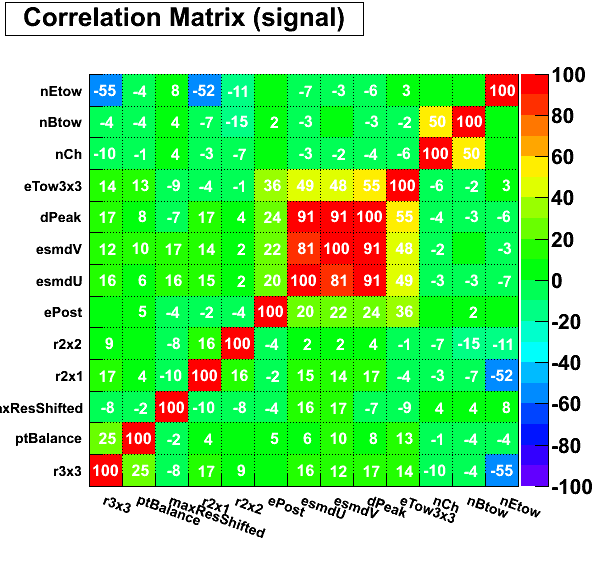
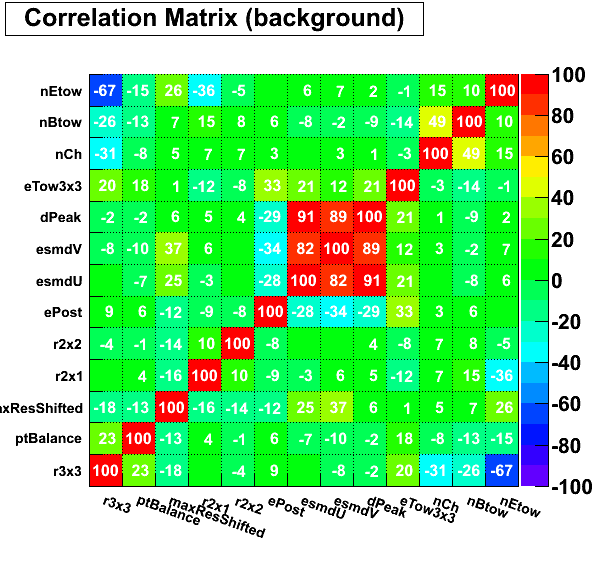
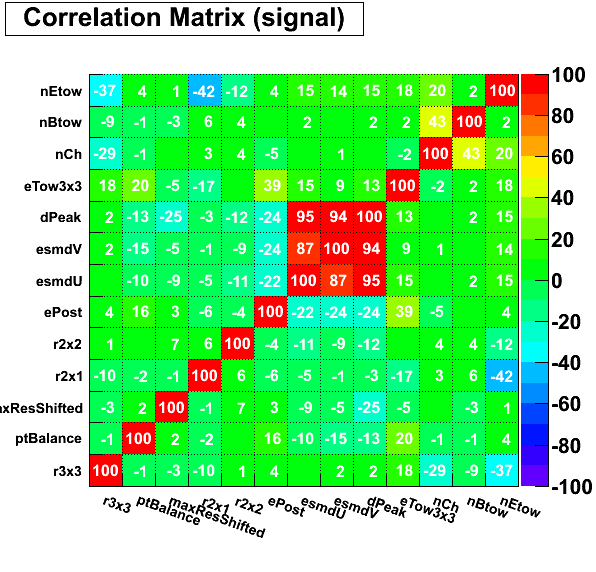
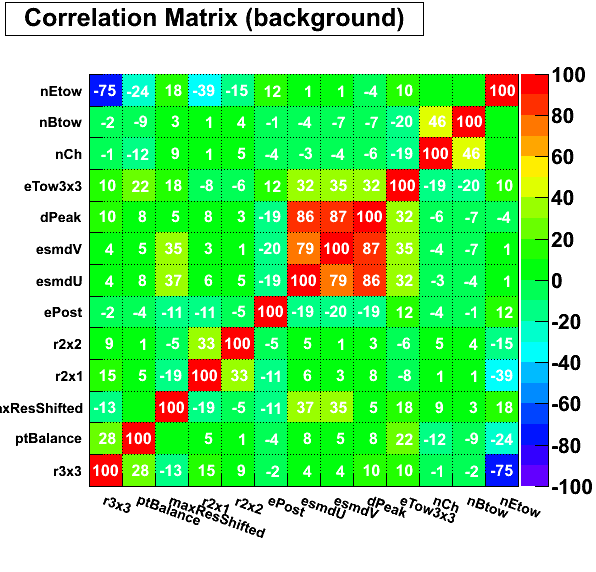
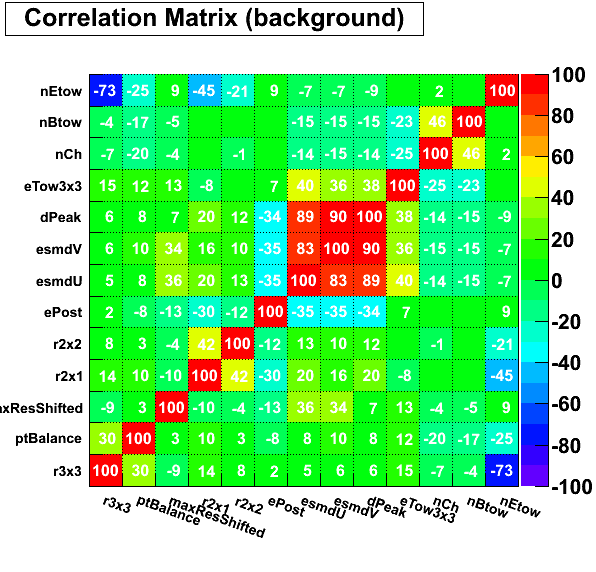
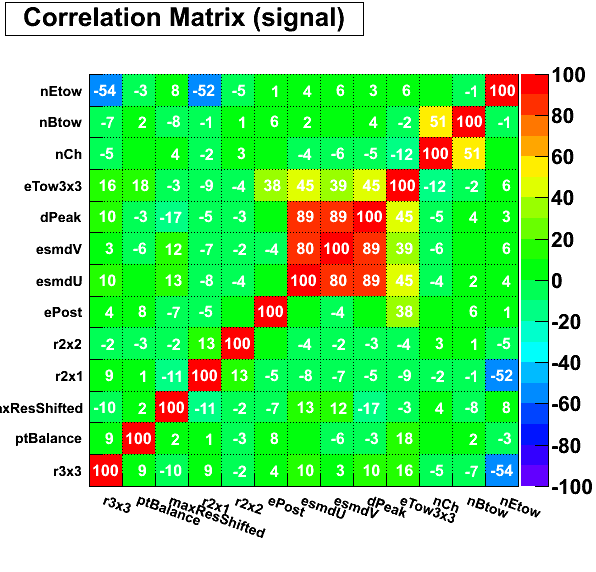
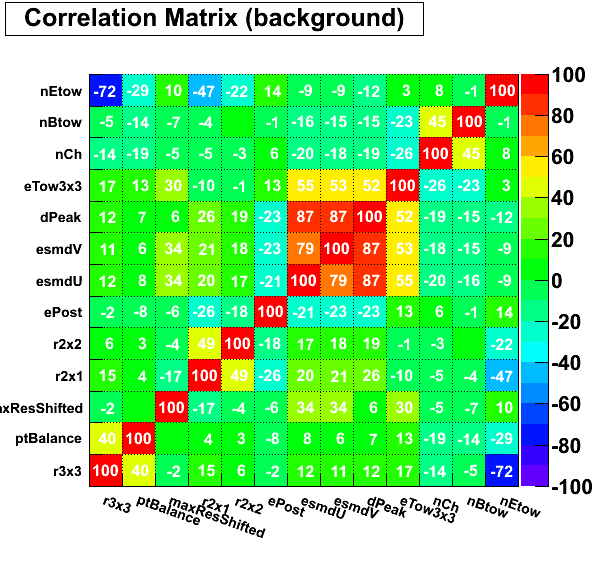
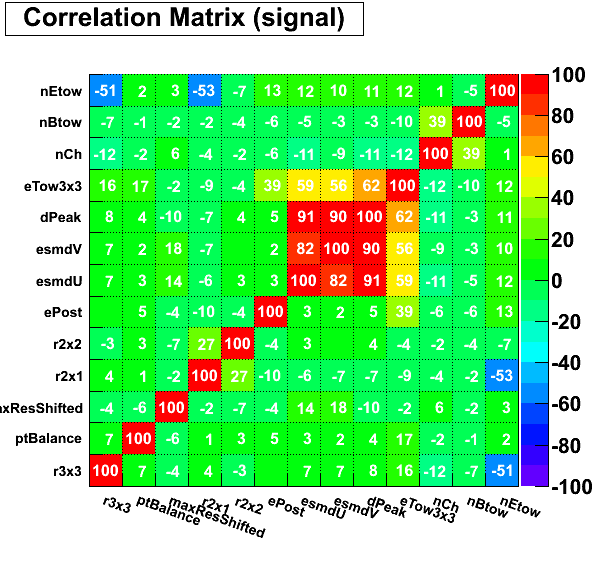
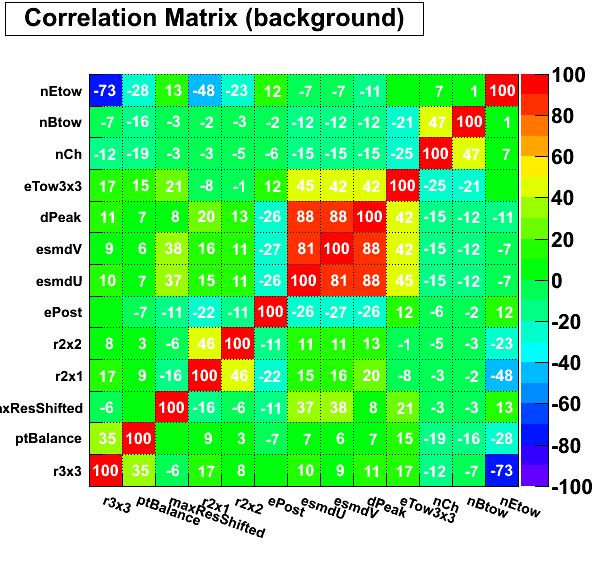
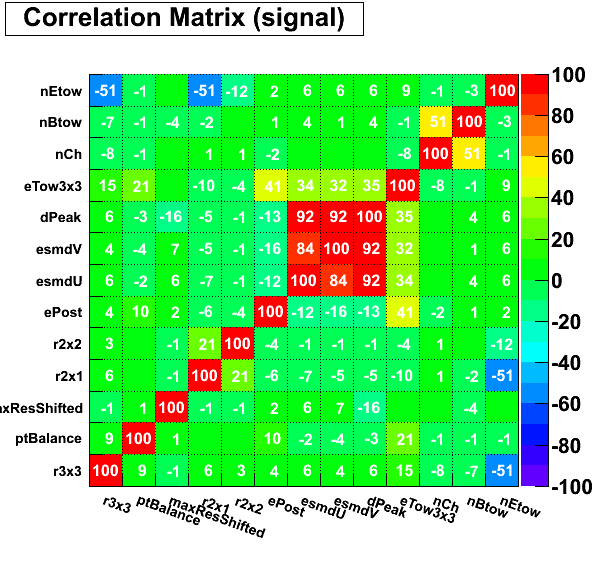
Figure 5: Correlation matrix (pt>7GeV cut)
pre1=0, pre2=0
pre1=0, pre2>0

0 < pre1 < 0.004
0.004 < pre1 < 0.01
pre1 < 0.01
pre1 >= 0.01