10 Electron E/p from pp500 L2W events
I ran the usual calibration code over the L2W data produced for the W measurement.
To find an enriched electron sample, I applied the following cuts to the tracks, the tower that the track projects to, the 3x3 tower cluster, and the 11 BSMD strips in both planes under the track:
central tower adc - pedestal > 2.5*rms
enter tower = exit tower
track p < 6 and track p > 1.5
dR between track and center of tower < 0.025
track dEdx > 3.4 keV/cm
bsmde or bsmdp adc total > 50 ADC
no other tracks in the 3x3 cluster
highest energy in 3x3 is the central tower
The energies were calculated using ideal gains and relative gains calculated by Joe Seele from tower slopes.
The corrections were calculated for every 2 eta rings and each crate. The corrections for each 2 rings were calculated first and then applied. The analysis was rerun, then the E/p was calculated for each crate.
The calibration constants will be uploaded to a different flavor to be used with the preliminary W analysis.
Fig. 1 E/p spectrum for all electrons
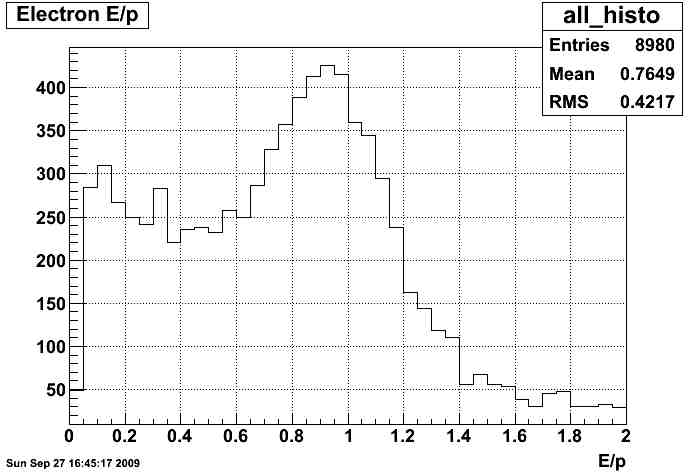
Fig. 2 p vs E/p spectrum for all electrons
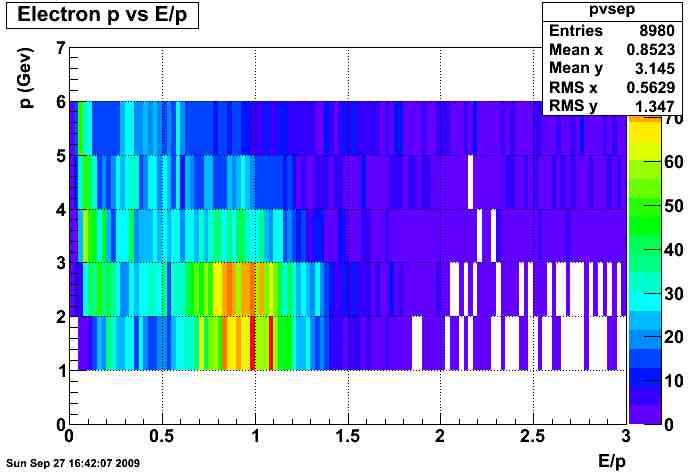
Fig. 3 BSMDP vs BSMDE for all electrons
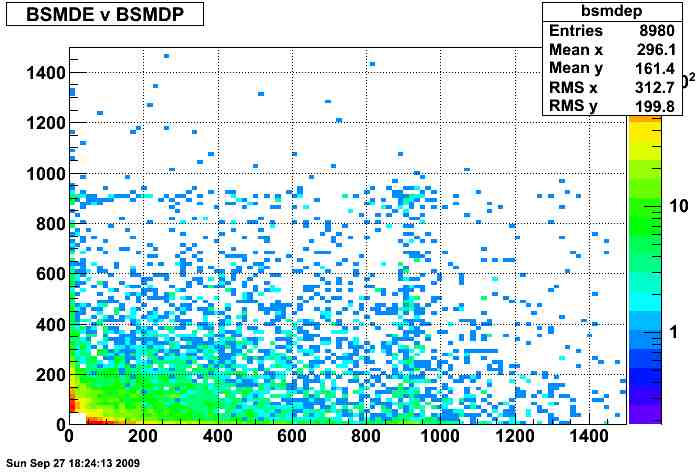
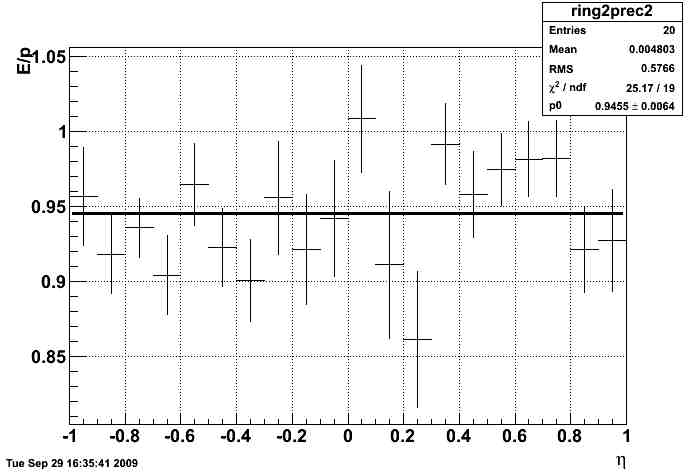
Fig. 4 corrections by eta ring
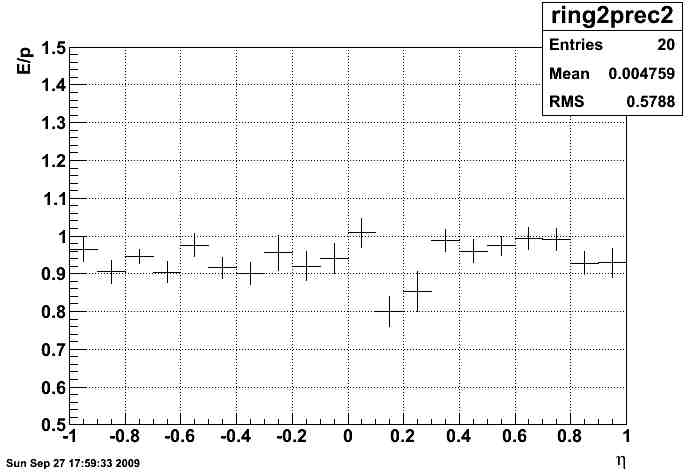
Fig. 5 Crate corrections
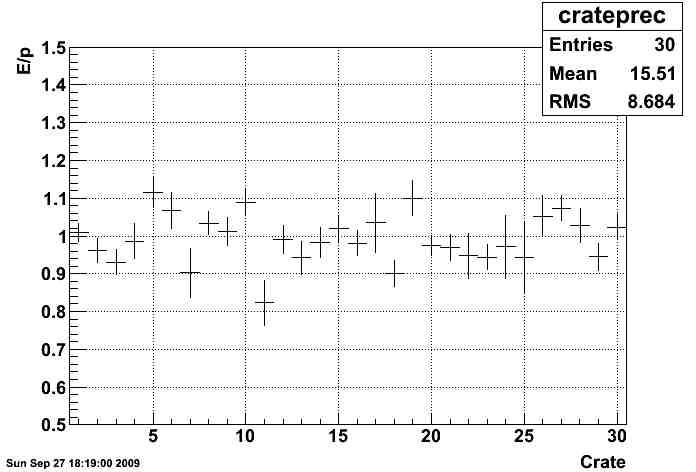
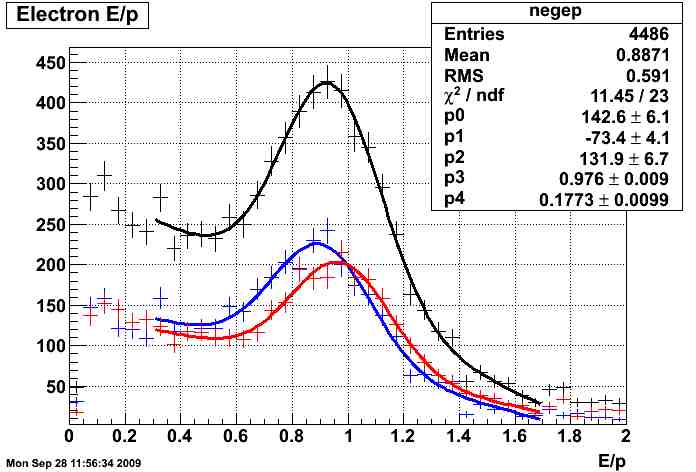
Fig. 6 difference between positrons (blue) and electrons (red):
Update: I reran the code but allowed the width of the gaussian to only be in the range 0.17 - 0.175. This region agrees with almost all of the previously found widths within the uncertainties. The goal was to fix a couple fits that misbehaved. The updated corrections as a function of eta are shown below.
Fig. U1
Update 09/30/2009: Added 2 more plots.
Fig. V1 East vs. West (no difference observed)
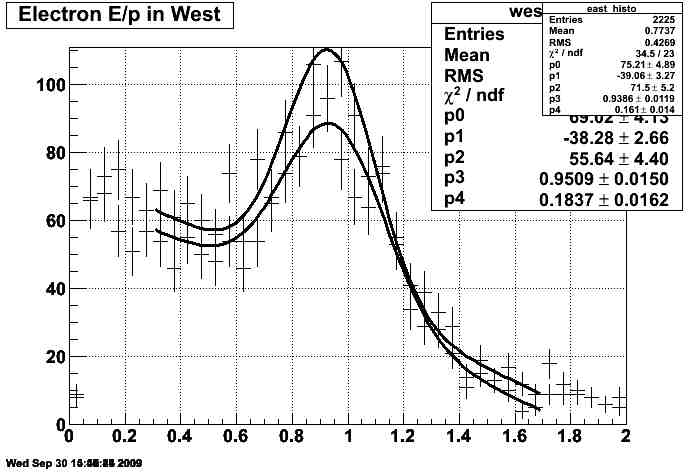
Fig. V2 slices in momentum (not much difference)

Attached are the histograms for each ring and crate.