2009.10.12 Jason EEMC geometry: effects of adding layers
Effect of added layers in Jason geometry file (ecalgeo.g23)
Monte-Carlo setup:
- One photon per event
- EEMC only geometry with LOW_EM option
- Throw particles flat in eta (1.08, 2.0), phi (0, 2pi), and pt (6-10 GeV)
- Using A2Emaker to get reconstructed Tower/SMD energy
(no EEMC SlowSimulator in chain) - Vertex z=0
- ~50K/per particle type
- Non-zero energy: 3 sigma above pedestal
Cuts for shower shapes:
Single particle kinematic cuts: pt=7-8GeV, eta=1.2-1.4
All shapes are normalized to 1 at peak (central strip)
Added layer definition from Jason file:
- EXPS is the plastic spacer in the shower maximum section
- EBLS is the layer of material on the back of the SMD planes
- EFLS is the layer of material on the front of the SMD planes
Some comments:
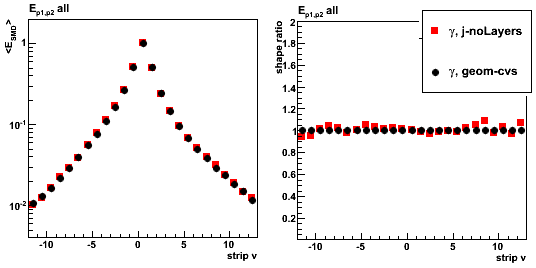
- Figs. 1-2 show that I can reproduce
sampling fraction and shower shapes
which I see with geometry file from CVS
if I disable all three added layers in Jason geometry file
(this assumes/shows that G10 layer have tiny effect).
This a good starting point, since it indicate that
all other (cosmetic) code modifications
are most probably done correctly and has no
effect on simulated detector response. - Fig. 3 shows effect of each added layer
(plastic spacers and layers in front/back of SMD)
on the sampling fraction and 2x1/3x3 energy profile:- Each layer contributes more or less equally to the sampling fraction.
- Energy profile (E2x1 / E3x3) does not affected by the added layers
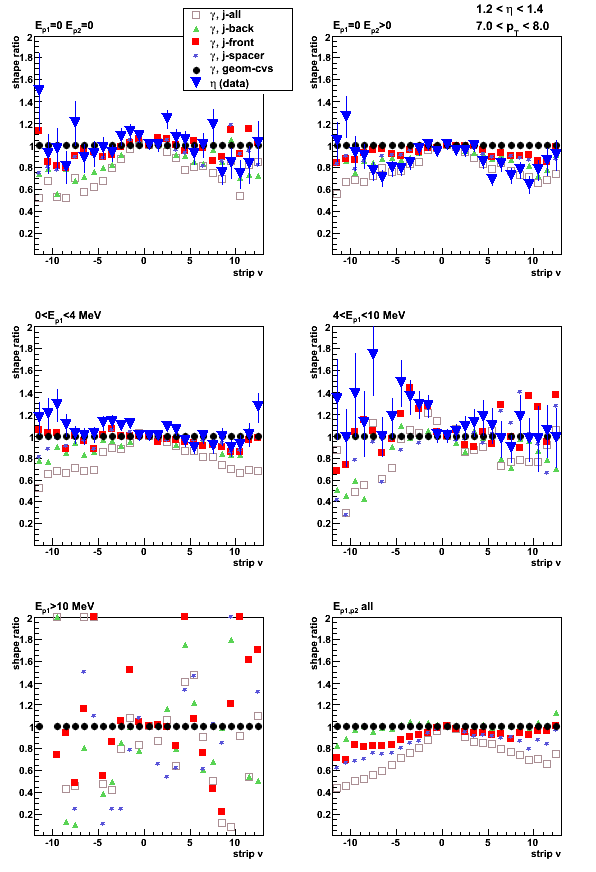
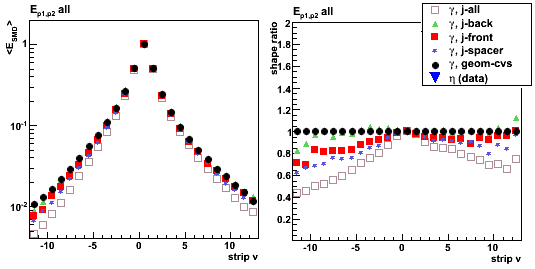
- Fig. 4 shows effect of each added layer on the shower shapes:
- Back SMD layer does not contribute much (as expected).
- Front and spacers introduce equal amount of "shape narrowing".
- Figs. 5-6 show pre-shower sorted shower shapes
and comparison with eta-meson shapes.
No layers and G10 removed
Figure 1: Sampling fraction vs. thrown energy
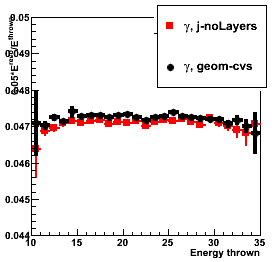
Figure 2: Shower shapes
Adding new laters (spacer, front, back)
Figure 3: Sampling fraction vs. thrown energy (left), 2x1/3x3 energy ratio (right)
See legend for details
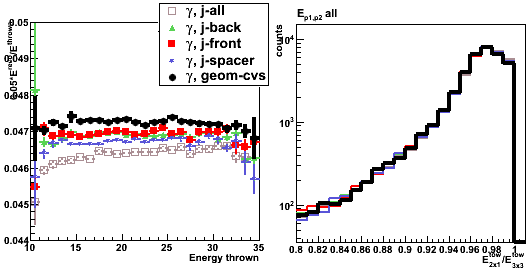
Figure 4: Shower shapes. See legend for details
Shower shapes sorted by pre-shower energy
Pre-shower bins:
- Ep1 = 0, Ep2 = 0 (no energy in both EEMC pre-shower layers)
- Ep1 = 0, Ep2 > 0
- 0 < Ep1 < 4 MeV
- 4 < Ep1 < 10 MeV
- Ep1 > 10 MeV
- All pre-shower bins combined
Ep1/Ep2 is the energy deposited in the 1st/2nd EEMC pre-shower layer.
For a single particle MC it is a sum over
all pre-shower tiles in the EEMC with energy of 3 sigma above pedestal.
For eta-meson from pp2006 data the sum is over 3x3 tower patch
Figure 5: Shower shapes (left) and their ratio (right)
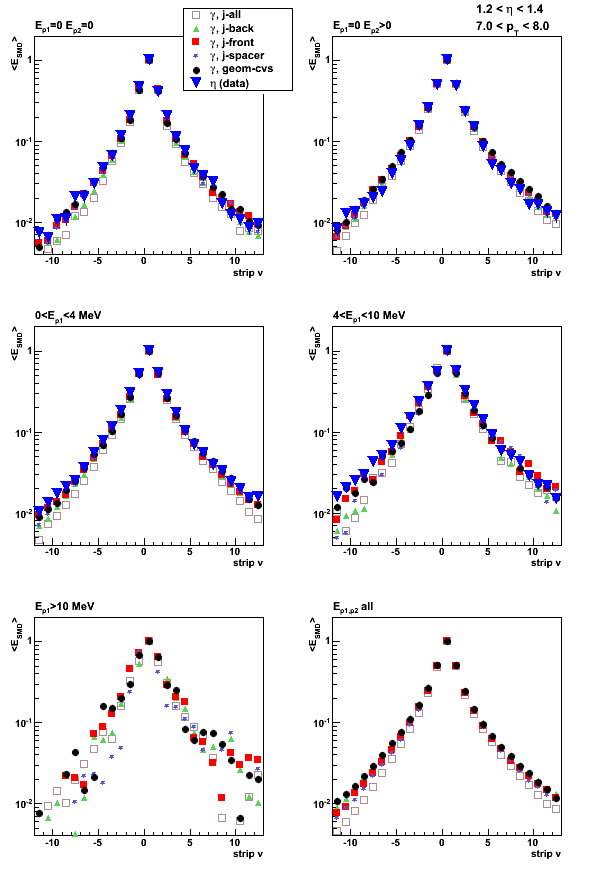
Figure 6: Shower shape ratios