MC study on PPV with BTOF in Run 9 geometry
This MC simulation study is to illustrate the performance of PPV vertex finder with BTOF added under different pileup assumptions. All the PPV coding parts with BTOF included are updated in this page.
The geometry used here is y2009 geometry (with 94 BTOF trays). Generator used is PYTHIA with CDF "TuneA" setting. The details of gstar setup and reconstruction chain can be found here. The default PPV efficiency for this setup (with BBC trigger selection) is ~45-50%.
The triggered event selected are BBC triggered minibias events. The simulation has included the TPC pileup minibias events for several different pileup conditions. The pileup simulation procedure is well described in Jan Balewski's web page. I choose the following pileup setup:
mode BTOF back 1; mode TPCE back 3761376; gback 470 470 0.15 106. 1.5; rndm 10 1200
A few explanations:
- 'mode BTOF back 1' means try pileup for BTOF only in the same bXing
- '3761376' means for TPC try pileup for 376 bXing before , in, and after trigger event. TRS is set up to handle pileup correctly. Note, 376*107=40 musec - the TPC drift time.
- gback is deciding how pileup events will be pooled from your minb.fzd file.
- '470' is # of tried bXIngs back & forward in time.
- 0.15 is average # of added events for given bXIng, drawn with Poisson distribution - multiple interactions for the same bXing may happen if prob is large. I choose this number to be 0.0001, 0.02, 0.05, 0.10, 0.15, 0.20, 0.30, 0.40, 0.50 for different pileup levels.
- 106. is time interval , multiplied by bXIng offset and presented to the peilup-enabled slow simulators, so the code know how much in time analog signal needs to be shifted and in which direction.
- 1.5 if averaged # of skipped events in minb.fzd file. Once file is exhausted it reopens it again. If you skip too few soon your pileup events start to repeat. If you skip too much you read inpute file like creazy
- 'rndm' is probably seed for pileup random pileup generator
Here shows the results:
- Vertex efficiency
Fig. 1: Vertex efficiencies in different pileup levels for cases of w/ BTOF and w/o BTOF.
.gif)
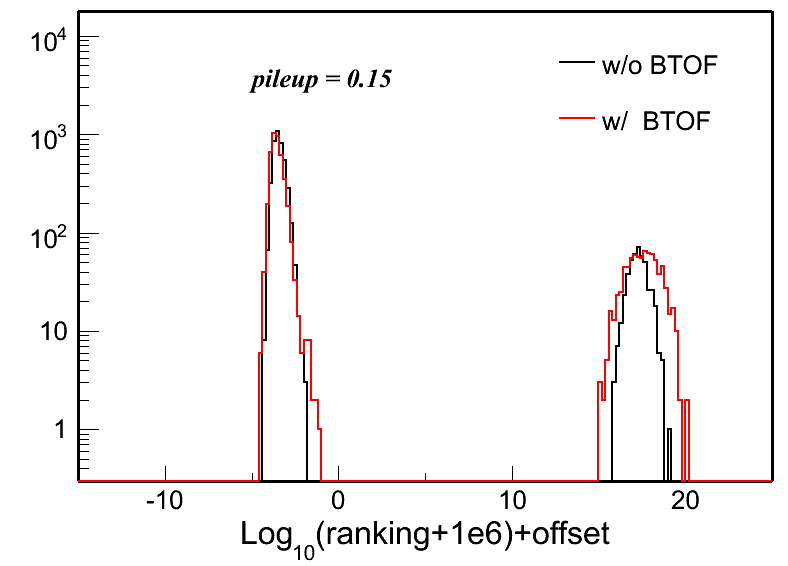
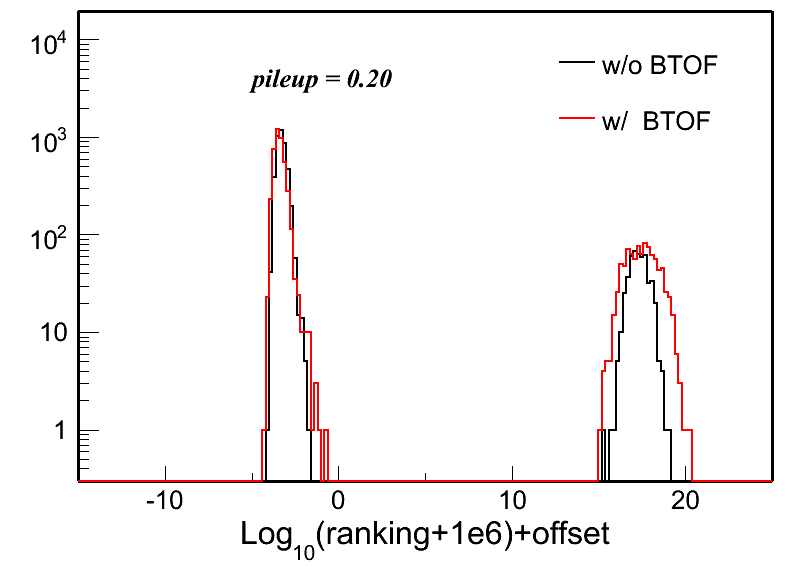
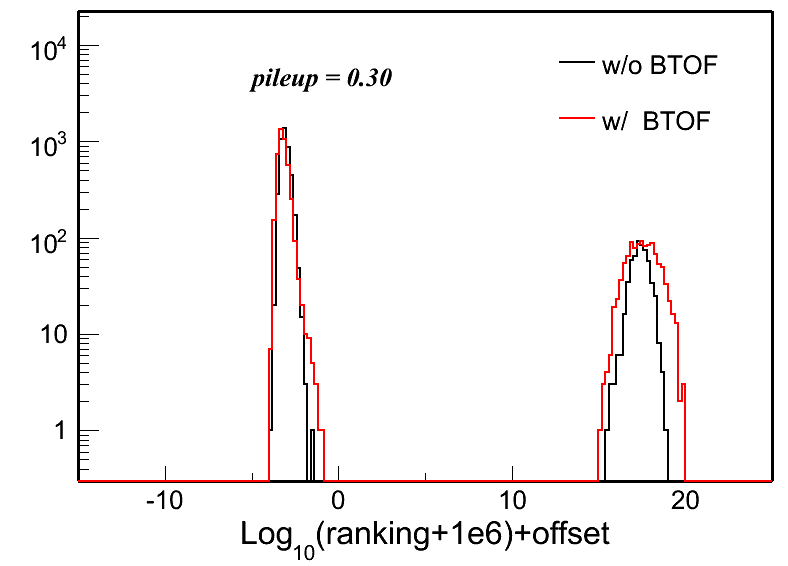
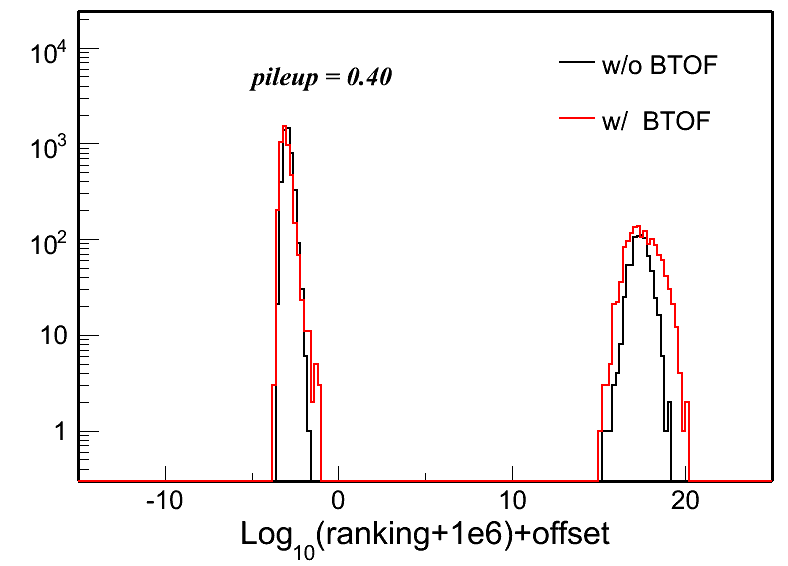
Here: good vertex is definited as vertex with positiving ranking. real vertex is definited as good vertex && |Vz-Vz_MC|<1 cm.
- # of BTOF/BEMC Matches
Fig. 2: # of BTOF/BEMC matches for the first good & real vertex in different pileup levels.
.gif)
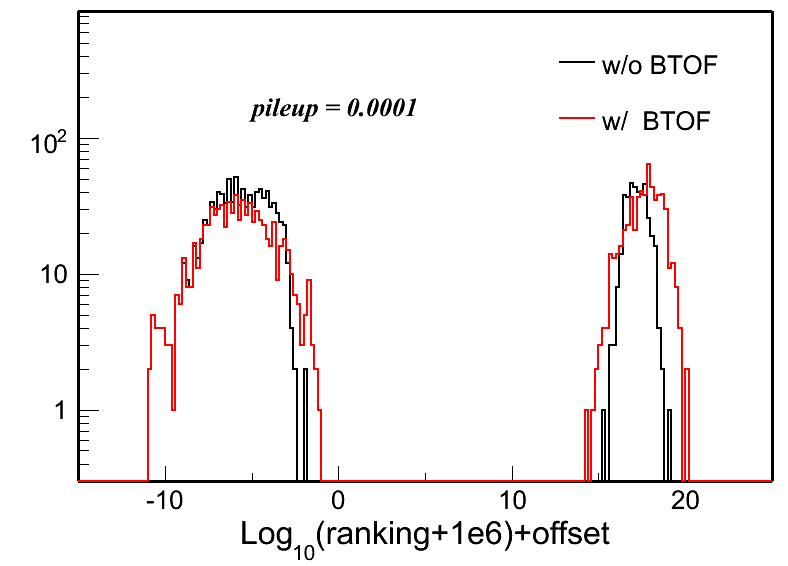
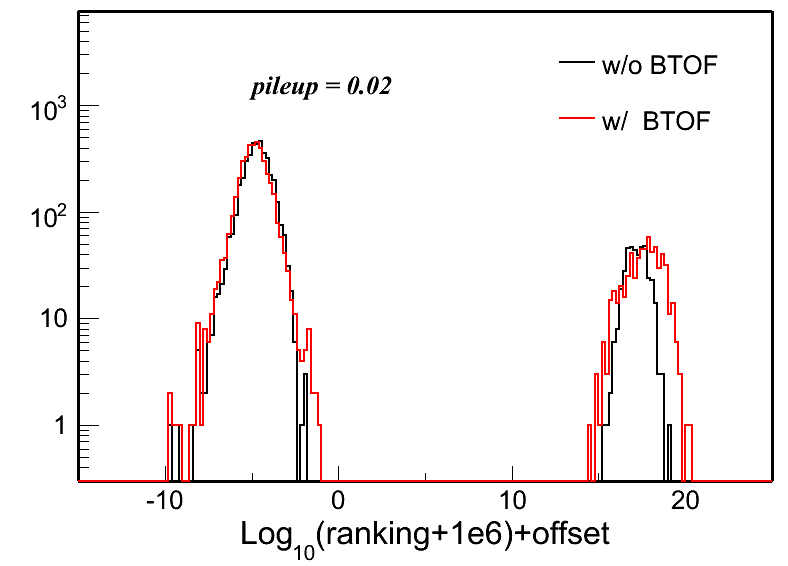
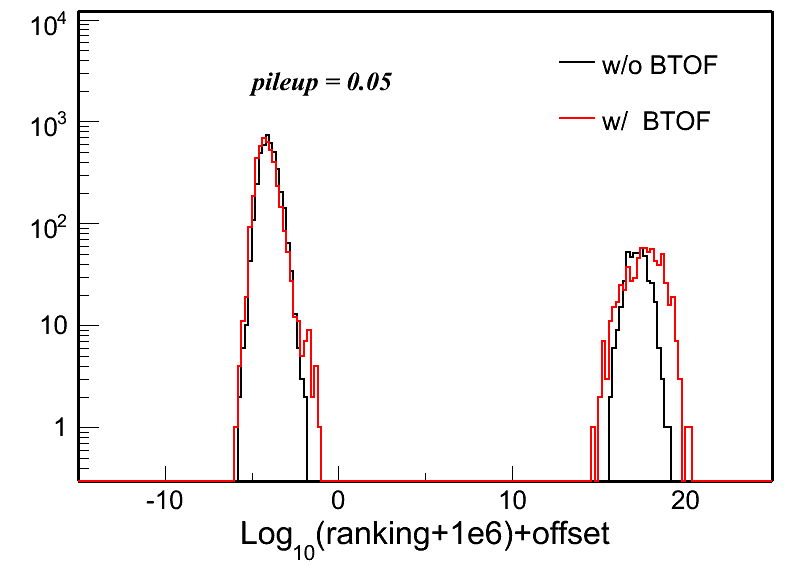
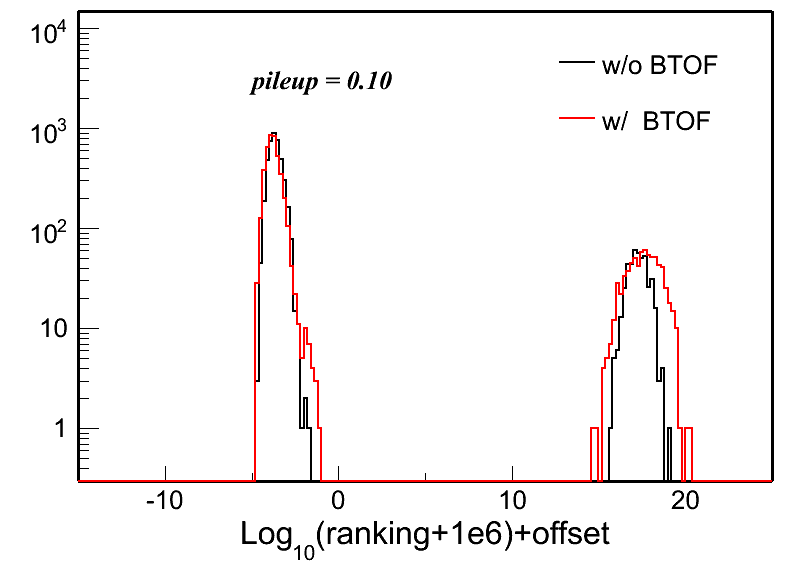
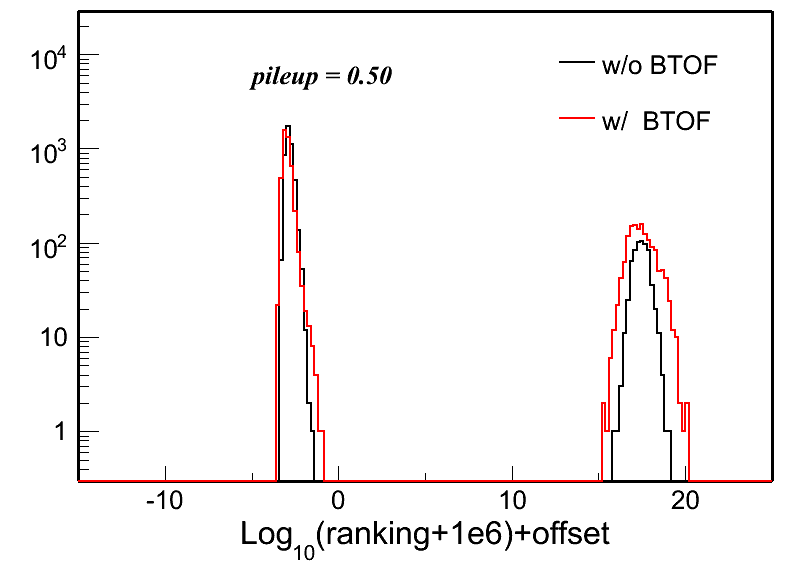
- Ranking distributions
Fig. 3: Vertex ranking distributions in each pileup level for both w/ and w/o BTOF cases.
 |
 |
 |
 |
 |
 |
 |
 |
 |
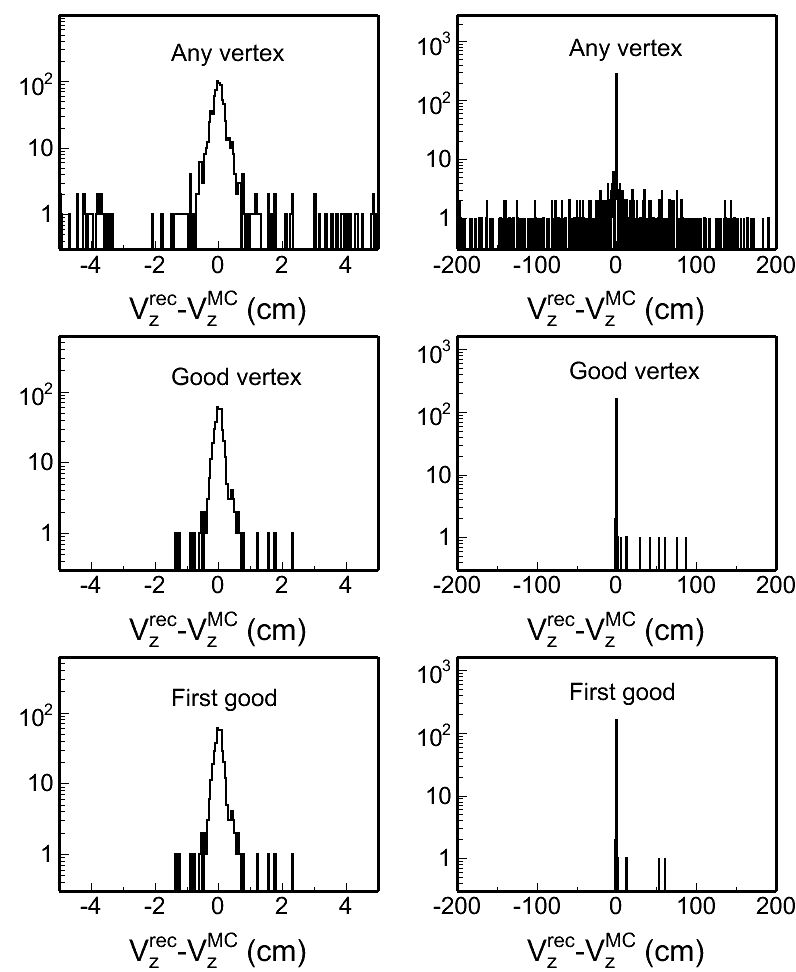
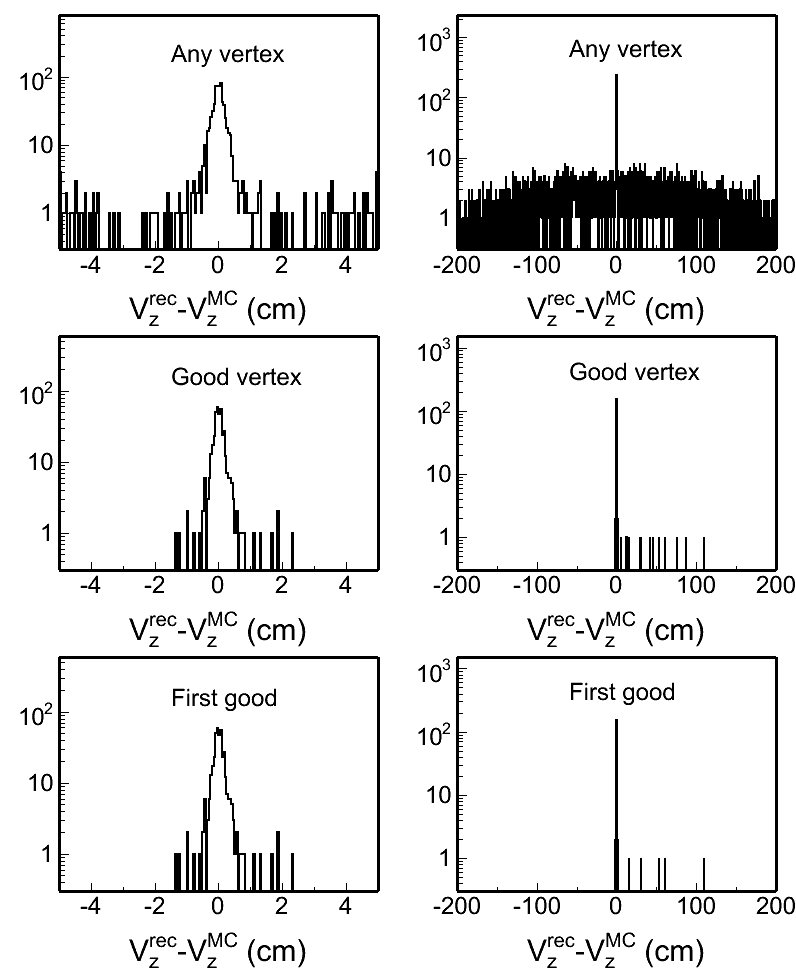
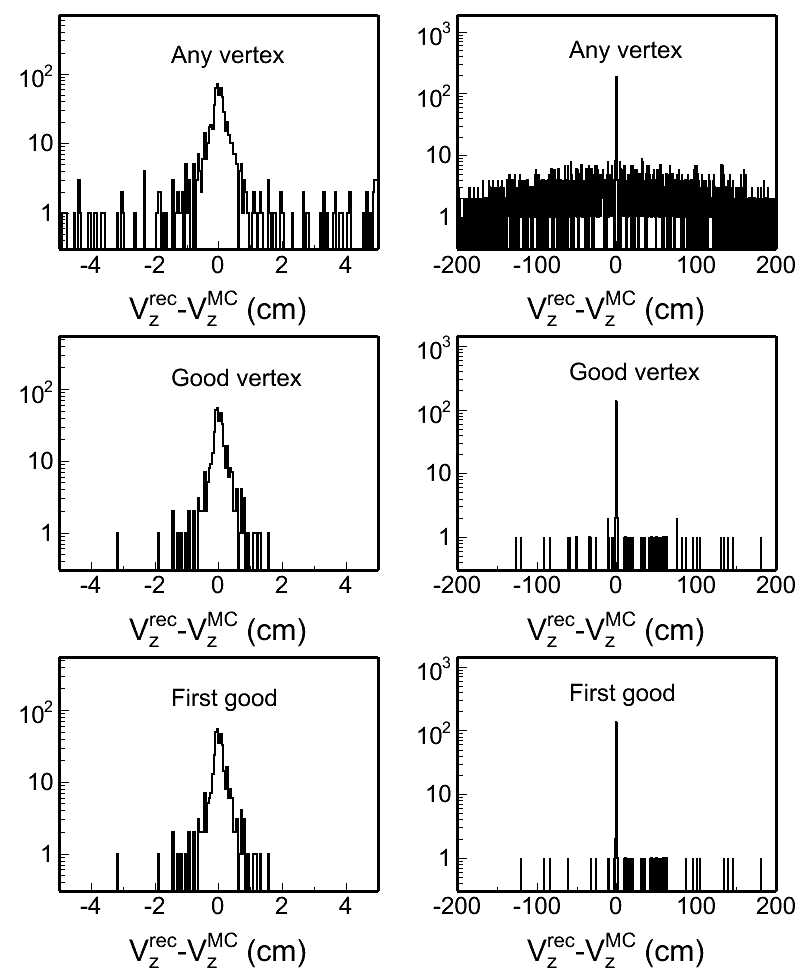
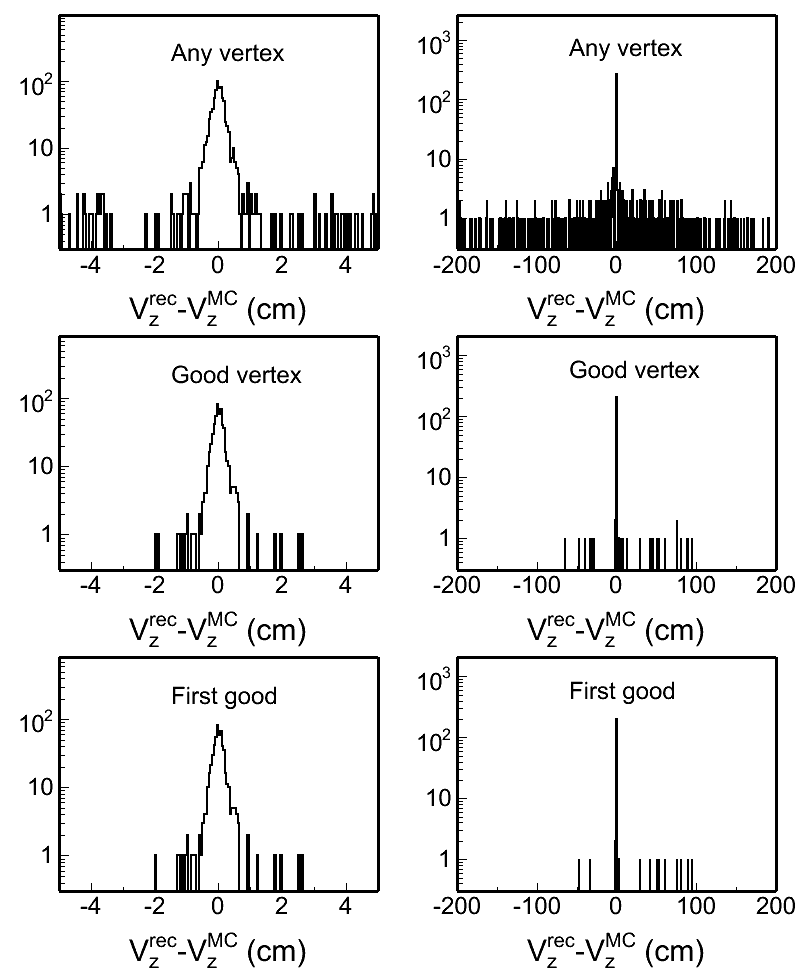
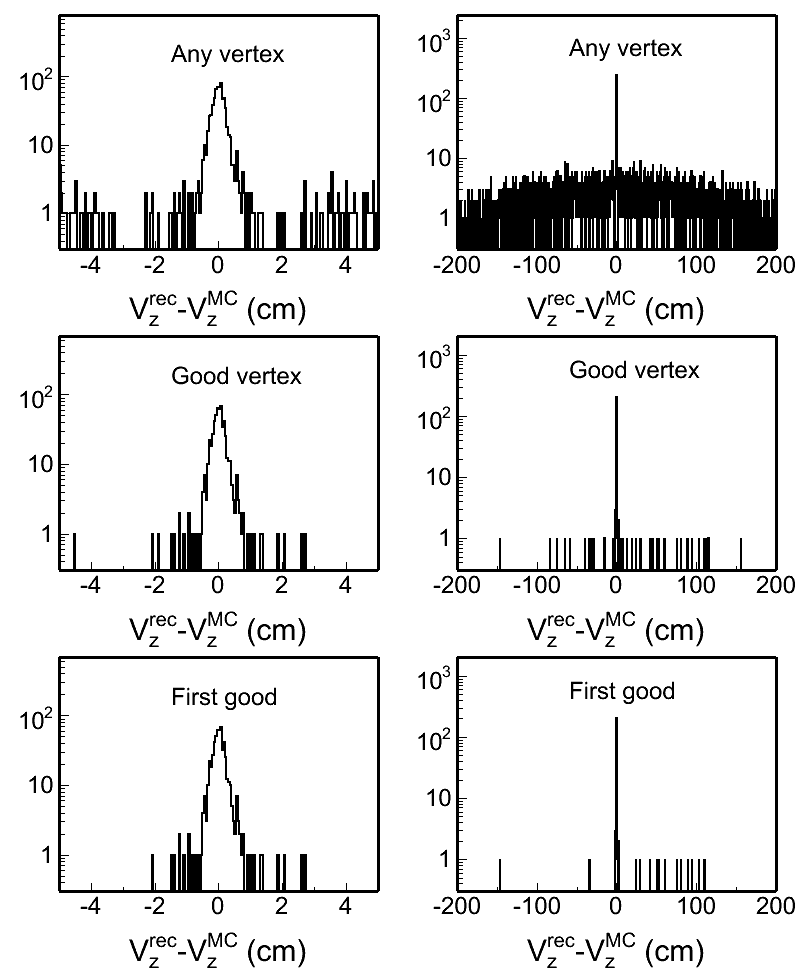
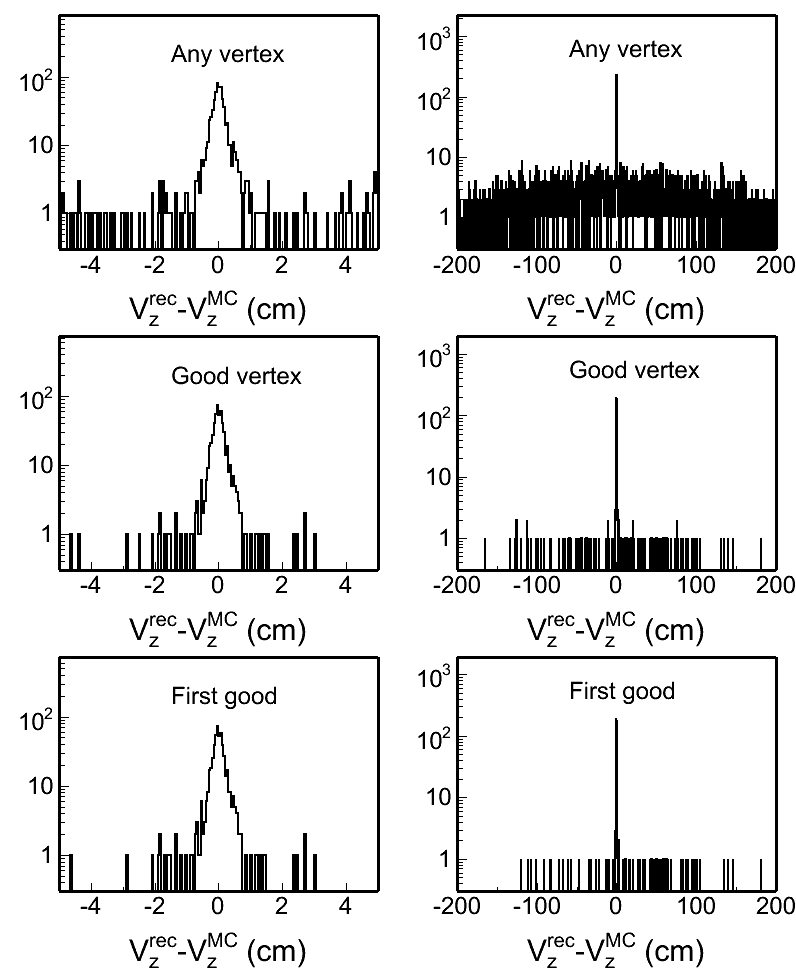
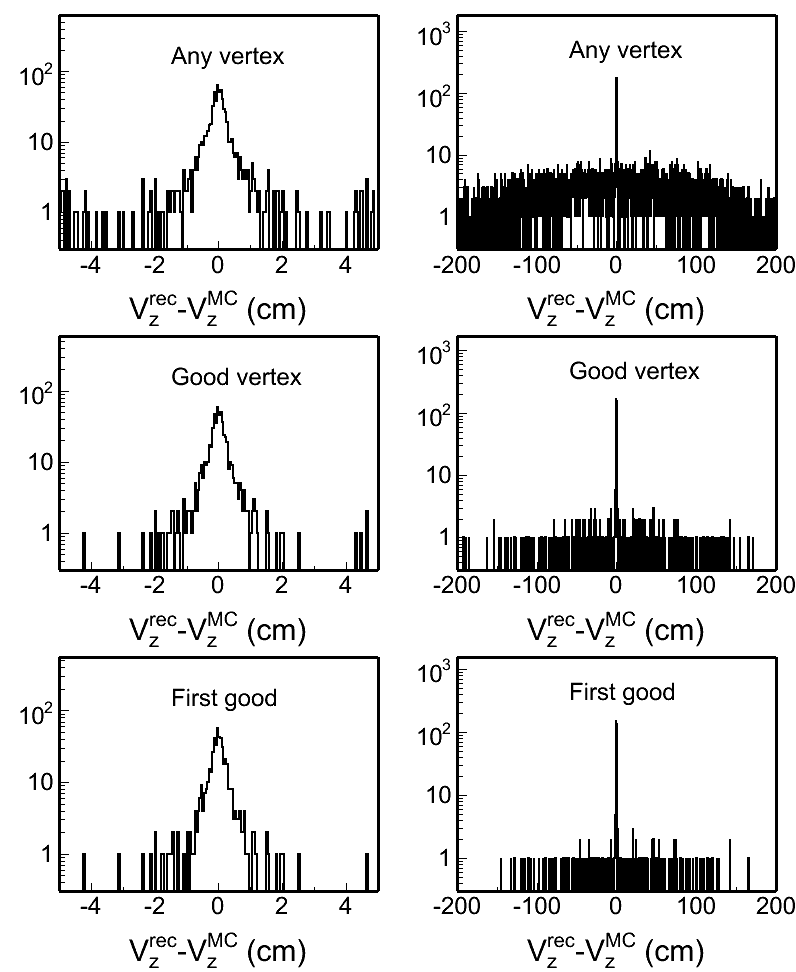
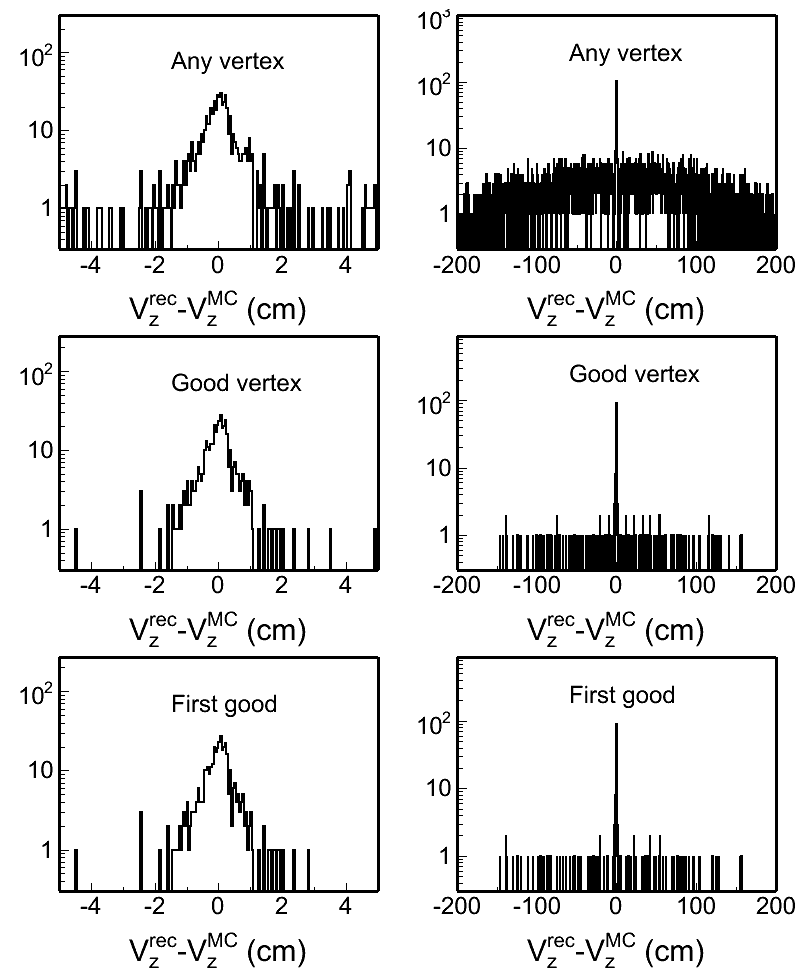
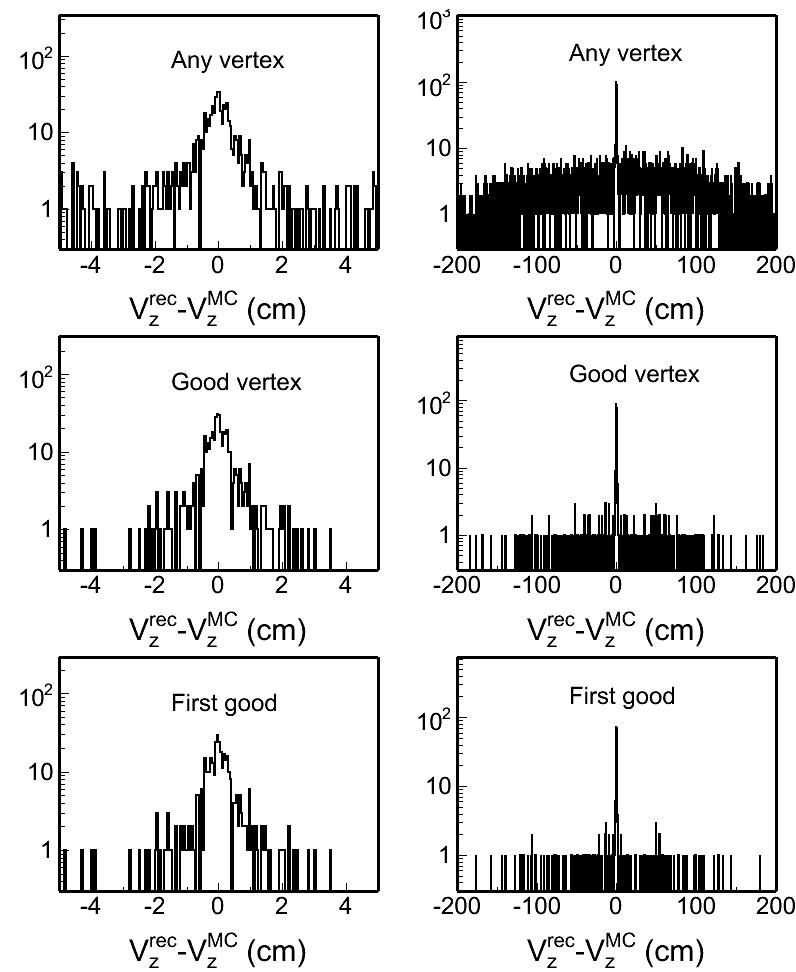
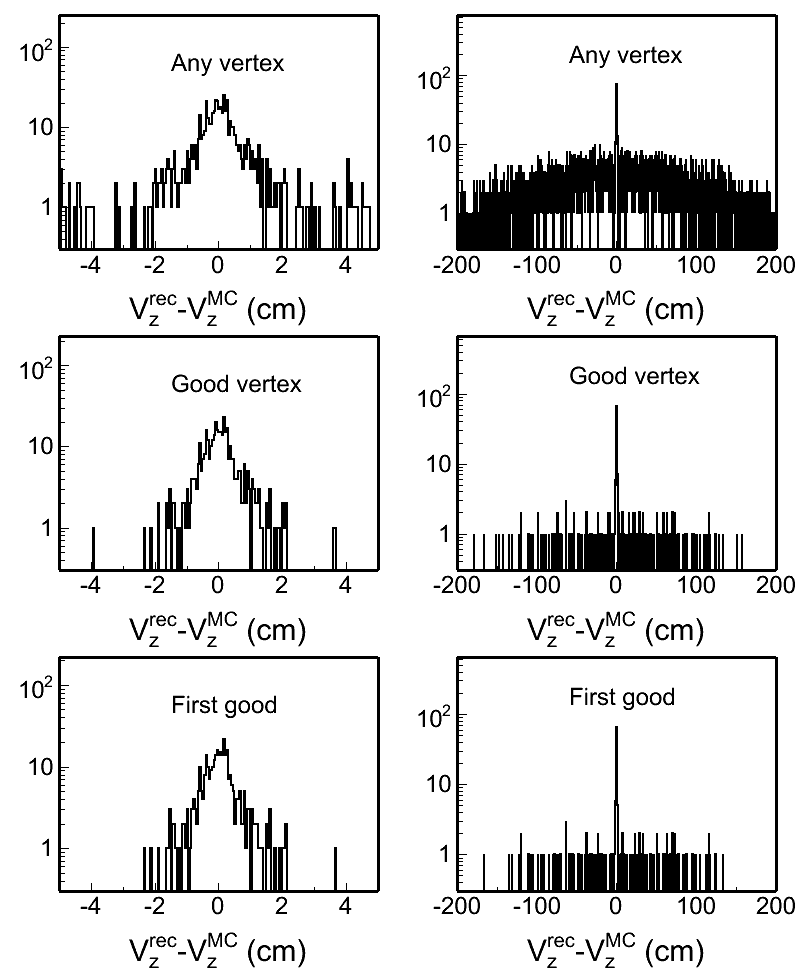
- Vertex z difference
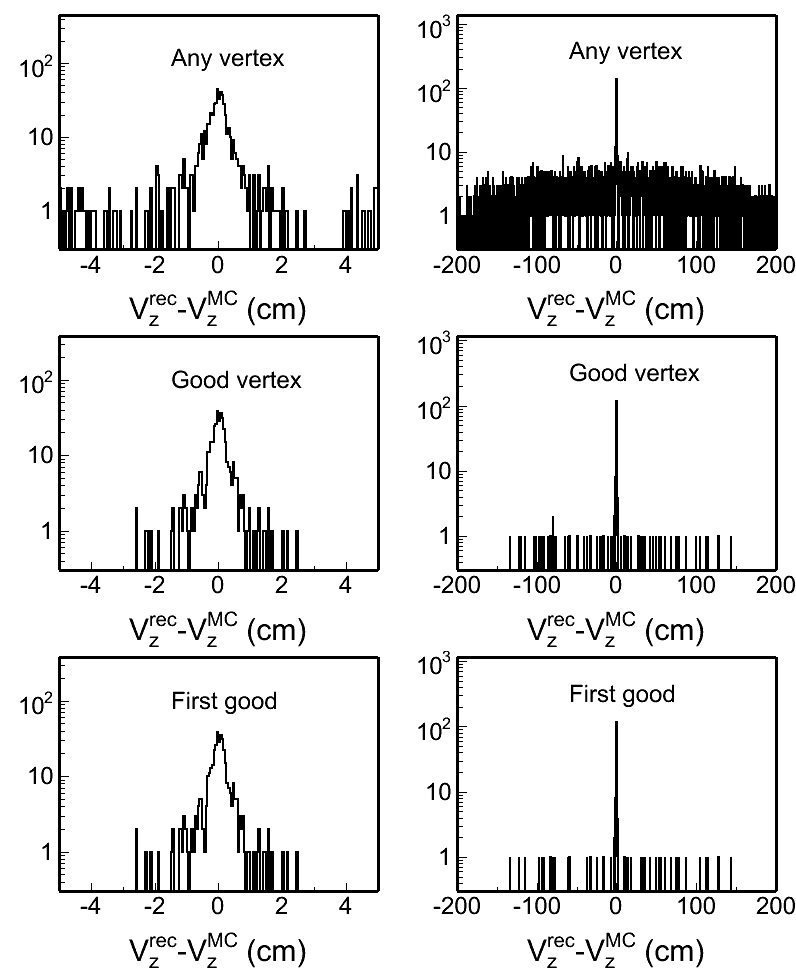
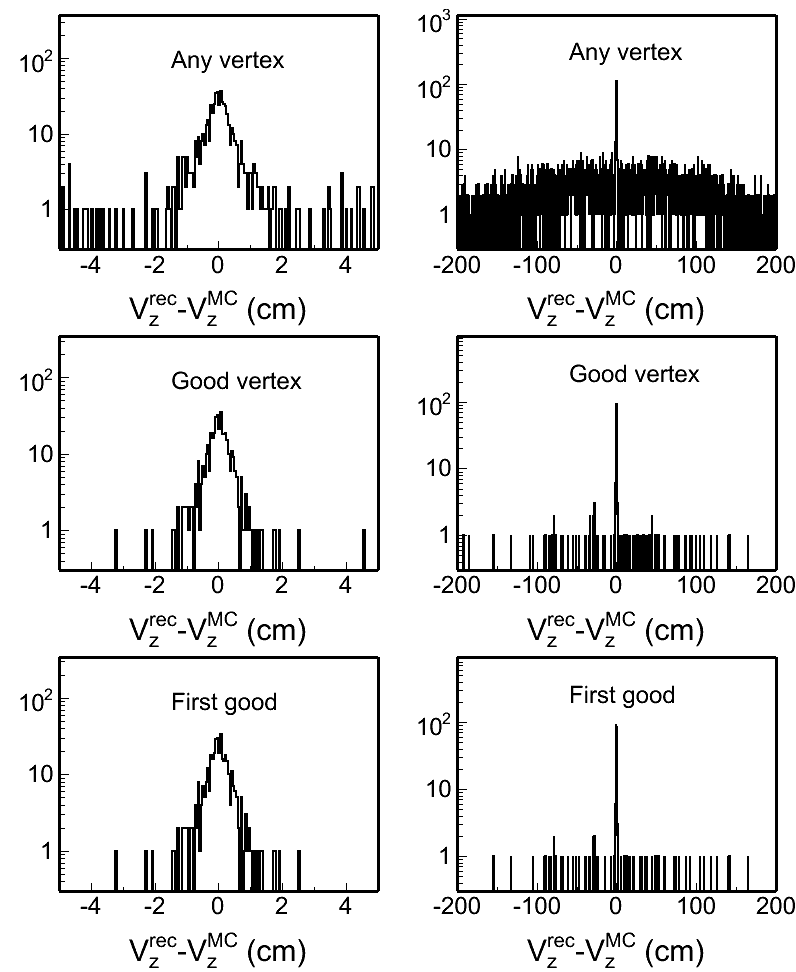
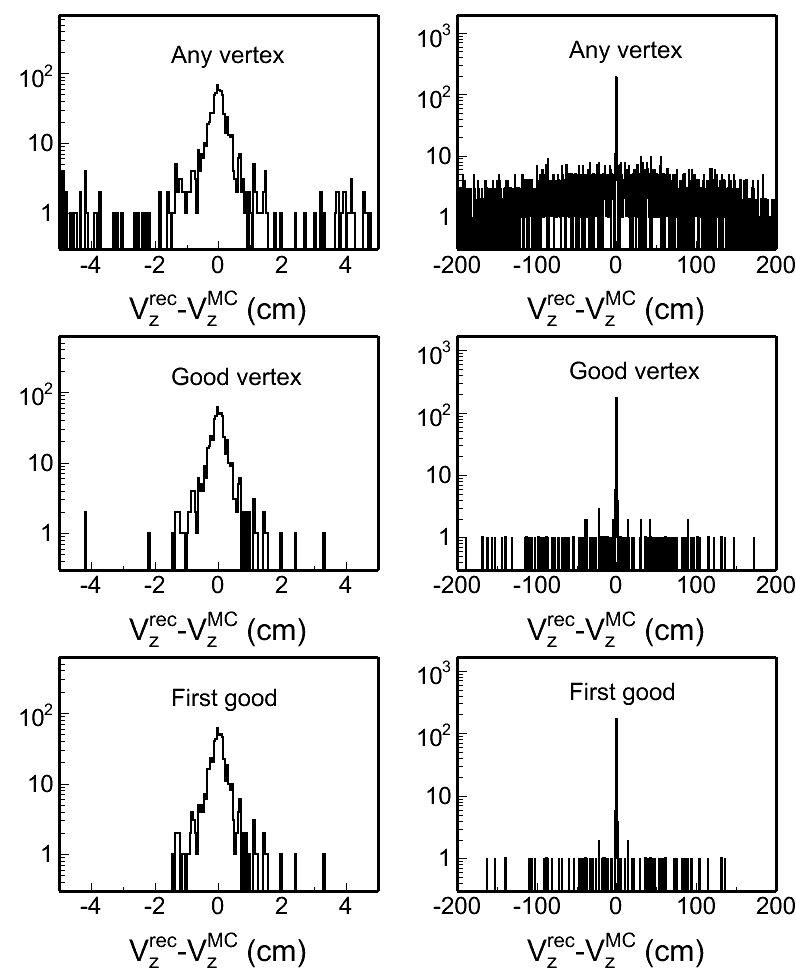
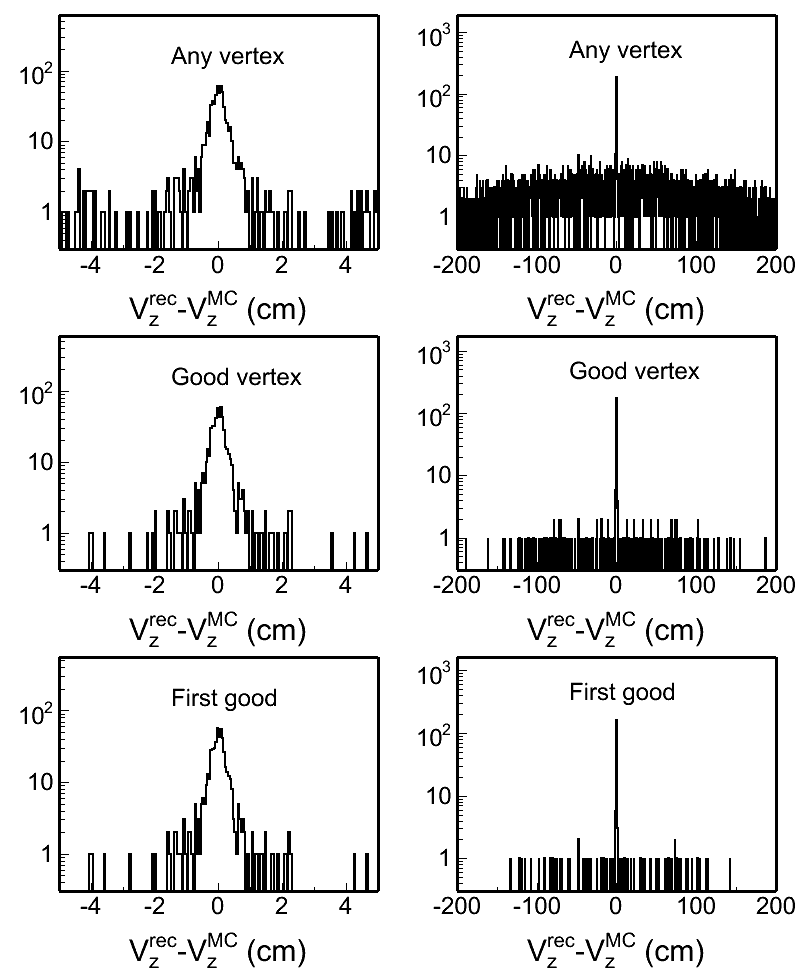
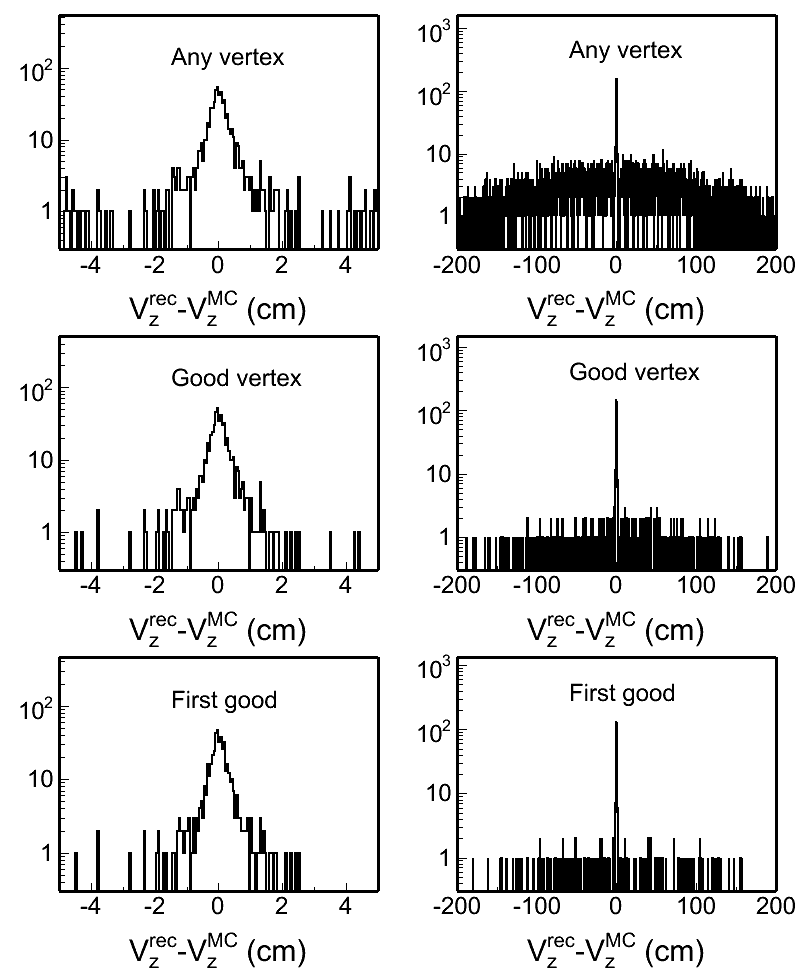
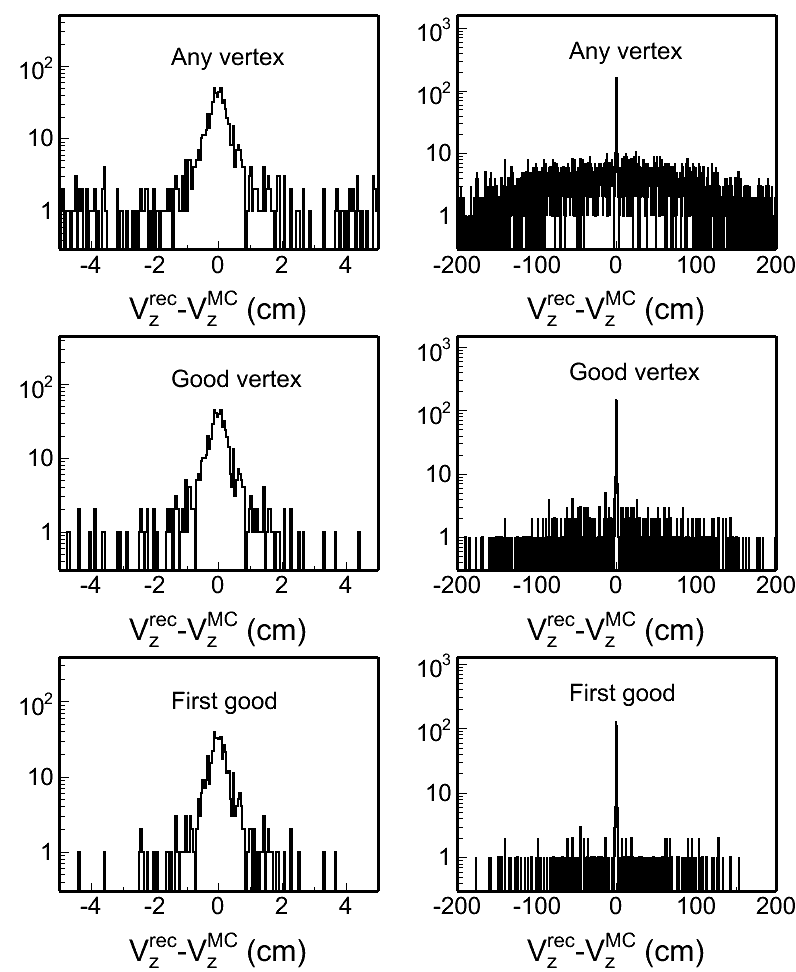
Fig. 4: Vertex z difference (Vzrec - VzMC) distributions in different pileup levels for both w/ and w/o BTOF cases. Two plots in each row in each plot are the same distribution, but shown in two different ranges.
| pileup = 0.0001 | pileup = 0.02 | pileup = 0.05 | |
|
w/o BTOF |
 |
 |
 |
|
w/ BTOF |
 |
 |
 |
| pileup = 0.10 | pileup = 0.15 | pileup = 0.20 | |
| w/o BTOF | 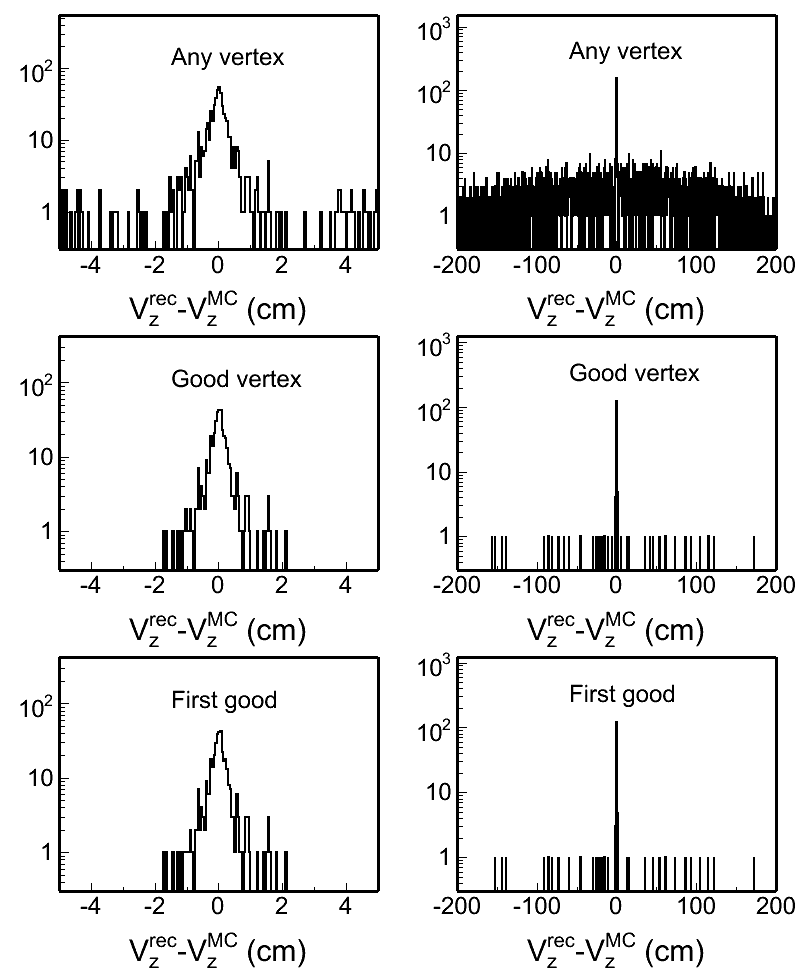 |
 |
 |
|
w/ BTOF |
 |
 |
 |
| pileup = 0.30 | pileup = 0.40 | pileup = 0.50 | |
|
w/o BTOF |
 |
 |
 |
|
w/ BTOF |
 |
 |
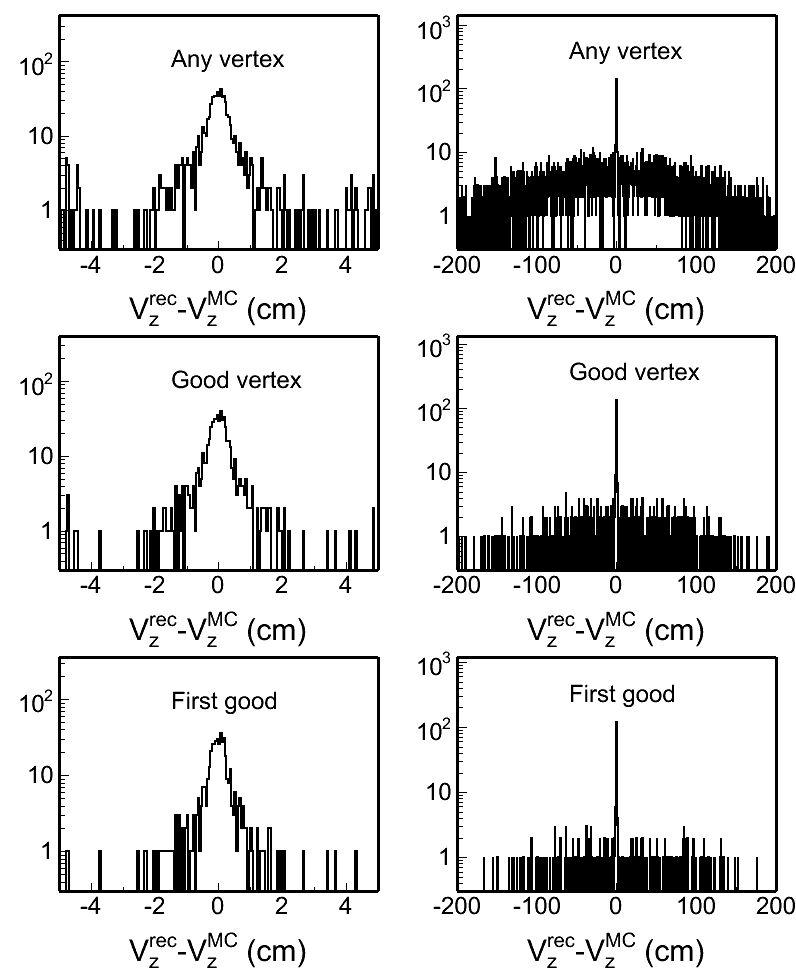 |
To quantify these distributions, I use the following two variables: Gaussian width of the main peak around 0 and the RMS of the whole distribution. Fig. 5 and 6 show the distributions of these two:
Fig. 5: Peak width of Vzrec-VzMC in Fig. 4 in different pileup levels.
.gif)
Fig. 6: RMS of Vzrec-VzMC distributions in different pileup levels.
.gif)
- CPU time
The CPU time in processing pileup simulation grows rapidly as the pileup level increases. Fig. 7 shows the CPU time needed per event as a function of pileup level. The time shown here is the averaged time for 1000 events splitted into 10 jobs executed on RCF nodes. I see there is a couple out of these 10 jobs took significantly shorter time than others, and I guess this is due to the performance on different node. But I haven't confirmed it yet.
Fig. 7: CPU time vs pielup levels
.gif)
Update on 12/23/2009
There were some questions raised at the S&C meeting about why the resolution w/ TOF degrades at low pileup cases. However, as we know, including BTOF would increase the fraction of these events finding a good vertex. While this improvement is mainly on those events with fewer # of EMC matches that will not be reconstructed with one good vertex if BTOF is not included (see the attached plot for the comparison between w/ and w/o BTOF at 0.0001 pileup level). Events entering into Fig. 5 are any of those who has at least one good vertex. In the case of w/ BTOF, many events with only 1 or 0 EMCs matches can have one reconstructed vertex because of BTOF matches included. While tracks with small pT can reach BTOF easier than BEMC. So one would expect the mean pT of the tracks from these good vertices if we include BTOF would be smaller (not sure how big quantitatively), then resulting in worse projection uncertainty to the beamline, thus these event sample will have slight worse Vz resolution.
I don't have a better idea to pick up the same event sample in the case of w/ BTOF as that in the case of w/o BTOF rather than I select the number of BEMC matches >=2 for the vertices that will be filled in my new Vz difference plot. Fig. 8 shows the same distribution as that in Fig. 5 but with nBEMCMatch>=2.
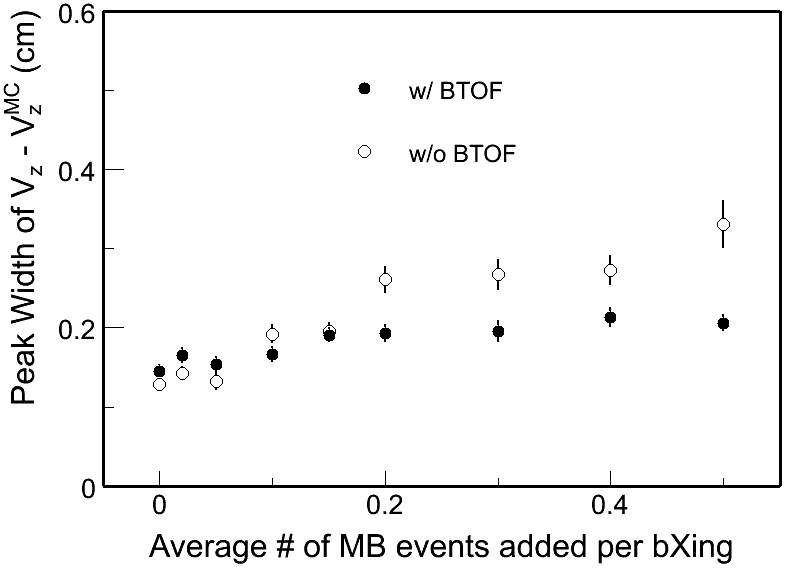
One can see the change is in the right direction, but still it seems not perfect from this plot for very low pileup cases. I also went back to compare the reconstructed vertices event-by-event, here are some output files:
/star/u/dongx/lbl/tof/simulator/simu_PPV/ana/woTOF_0.0001.log and wTOF_0.0001.log
The results are very similar except a couple of 0.1cm movements in some events (I attribute this to the PPV step size). Furthermore, in the new peak width plot I show here, for these very low pileup cases, the difference between two are even much smaller 0.1cm, which I expect to be the step size in the PPV.