2009.11.10 BEMC sampling fraction and clustering
Monte-Carlo setup:
- Throwing one photon per event
- Full y2009 STAR geometry configurations with and without LOW_EM option.
Note: LOW_EM cuts are listed at the bottom of this page,
and some related discussion can be found in this phana thread - Throw particles flat in eta (-0.95,0.05) amd (0.05, 0.95), phi (0, 2pi), and energy (30 +/- 0.5 GeV)
- bfc.C options:
trs,fss,y2009,Idst,IAna,l0,tpcI,fcf,ftpc,Tree,logger,ITTF,Sti,MakeEvent,McEvent,
geant,evout,IdTruth,tags,bbcSim,tofsim,emcY2,EEfs,
GeantOut,big,-dstout,fzin,-MiniMcMk,beamLine,clearmem,eemcDB,VFPPVnoCTB - Use fixed (7%) sampling fraction in StEmcSimpleSimulator.cxx
mSF[0] = 1/0.07;
mSF[1] = 0.;
mSF[2] = 0.; - Vertex z=0
- 50K/per particle type
Geometry configurations and notations:
- BEMC-noLOW_EM: Full STAR y2009 without LOW_EM option
- BEMC-LOW_EM: Full STAR y2009 with LOW_EM option
data base settings (same settings in bfc.C (Jan's trick) and in my MuDst reader):
dbMk->SetFlavor("sim","bemcPed");
dbMk->SetFlavor("Wbose","bemcCalib");
dbMk->SetFlavor("sim","bemcGain");
dbMk->SetFlavor("sim","bemcStatus");
Note: for BEMC ideal pedSigma set to 0, so effectively
there is no effect when I apply 3-sigma threshold above pedestal.
Figure 1: Sampling fraction (0.07*E_reco/E_thrown) distribution: average vs. gaussian fit
E_reco is the total energy in the BEMC towers from mMuDstMaker->muDst()->muEmcCollection()
E_thrown energy of the thrown photon from tne GEant record
The difference between fit and using average values is < 0.7%
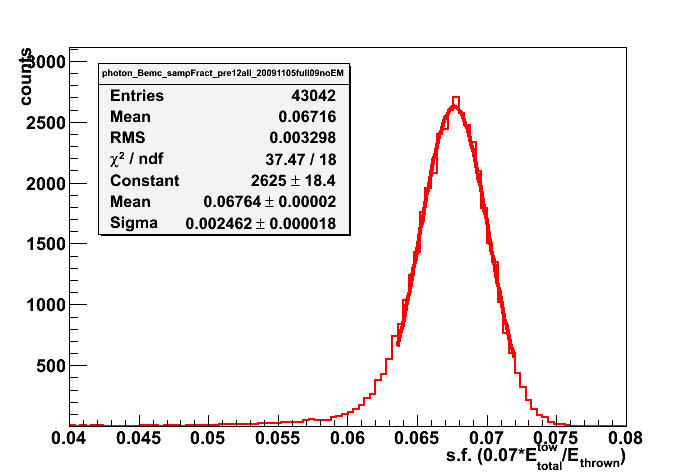
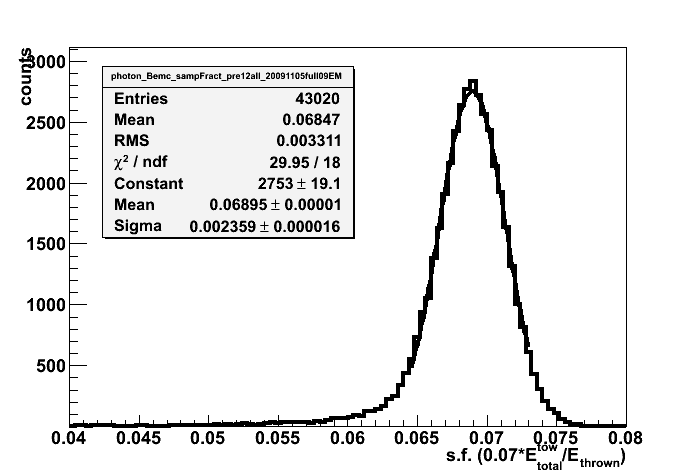
Figure 2: Otliers vs. eta and phi: (left) no energy reconstrycted, (right) s.f. < 55%
Most outlier are at eta = 0, -1, +1
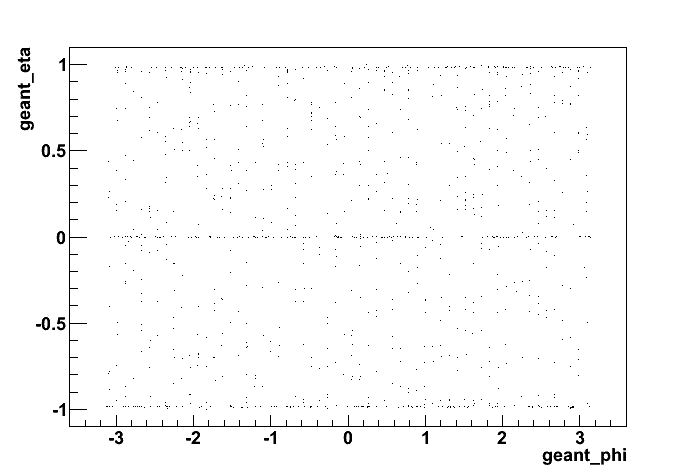

Figure 3: Sampling fraction (0.07*E_reco/E_thrown) distribution
Effect of LOW_EM cuts
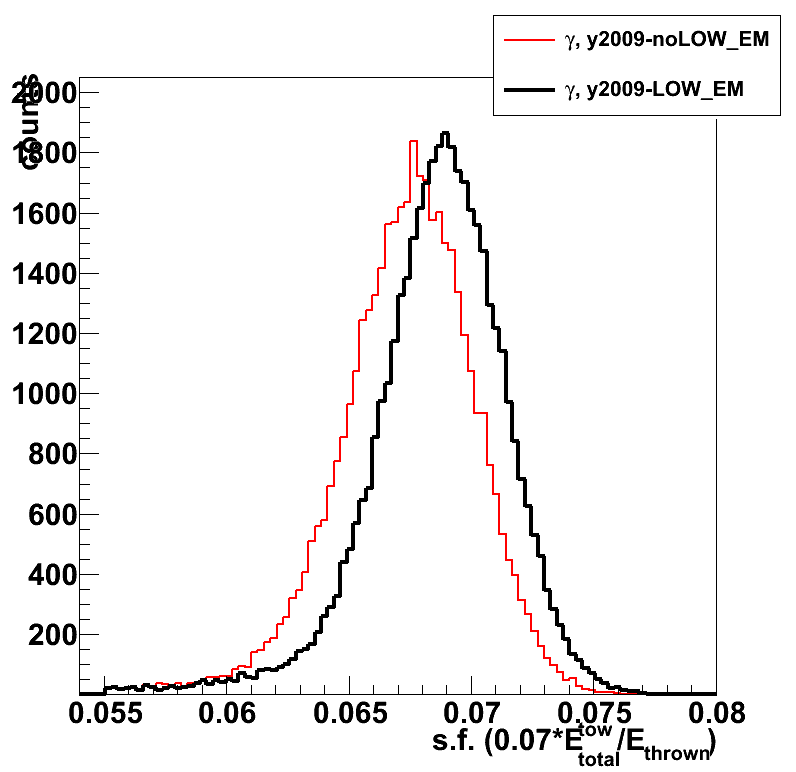

Figure 4: Sampling fraction vs. thrown photon eta (left) and phi (right)
Average is taken over a slice in eta or phi with cut on outliers (events with s.f. < 5.5% rejected)
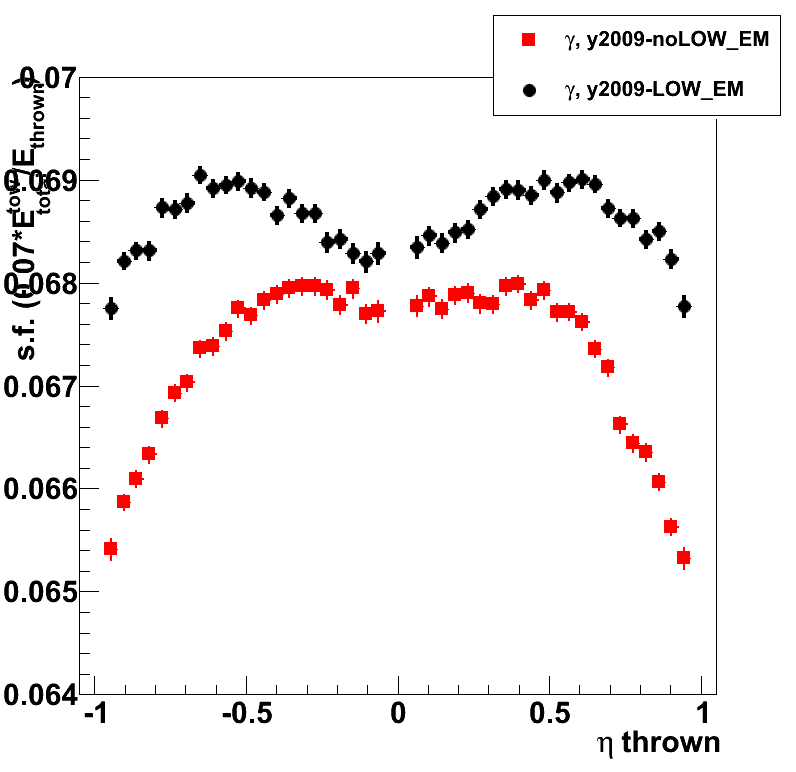

Figure 5: Sampling fraction vs. thrown position (eta and phi)
Average is taken over a slice in eta or phi with cut on outliers (events with s.f. < 5.5% rejected)
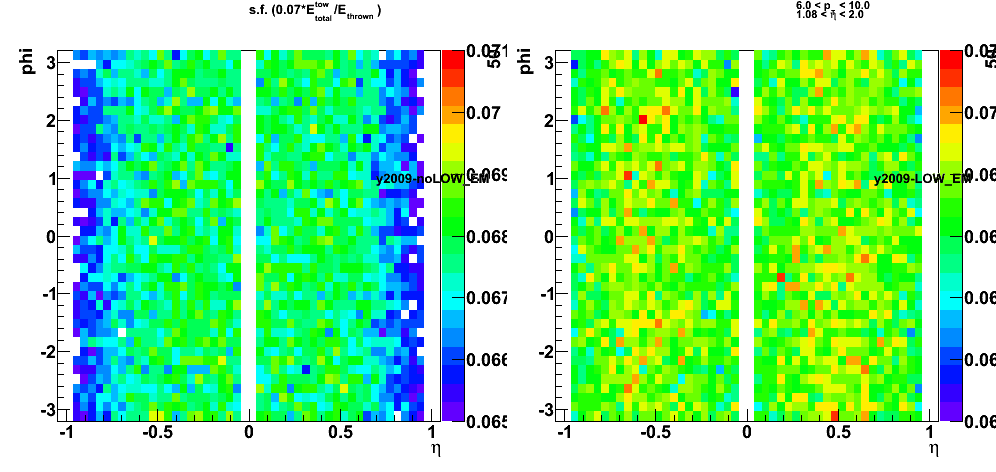
Figure 6: (left) Single tower sampling fraction
and (right) energy ratio of 1x1 cluster to the total BEMC energy
Not much of the effect from LOW_EM cuts on the 1x1 clustering. Need to look at other (2x1, 2x2 clusters)

