01 Jan
January 2010 posts
2010.01.04 y2006 vs y2009 EEMC pre-shower migration
Monte-Carlo setup:
- Throwing one photon per event
- Full STAR y2006h/y2009a
- Throw particles flat in eta (1.08, 2.0), phi (0, 2pi), and energy (5-35 GeV)
- Using A2Emaker to get reconstructed Tower/SMD energy (no EEMC SlowSimulator in chain)
- Vertex z=0
- ~50K/per particle type
- Non-zero energy: 3 sigma above pedestal
Geometry configurations:
- y6h:v6.2:10KeV y2006h after fixing TPC/EEMC overlap (CVS:2009/12/17)
- y6h:10KeV y2006h Mising TPC material bug is resolved (CVS:2009/12/29)
- y9a:10KeV y2009a after Mising TPC material bug is resolved (CVS:2009/12/29)
Note: results are with CVS before "15Deg rotated volume" bug being fixed
Figure 1:Pre-shower migration: y2006h (red - CVS:2009/12/17) vs. y2006h (black - CVS:2009/12/29)

Figure 2: Pre-shower migration: y2006h (red) vs. y2009a (black) all with CVS:2009/12/29

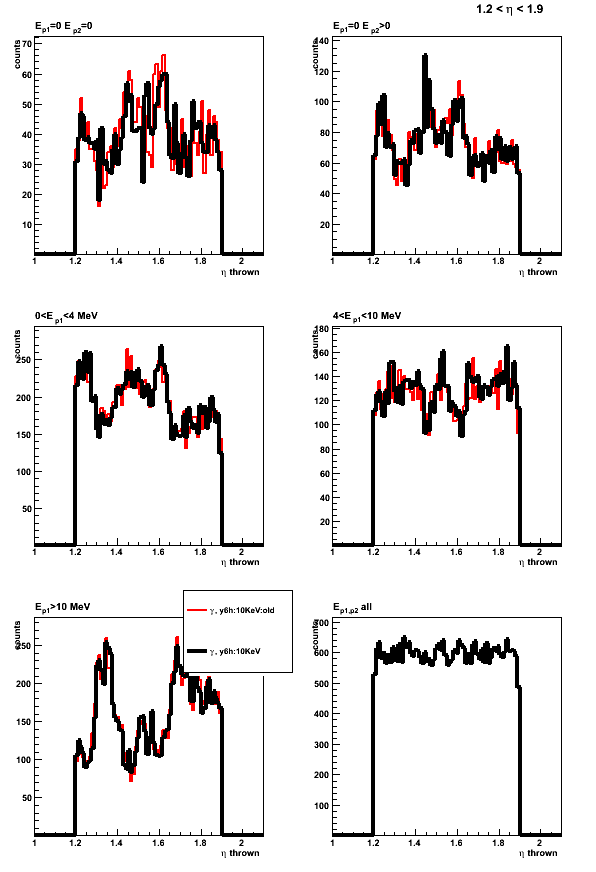
2010.01.07 EEMC response to single photons with y2006h vs y2009a geometries
Monte-Carlo setup
- Throwing one photon per event
- Full STAR y2006h/y2009a configurations
- Throw particles flat in eta (1.08, 2.0), phi (0, 2pi), and energy (5-35 GeV)
- Using A2Emaker to get reconstructed Tower/SMD energy (no EEMC SlowSimulator in chain)
- Vertex z=0
- ~50K/per particle type
- Non-zero energy: 3 sigma above pedestal
Geometry configurations:
- y6h:10KeV (black) - y2006h with emc_10KeV
- y9a:10KeV (red) - y2009a with emc_10KeV
STAR geometry includes the latest "15Deg rotated volume" bug bug fix
Figure 1: EEMC sampling fraction
(left) vs. thrown photon energy (with 1.2 < eta < 1.9 cut)
(right) vs. thrown photon eta
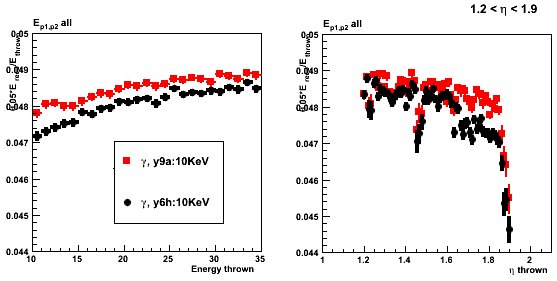
Figure 2: 2x1/3x3 clustering

Figure 3: Shower shapes (u plane)
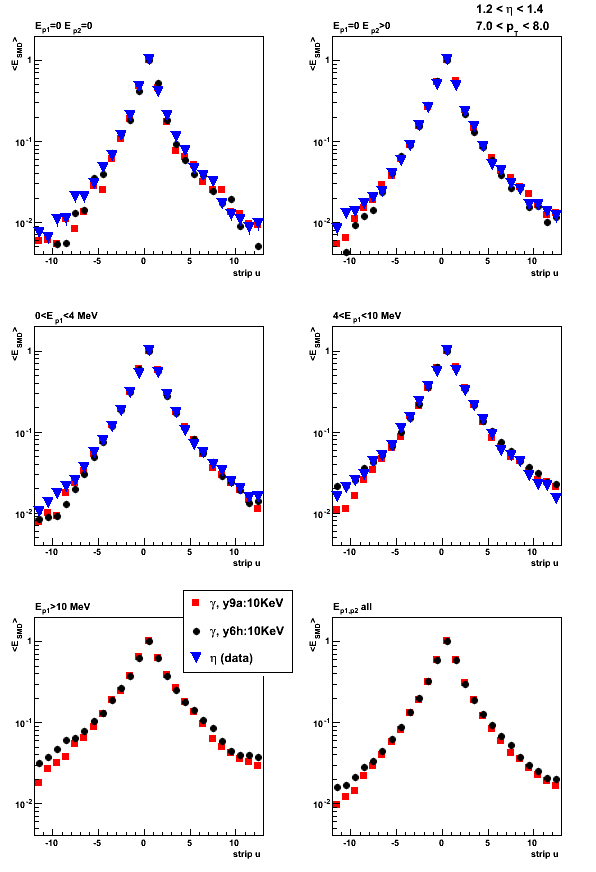
Figure 4: Shower shape ratios (u plane)

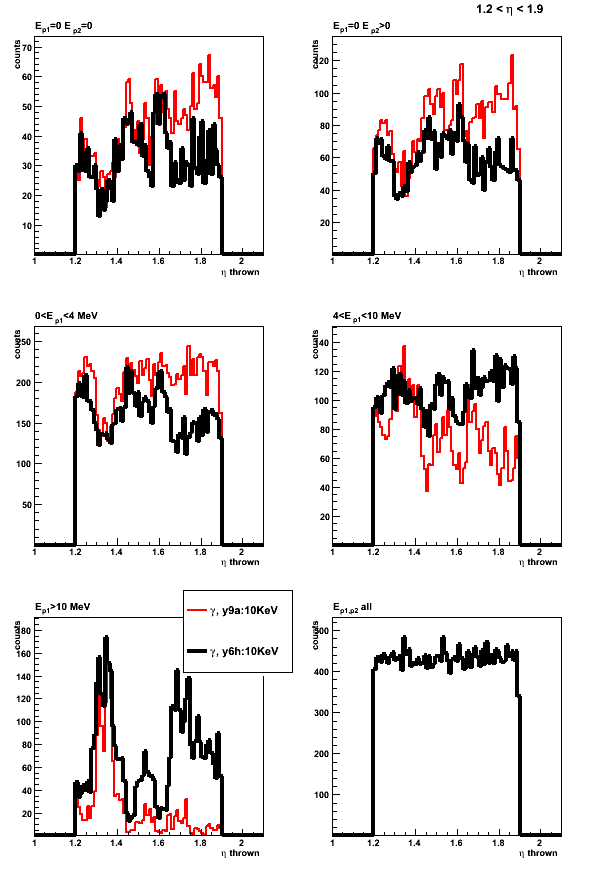
Figure 5: Pre-shower migration (1.2 < eta < 1.9)
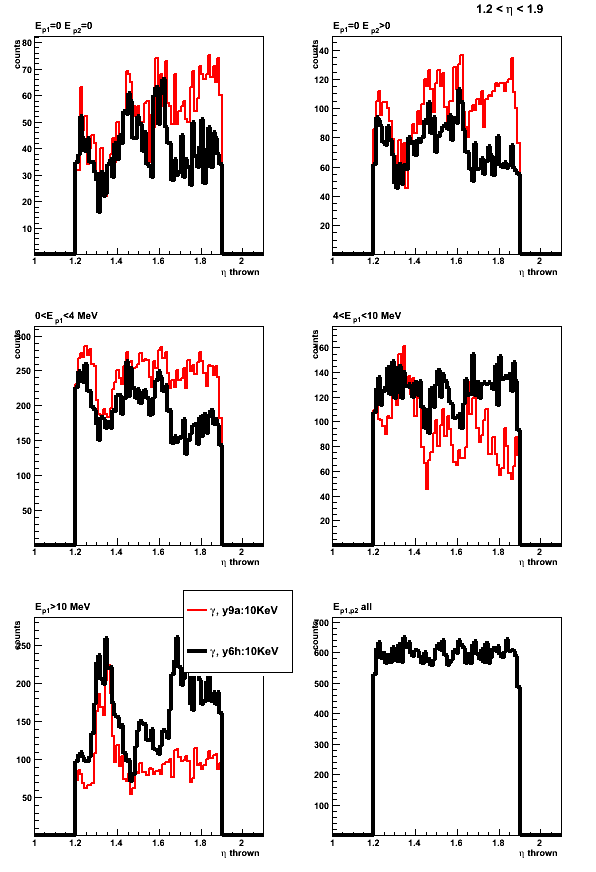
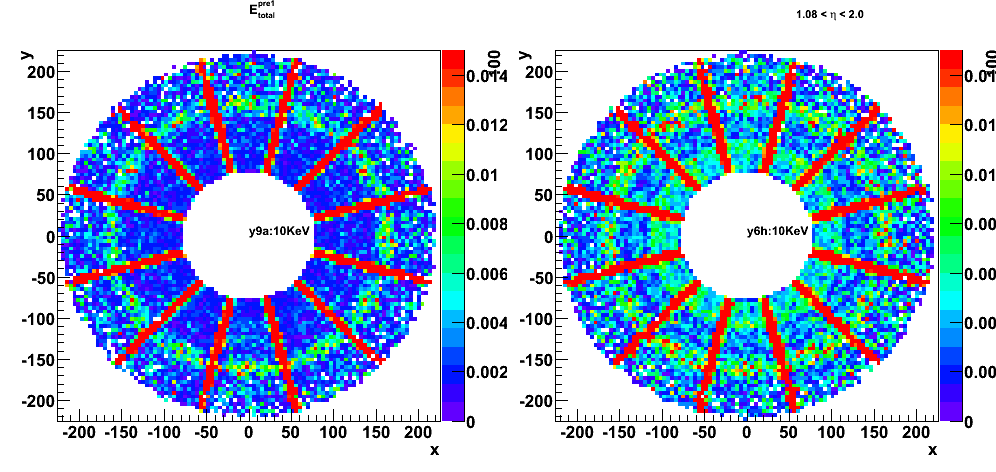
Figure 6: Average pre-shower1 energy vs. thown photon position in EEMC
(left) y2009a with emc_10KeV
(right) y2006h with emc_10KeV
2010.01.08 EEMC response 2006 vs. 2009: phi cuts
EEMC migration plots with cuts on TPC sector boundaries
Click here for results before phi cuts
Monte-Carlo setup
- Throwing one photon per event
- Full STAR y2006h/y2009a configurations
- Throw particles flat in eta (1.08, 2.0), phi (0, 2pi), and energy (5-35 GeV)
- Using A2Emaker to get reconstructed Tower/SMD energy (no EEMC SlowSimulator in chain)
- Vertex z=0
- ~50K/per particle type
- Non-zero energy: 3 sigma above pedestal
Geometry configurations:
- y6h:10KeV (black) - y2006h with emc_10KeV option
- y9a:10KeV (red) - y2009a with emc_10KeV option
Figure 1: Average pre-shower1 energy vs. thown photon position in EEMC
with cuts on TPC sector boundaries: cos(12*(phi-Pi/6.)) < -0.65 (similar plot before phi cuts)
(left) y2009a with emc_10KeV
(right) y2006h with emc_10KeV
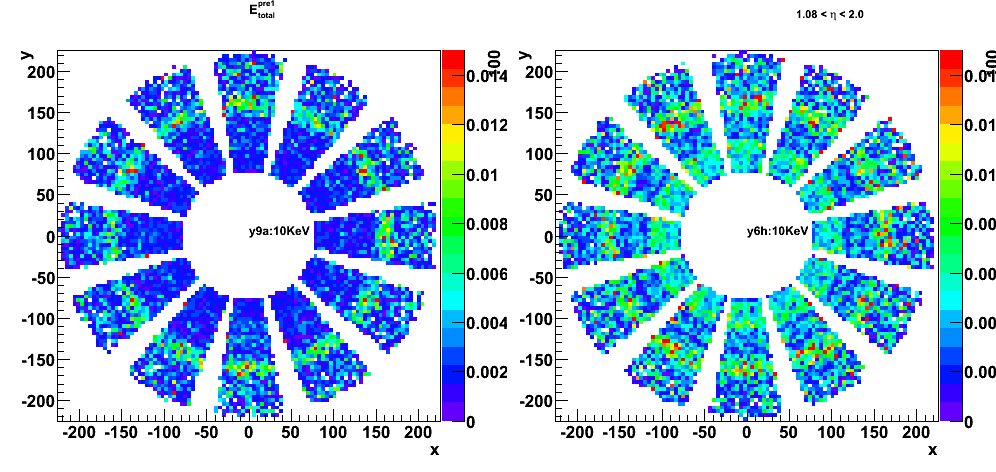
Figure 2: Pre-shower 1 sampling fraction (E_pre1/E_thrown) vs. thrown eta
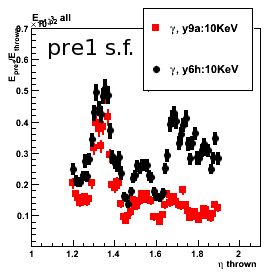
Figure 3: EEMC sampling fraction
(left) vs. thrown photon energy (with 1.2 < eta < 1.9 cut)
(right) vs. thrown photon eta
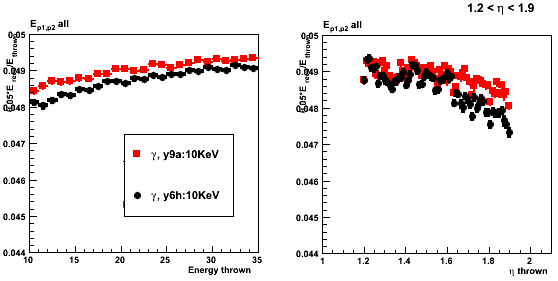
Figure 4: Pre-shower migration (1.2 < eta < 1.9)
2010.01.12 W test sample QA
All plost from second (with vertex distribution) test W-sample from Lidia/Jason.
generated files are from /star/rcf/test/Wprod_test2/
The previous sample with fixed (zero) vertex can be found was announced here:
http://www.star.bnl.gov/HyperNews-star/protected/get/starsimu/435.html
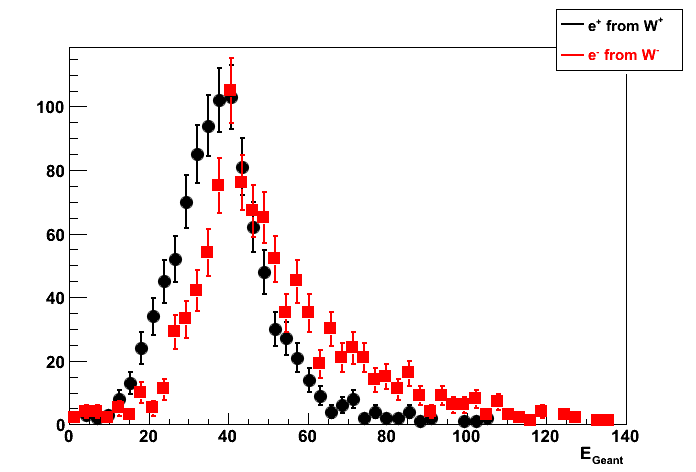
Figure 1: Electron from W decay (a) eta, (b) phi, (c) pt and (d) energy distributions
from geant record (no kinematic cuts)


Figure 2: Reconstructed vs. geant vertex (Cuts: abs(geant_eta_electron) < 1)
(left) difference, (right) ratio
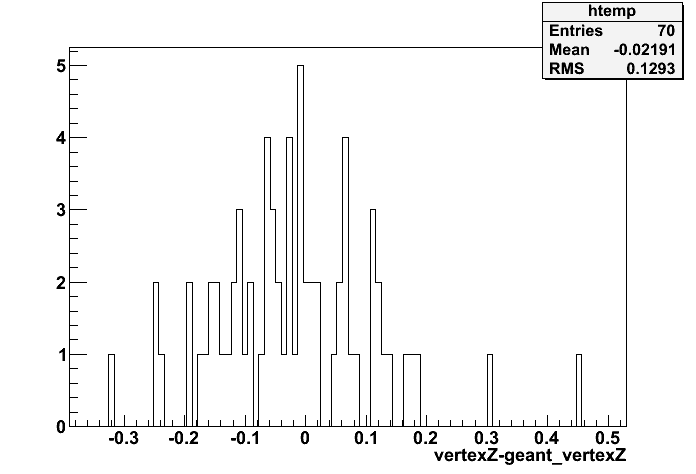

Figure 3:
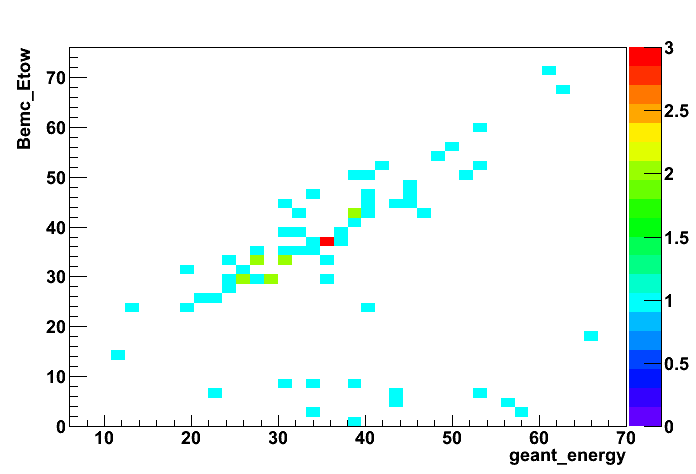
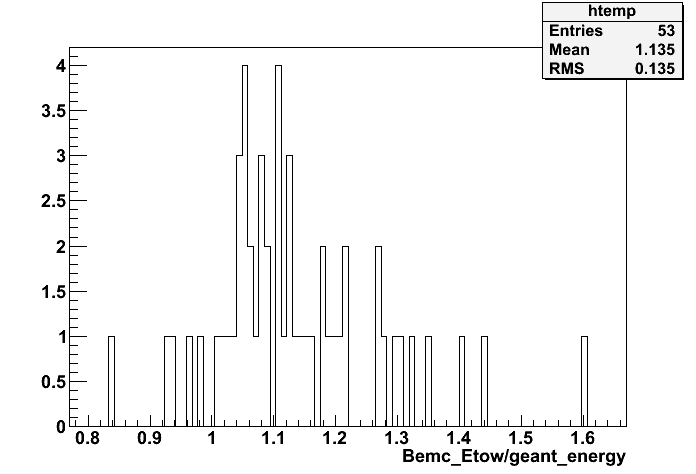
(left) Correlation between thrown and reconsructed energy: abs(geant_eta_electron) < 1
(right) ratio of the reconsructed to thrown energy (Bemc_Etow > 25)
Reconstructed energy is the total energy in all Barrel towers
Data base setup
The follwoing DB tables are used to read MuDst (dbMk->SetDateTime(20090325,0)):
StEmcSimulatorMaker:INFO - loaded a new bemcPed table with beginTime 2009-03-24 22:16:13 and endTime 2009-03-26 06:03:44
StEmcSimulatorMaker:INFO - loaded a new bemcStatus table with beginTime 2009-03-24 02:16:58 and endTime 2009-03-26 04:07:02
StEmcSimulatorMaker:INFO - loaded a new bemcCalib table with beginTime 2008-12-15 00:00:02 and endTime 2037-12-31 12:00:00
StEmcSimulatorMaker:INFO - loaded a new bemcGain table with beginTime 1999-01-01 00:08:00 and endTime 2037-12-31 12:00:00
StEmcSimulatorMaker:INFO - loaded a new bprsPed table with beginTime 2008-03-04 10:30:56 and endTime 2037-12-31 12:00:00
StEmcSimulatorMaker:INFO - loaded a new bprsStatus table with beginTime 2008-12-15 00:00:00 and endTime 2037-12-31 12:00:00
StEmcSimulatorMaker:INFO - loaded a new bprsCalib table with beginTime 1999-01-01 00:10:00 and endTime 2037-12-31 12:00:00
StEmcSimulatorMaker:INFO - loaded a new bprsGain table with beginTime 1999-01-01 00:08:00 and endTime 2037-12-31 12:00:00
StEmcSimulatorMaker:INFO - loaded a new bsmdePed table with beginTime 2009-03-24 15:42:29 and endTime 2009-03-25 11:24:55
StEmcSimulatorMaker:INFO - loaded a new bsmdeStatus table with beginTime 2009-03-24 15:42:29 and endTime 2009-03-25 11:24:55
StEmcSimulatorMaker:INFO - loaded a new bsmdeCalib table with beginTime 2002-11-14 00:01:00 and endTime 2037-12-31 12:00:00
StEmcSimulatorMaker:INFO - loaded a new bsmdeGain table with beginTime 1999-01-01 00:08:00 and endTime 2037-12-31 12:00:00
StEmcSimulatorMaker:INFO - loaded a new bsmdpPed table with beginTime 2009-03-24 15:42:29 and endTime 2009-03-25 11:24:55
StEmcSimulatorMaker:INFO - loaded a new bsmdpStatus table with beginTime 2009-03-24 15:42:29 and endTime 2009-03-25 11:24:55
StEmcSimulatorMaker:INFO - loaded a new bsmdpCalib table with beginTime 2002-11-14 00:01:00 and endTime 2037-12-31 12:00:00
StEmcSimulatorMaker:INFO - loaded a new bsmdpGain table with beginTime 1999-01-01 00:08:00 and endTime 2037-12-31 12:00:00
StEmcSimulatorMaker:INFO - loaded a new bemcTriggerStatus table with beginTime 2009-03-23 07:50:04 and endTime 2009-04-01 18:10:03
StEmcSimulatorMaker:INFO - loaded a new bemcTriggerPed table with beginTime 2009-03-20 04:11:43 and endTime 2009-03-30 20:00:05
StEmcSimulatorMaker:INFO - loaded a new bemcTriggerLUT table with beginTime 2009-03-23 07:50:04 and endTime 2009-04-03 22:08:11
2010.01.13 W test sample QA: Pass 2
http://drupal.star.bnl.gov/STAR/node/16704
QA of the test W-sample from Lidia/Jason.
generated MuDst are from /star/simu/jwebb/01-11-2010-w-test-production/
QA plots for the previous pass can be found here
Two channels being analyzed:
- wtest10000 W+ --> e+ nu (shown by black line)
- wtest10001 W- --> e- nu (shown by red line)
Cuts: |geant_eta_lepton| < 1
Discussions can be found here:
http://www.star.bnl.gov/HyperNews-star/protected/get/starsimu/440.html
Figure 1: (left) Reconstructed vertex z distribution
(right) reconstructed minus geant z-vertex
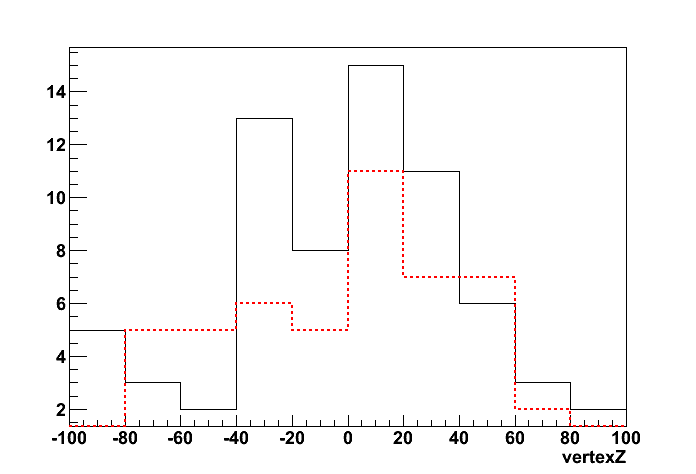

Figure 2: E2x2/E_geant energy ratio
Black: positron from W+, mean value= 0.972973;
Red - electron from W- mean value = 0.969773
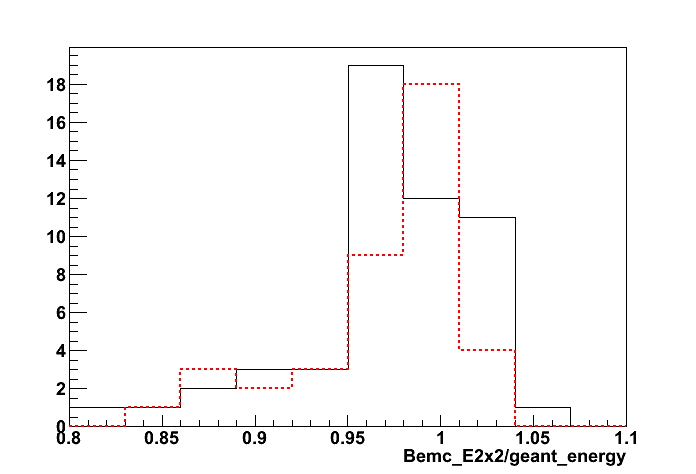
Figure 3: E1x1/E_geant (highest tower) energy ratio
Black: positron from W+, mean value= 0.815287;
Red - electron from W- mean value = 0.812098
![]()
Update on Jan 14, 2010
Figure 4: Lepton E2x2/E_geant energy ratio
| Parameter | black: positron from W+ | red: electron from W- |
| gaus-Constant | 1.60709e+01 , err=3.08565e+00 | 1.56834e+01 , err=4.71967e+00 |
| gaus-Mean | 9.85514e-01 , err=4.94309e-03 | 9.86118e-01 , err=5.43577e-03 |
| gaus-Sigma | 3.15205e-02 , err=3.73952e-03 | 2.52009e-02 , err=6.57793e-03 |
| Hist-Mean | 0.972973 | 0.969773 |
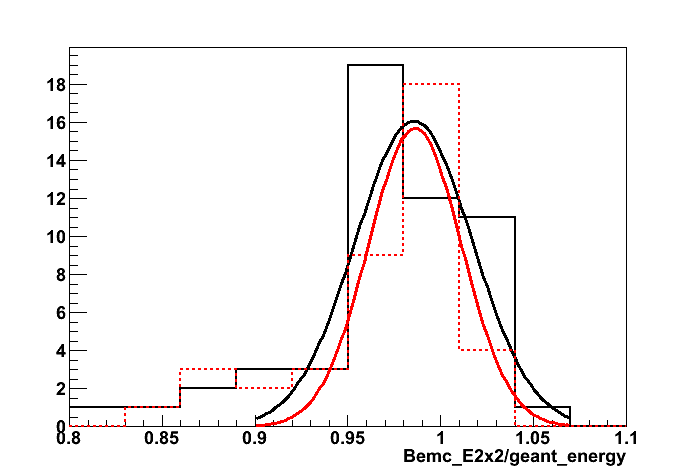
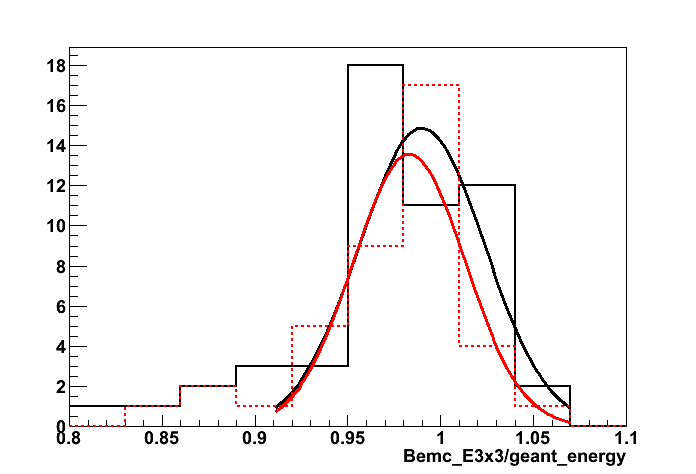
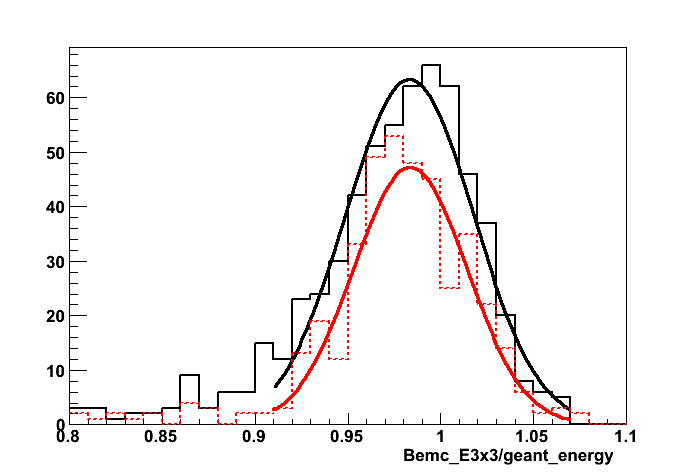
Figure 5: Lepton E3x3/E_geant energy ratio
| Parameter | black: positron from W+ | red: electron from W- |
| gaus-Constant | 1.48719e+01 , err=2.82186e+00 | 1.35741e+01 , err=3.36776e+00 |
| gaus-Mean | 9.89924e-01 , err=5.72959e-03 | 9.83056e-01 , err=6.28736e-03 |
| gaus-Sigma | 3.37758e-02 , err=4.24983e-03 | 3.00597e-02 , err=6.06841e-03 |
| Hist-Mean | 0.975662 | 0.974163 |
2010.01.15 W test sample QA: Pass 3
QA of the test W-sample from Lidia/Jason.
generated MuDst are from /star/data08/users/starreco/recowtest/
QA plots for the previous pass 2 can be found here
QA plots for the previous pass 1 can be found here
Two channels being analyzed:
- wtest10000 W+ --> e+ nu (shown by black line)
- wtest10001 W- --> e- nu (shown by red line)
Cuts: |geant_eta_lepton| < 1
Discussions can be found here:
http://www.star.bnl.gov/HyperNews-star/protected/get/starsimu/443.html
Figure 1: Reconstructed minus geant z-vertex
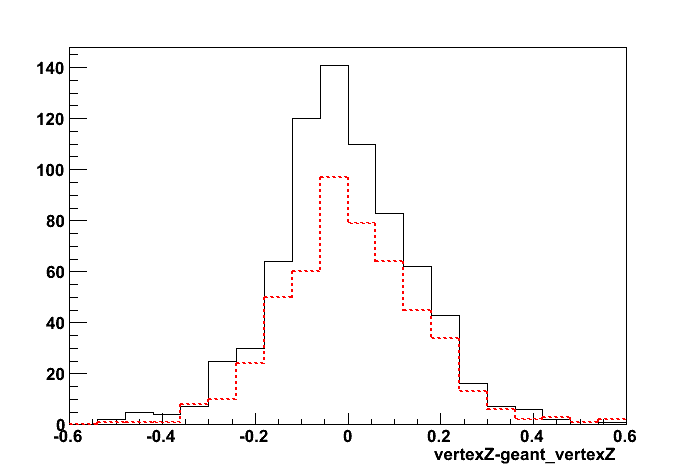
Figure 2: Lepton E2x2/E_geant energy ratio
| Parameter | black: positron from W+ | red: electron from W- |
| gaus-Constant | 6.24023e+01 , err=3.46979e+00 | 4.73536e+01 , err=3.16029e+00 |
| gaus-Mean | 9.79982e-01 , err=1.69854e-03 | 9.79787e-01 , err=1.68813e-03 |
| gaus-Sigma | 3.52892e-02 , err=1.40963e-03 | 3.15336e-02 , err=1.40759e-03 |
| Hist-Mean | 0.972122 | 0.975073 |

Figure 3: Lepton E3x3/E_geant energy ratio
| Parameter | black: positron from W+ | red: electron from W- |
| gaus-Constant | 6.33596e+01 , err=3.58862e+00 | 4.72335e+01 , err=3.19552e+00 |
| gaus-Mean | 9.83287e-01 , err=1.72276e-03 | 9.83632e-01 , err=1.67661e-03 |
| gaus-Sigma | 3.45514e-02 , err=1.48019e-03 | 3.05224e-02 , err=1.38944e-03 |
| Hist-Mean | 0.974372 | 0.977858 |
2010.01.18 EEMC response 2006 vs. 2009: typo in TPC volume size bug fix
Click here for previous study before TPC typo fix
Monte-Carlo setup
- Throwing one photon per event
- Full STAR y2006h/y2009a configurations
- Throw particles flat in eta (1.08, 2.0), phi (0, 2pi), and energy (5-35 GeV)
- Using A2Emaker to get reconstructed Tower/SMD energy (no EEMC SlowSimulator in chain)
- Vertex z=0
- ~50K/per particle type
- Non-zero energy: 3 sigma above pedestal
Before and after the fix comparison
Geometry configurations:
- y6h:10KeV:old (red) - y2006h with emc_10KeV option
- y6h:10KeV (black) - y2006h with emc_10KeV option, after TPC typo fixed
Figure 1: Pre-shower migration (1.2 < eta < 1.9)
y2006h vs. y2009a comparison after a TPC typo fix
Geometry configurations:
- y9a:10KeV (red) - y2009a with emc_10KeV option
- y6h:10KeV (black) - y2006h with emc_10KeV option
Figure 2: Pre-shower migration (1.2 < eta < 1.9): y2006h vs. y2009a

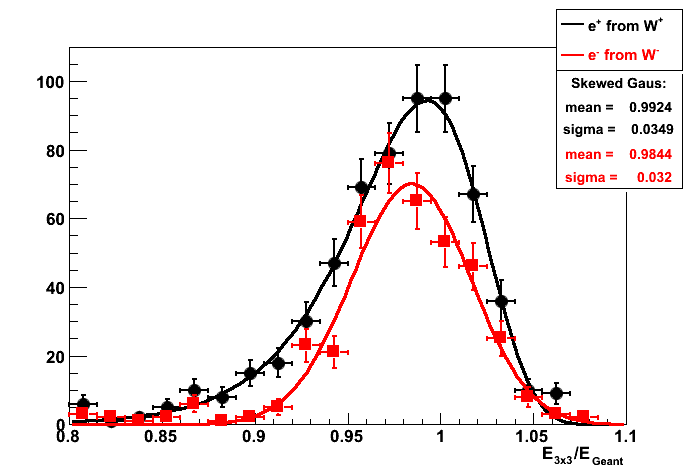
2010.01.18 W test sample: Cluster ratios and skewed gaussian fits
W test sample from Lidia/Jason. MuDst's from /star/data08/users/starreco/recowtest/
Two channels being analyzed:
- wtest10000 W+ -> e+ nu
- wtest10001 W- -> e- nu
Figure 1: Lepton yield vs. rapidity (no cuts)
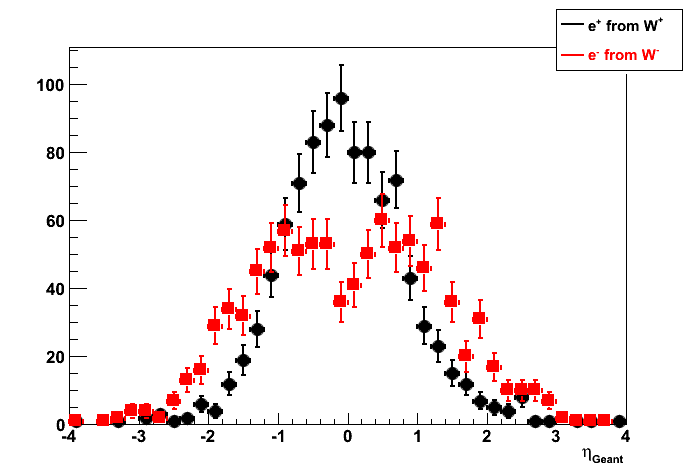
Figure 2: Lepton yield vs. pt and energy
(left) no rapidity cuts
(right) |lepton_eta| < 1
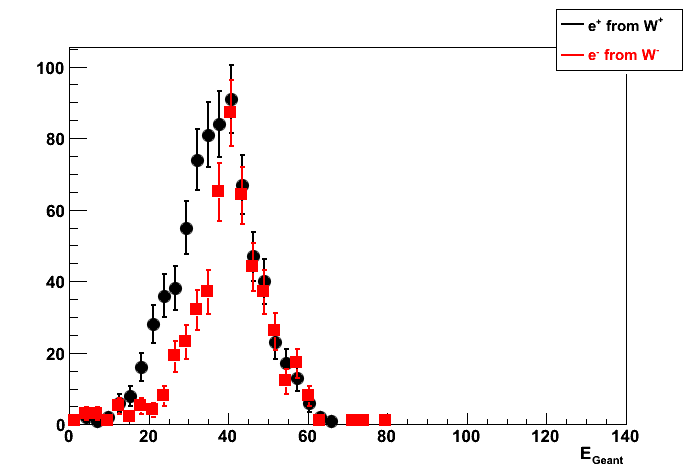
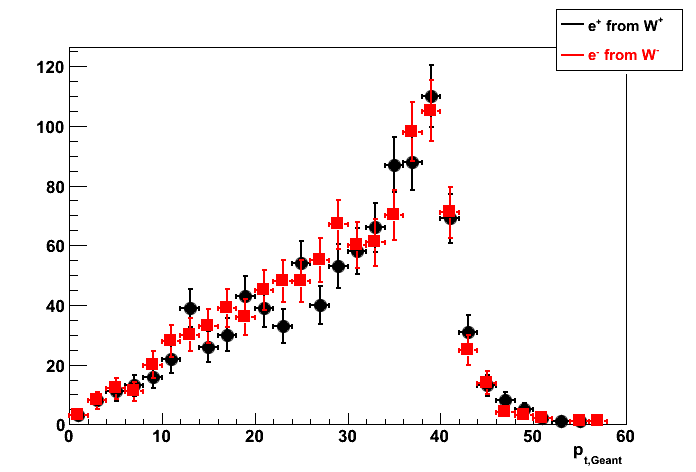

Cluster energy vs. original lepton energy
All plots below with |lepton_eta| < 1
Skewed gaussian fits: [const]*exp(-0.5*((x-[mean])/([sigma]*(1+[skewness]*(x-[mean]))))**2)
Figure 3: Lepton E1x1/E_geant energy ratio
![]()
Figure 4: Lepton E2x2/E_geant energy ratio
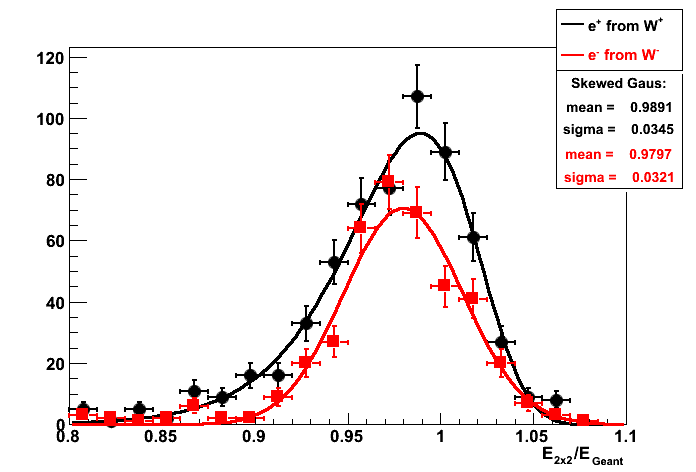
Figure 5: Lepton E3x3/E_geant energy ratio
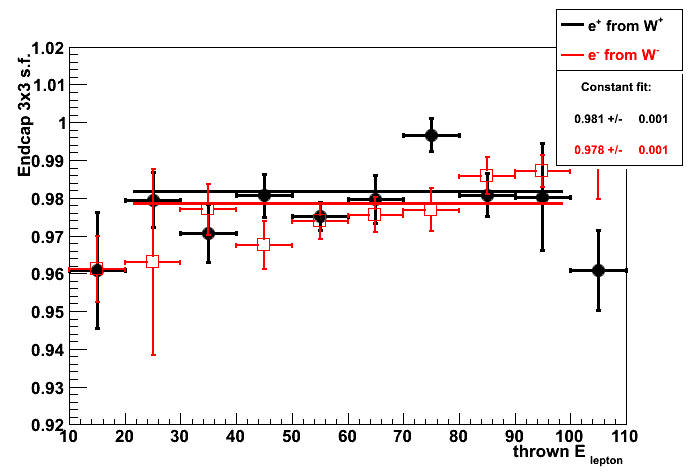
2010.01.26 Endcap/Barrel clustering with official W-MC
Simulations: official pp 500GeV pythia W production
Two channels being analyzed:
- W+ -> e+ nu (rcf10010*.root)
- W- -> e- nu (rcf10011*.root)
Lepton from W in the Endcap: 1.2 < eta_lepton < 1.9
Figure 1: Lepton yield vs. energy

Figure 2: Lepton (left) E1x1/E_thrown and (right) E2x2/E_thrown energy ratio
Skewed gaussian fits: [const]*exp(-0.5*((x-[mean])/([sigma]*(1+[skewness]*(x-[mean]))))**2)
![]()

Figure 3: Endcap EMC lepton E3x3/E_thrown energy ratio
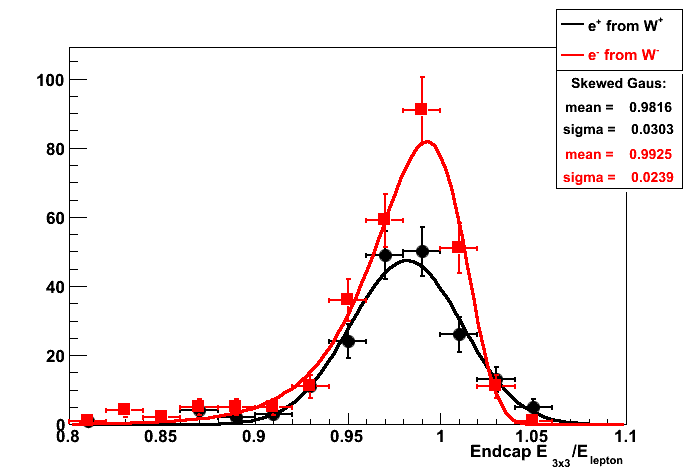
Figure 4: Endcap 2x2 sampling fraction (s.f.) vs. thrown lepton (left) energy and (right) eta
S.f. is defined as an average E_2x2/E_thrown for E_2x2/E_thrown>0.8

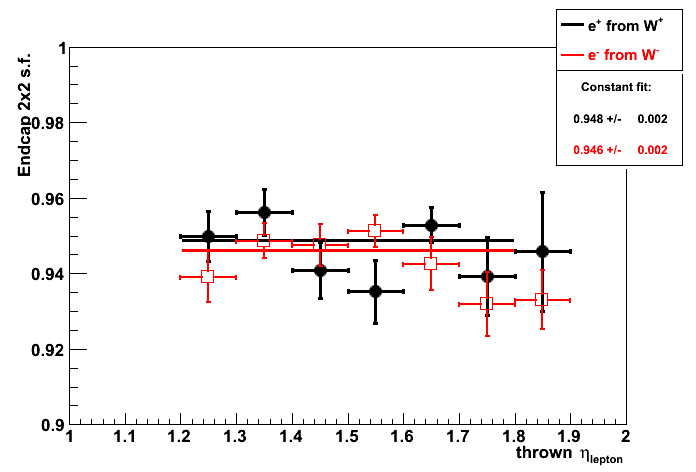
Figure 5: Endcap 3x3 sampling fraction (s.f.) vs. thrown lepton (left) energy and (right) eta
S.f. is defined as an average E_3x3/E_thrown for E_3x3/E_thrown>0.8

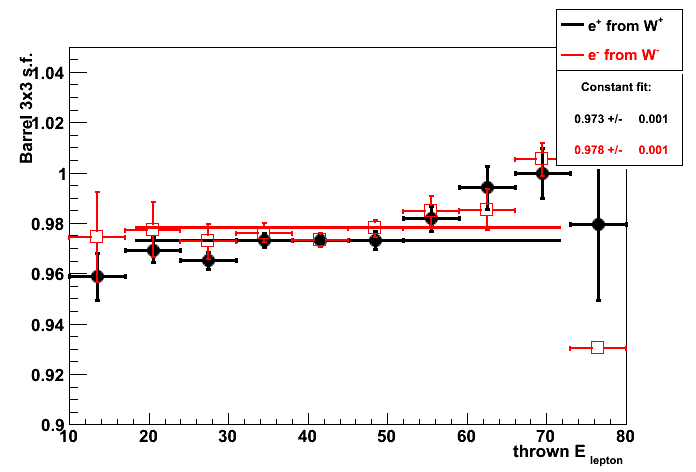
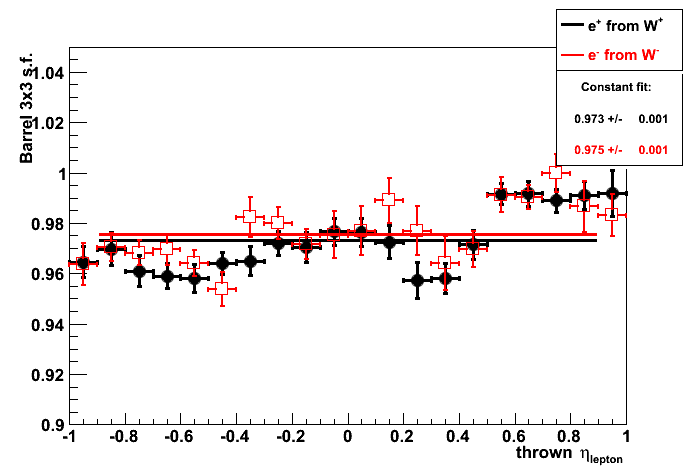
Lepton from W in the Barrel: |eta_lepton| <1
Figure 6: Lepton yield vs. energy
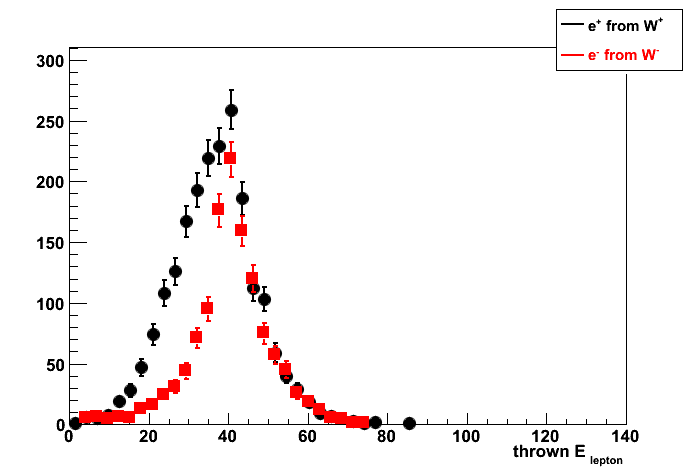
Figure 7: Lepton (left) E1x1/E_thrown and (right) E2x2/E_thrown energy ratio
![]()

Figure 8: Barrel EMC lepton E3x3/E_thrown energy ratio
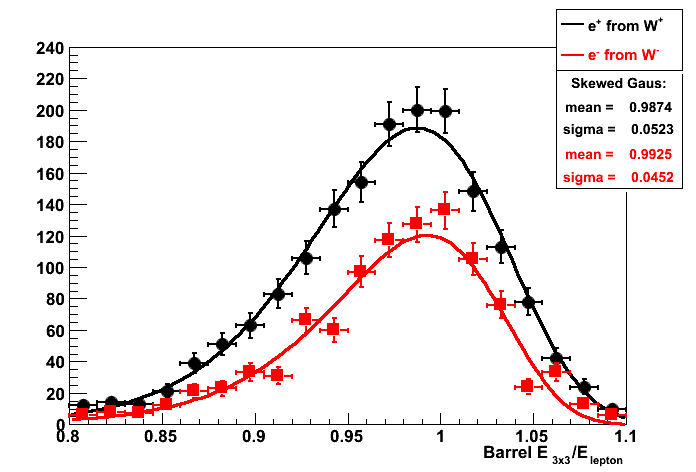
Figure 9: Barrel 2x2 s.f. vs. thrown lepton (left) energy and (right) eta
S.f. is defined as an average E_2x2/E_thrown for E_2x2/E_thrown>0.8


Figure 10: Barrel 3x3 s.f. vs. thrown lepton (left) energy and (right) eta
S.f. is defined as an average E_3x3/E_thrown for E_3x3/E_thrown>0.8