2005 Dijet
Supporting documentation on the 2005 Dijet Paper, targetted for PRDRC
Title: Dijet production in proton-proton collisions at sqrt(s) = 200 GeV
PAs: Matthew Walker, Joseph Seele, Bernd Surrow
Abstract:
We report the first STAR measurement of the differential cross section for midrapidity dijet production in proton-proton collisions at sqrt{s}=200 GeV. The cross section data cover invariant mass $20<M<117 GeV/c^2 and agree well with next-to-leading order perturbative QCD calculations.
Summary:
In summary, a measurement of the cross section for dijet production at midrapidity with the STAR detector at RHIC is reported over the invariant mass range 20 < M < 117 (GeV/c^2). Good agreement with a NLO pQCD calculation after applying a correction for underlying event and hadronization is observed. This agreement motivates the use of pQCD calculations for comparisons to spin observables, such as the longitudinal double-helicity asymmetry, A_{LL}, which can be used to obtain constraints on the polarized parton distributions in the proton. Increased detector acceptance and luminosity in future data sets make this measurement appealing. Furthermore, the framework is already in place to incorporate a dijet A_{LL} into a global fit.
Proposed Figures (order may differ in paper):
Fig. 1 Data Simulation Comparison (pdf attached)
Caption: (Left panel top) The comparison of data (red) and simulation (blue) yields as a function of invariant mass. The simulation normalization has been set so the integrals of data and simulation are the same over the range 20 to 86 GeV/c^2 in invariant mass. (Left panel bottom) The ratio of data to simulation as a function of invariant mass. (Center panels) The comparison of data and simulation and the ratio of data to simulation as a function ofeta_{34} = \frac{\eta_3 + \eta_4}{2}. (Right panels) The comparison of data and simulation and the ratio of data to simulation as a function of cos{\theta^*}.

Fig. 2 Cross Section (pdf attached)
Caption: (top panel) Differential cross section for p + p \rightarrow \textrm{jet} + \textrm{jet} + X at \sqrt{s} = 200 GeV vs dijet invariant mass for a jet cone radius of 0.4. The data in each bin are marked with the black line depicting the bin width and statistical uncertainties as a vertical line. Systematic uncertainties for the data are shown in yellow bands. The single hashed bands are the NLO calculation from de Florian. with scale uncertainties. The double hashed bands are the same calculation with the hadronization and underlying event correction applied. (bottom panel) Comparison of theory and data. The data are compared to the theory calculation with hadronization and underlying event correction. The same statistical and systematic uncertainty bands are shown along with the scale uncertainties.
Fig. 2 version 2 (pdf attached)
.png)
Fig. 3 Event Display (not final):
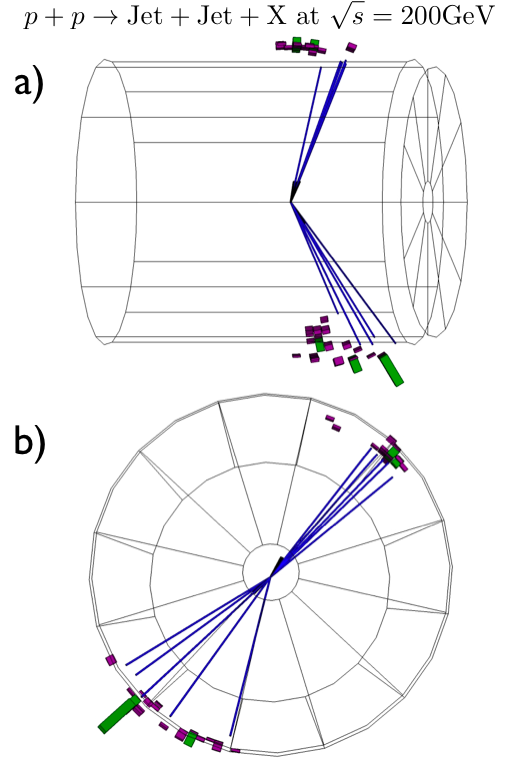
Fig. 4 Lego plots (not final):
.png)