Radial OmegaTau (OmegaTauR) Calibration
Using lasers on the west end of the TPC, where there is no shorted ring, we have introduced distortions in the electric field by two methods: 1) adding extra resistance to the IFC resistor chain, and 2) altering the gating grid voltage. We collected data such that we have two reference (non-distorted) runs for the former, and four modifications (different gating grid voltages) for the latter (two of which have been used in this analysis)
For both of these techniques, we can compare the distorted laser tracks to the undistorted ones at the same location, and also to the corrected (using StMagUtilities code) versions of the distorted tracks. This allows us to determine how much we are under- or over-correcting the distortion for a given OmegaTauR. In this analysis, the initial value for OmegaTauR used in the corrections is 2.29.
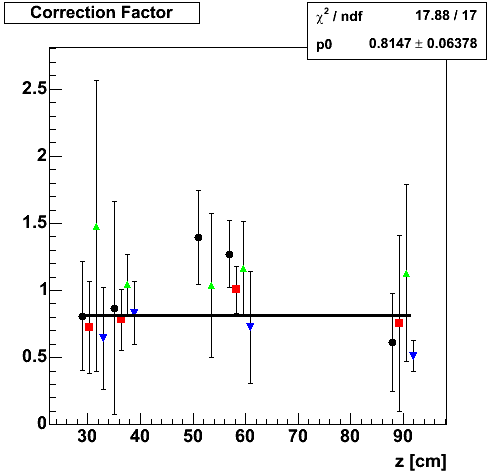
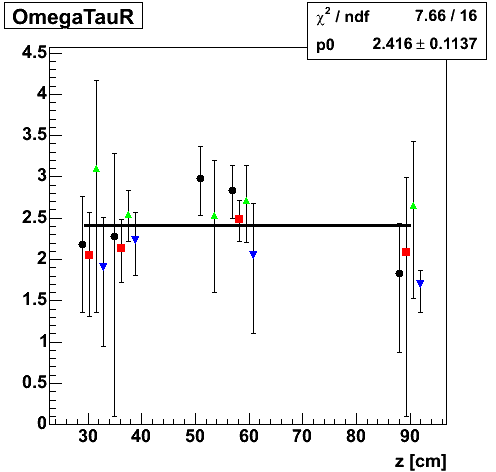
At the bottom of this page are plots showing fits to the amount of under- or over-correction seen for several laser beams from the different data sets. The amount of under- or over-correction is then used to determine what OmegaTauR for that laser beam should be. The plot immediately below is a fit to those different OmegaTauRs, using 5 laser beams at 3 different approximate z locations (~30cm, ~50cm, ~85cm), from 4 different datasets:
- Black circles = Resistor runs, 5063105 vs. 5063104 (in vs. out [normal])
- Red squares = Resistor runs, 5063105 vs. 5063106 (in vs. out [normal])
- Green triangles = Gating grid runs, 5022008 vs. 5022006 (-165V vs -115V [nominal)
- Blue inverted triangles = Gating grid runs, 5022010 vs. 5022006 (-65V vs -115V [nominal])
The different datasets are offset in z in the plot in order to make the points visible, but the same laser beam is used in each of the 4 datasets. The final fit value of OmegaTauR using the 5 laser beams is 2.32 +/- 0.02.
CONCLUSION: We should use a value for OmegaTauR of 2.3.
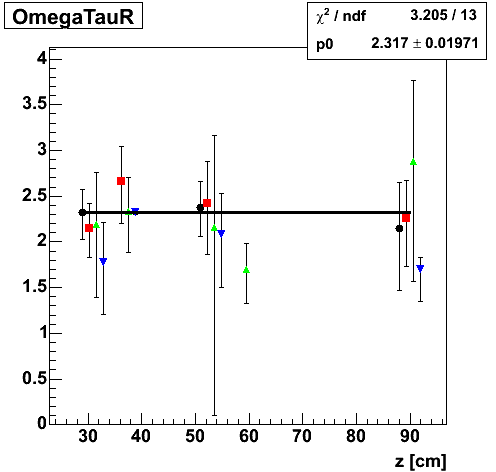
The location z is measured as distance from the central membrane, with positive z in the west half of the TPC.
Individual laser beams:
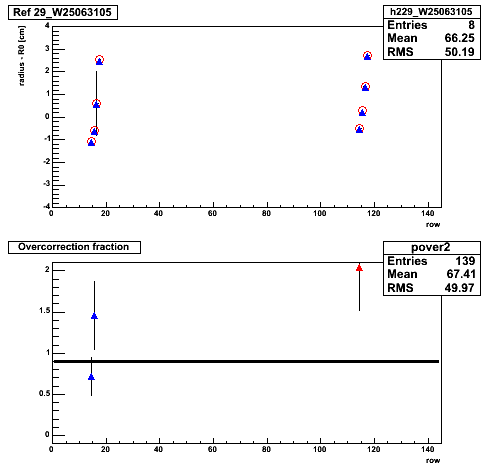
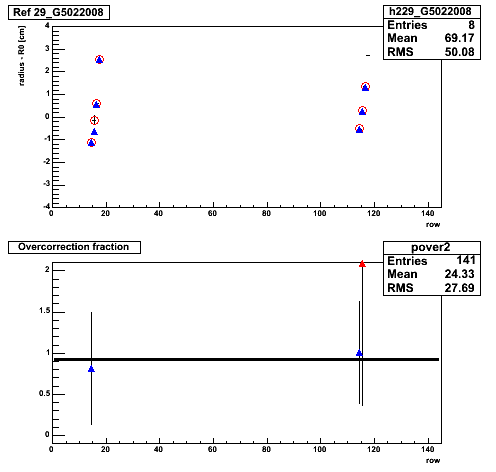
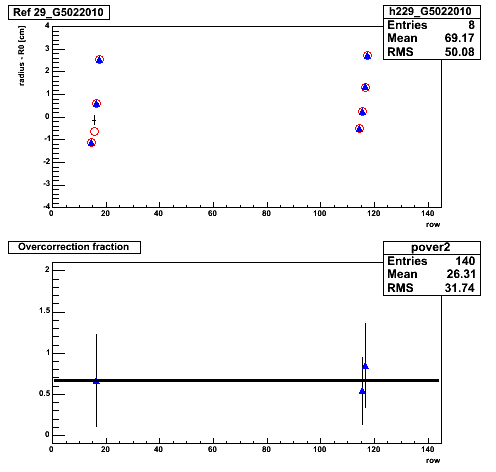
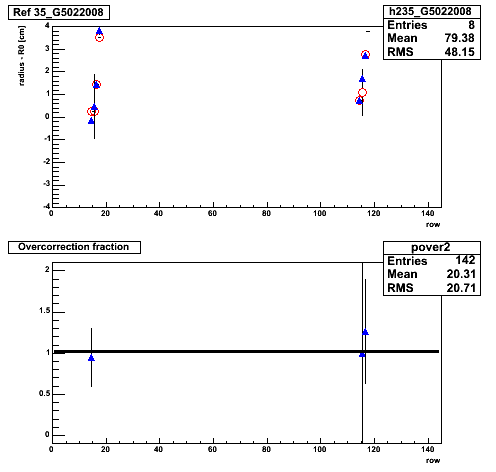
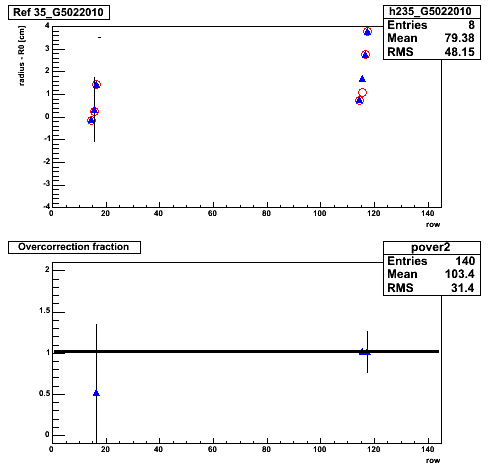
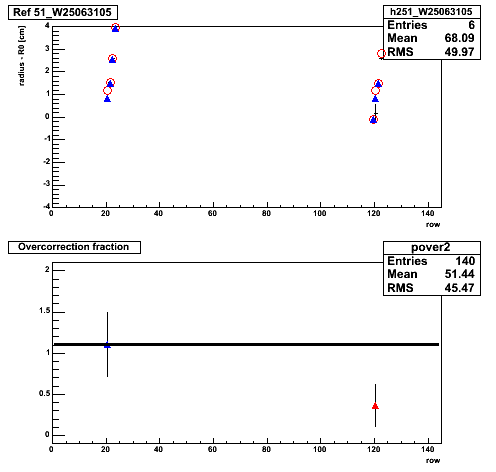
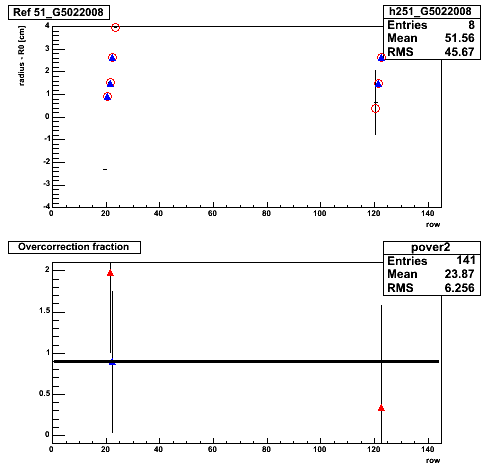
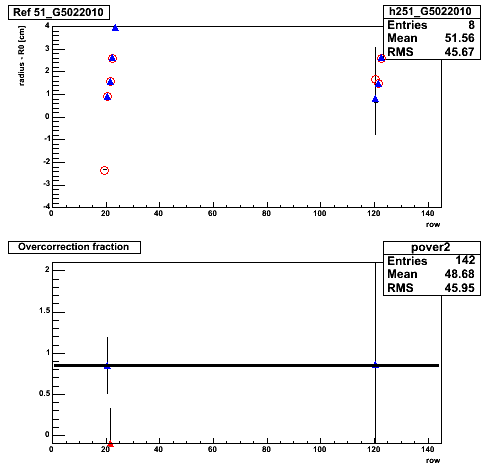
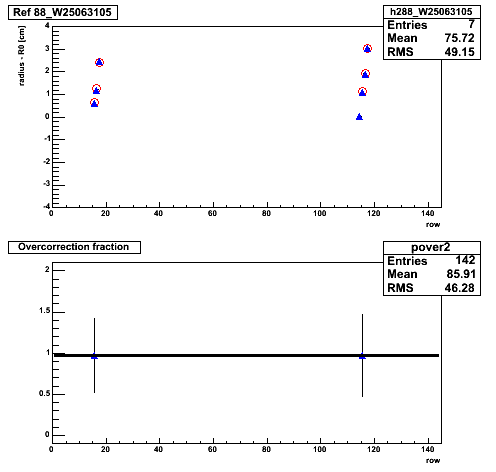
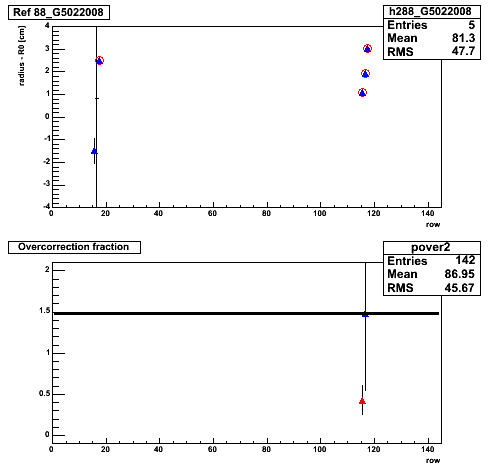
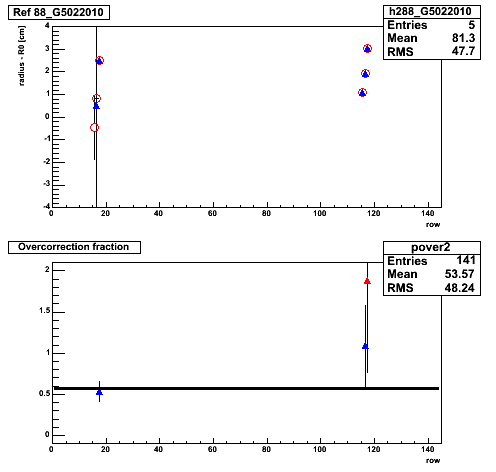
The under- or over-correction is fit only for the first row or two of each laser in each sector as these are the only places where the laser is close to tangential. Shown in the plots below are the radius (relative to some arbitrary radial constant R0) as a function of padrow, where padrows 1-45 and 101-145 represent the two different sectors about the closest approach. Outliers (under- or over-correction > 55%) are also removed from the fit (shown as red points in the lower of each plot pair).
While multiple laser beams are from the same approximate z range, different z locations are used below to differentiate them (they are at different phi locations).
Also noticeable in the above plot is that the gating grid run datasets give OmegaTauR values with larger errors than the resistor runs. This is again because the corrections are smaller for the gating grid runs, leading to a larger relative error in the correction. This is also why other gating grid runs, taken at intermediate voltages, were not used in this analysis.
As usual, in the upper of each plot pair, distorted laser points are in red, corrected are in blue, and the reference points are black.
| z \ runs | Resistor Runs | Gating Grid Runs | ||
|---|---|---|---|---|
| 5063105 vs. 5063104 | 5063105 vs. 5063106 | 5022008 vs. 5022006 | 5022010 vs. 5022006 | |
| 29 cm | 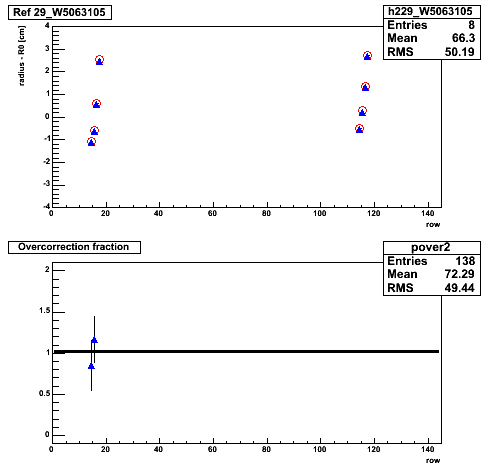 |
 |
 |
 |
| 35 cm | 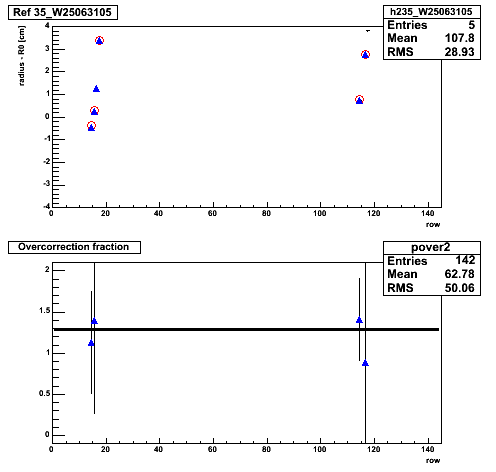 |
 |
 |
|
| 51 cm | 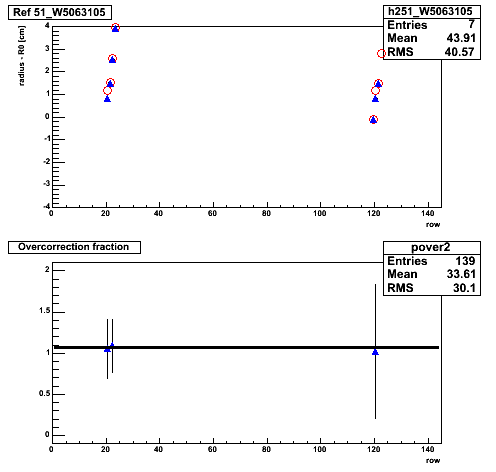 |
 |
 |
 |
| 57 cm | 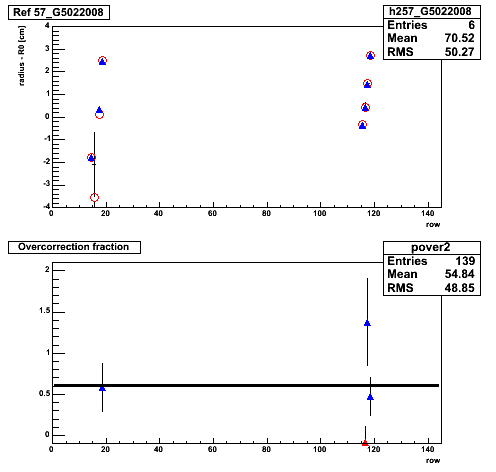 |
|||
| 88 cm | 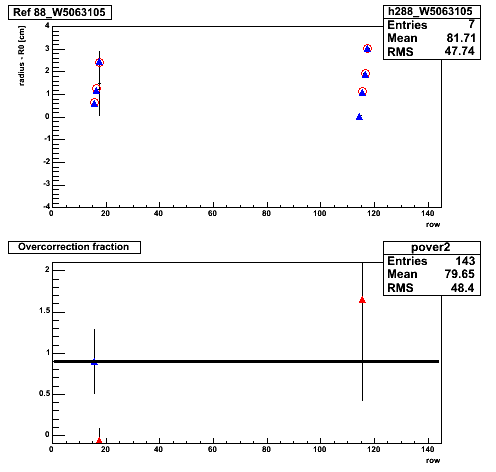 |
 |
 |
 |
Alternate fits:
In addition to the fit described above for finding OmegaTauR, a few alternative fits were used:
- Using an initial OmegaTauR of 2.48 to process the data in the first place (insurance that the fit does not simply return something like what was used in the reconstruction) yields OmegaTauR = 2.42 +/- 0.11.
- Fitting all of the correction factors from all lasers to determine one overall correction factor, and then determining OmegaTauR from that single new correction factor yields, for the two reconstructions using initial OmegaTauR values of 2.29 and 2.48 respectively, OmegaTauR = 2.30 +0.02 -0.02, and OmegaTauR = 2.20 +0.10 -0.11.
Initial OmegaTauR = 2.76:
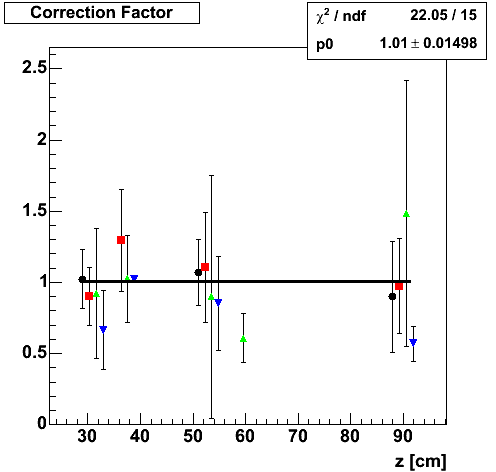
Initial OmegaTauR = 2.48:
