Solid State Drives (SSD) vs. Serial Attached SCSI (SAS) vs. Dynamic Random Access Memory (DRAM)
INTRODUCTION
This page will provide summary of SSD vs SAS vs DRAM testing using SysBench tool. Results are grouped like this :
- FS IO performance tests;
- Simulated/artificial MySQL load tests;
- STAR Offline API load tests;
Filesystem IO results are important to understand several key aspects, like :
- system response to parallel multi-client access (read,write,mixed);
- cost estimation: $/IOP/s and $/MB of storage;
Simulated MySQL load test is critical to understand strengths and weaknesses of MySQL itself, deployed on a different types of storage. This test should provide baseline for real data (STAR Offline DB) performance measurements and tuning - MySQL settings could be different for SAS and SSD.
Finally, STAR Offline API load tests should represent real system behavior using SAS and SSD storage, and provide an estimate of the potential benefits of moving to SSD in our case of ~1000 parallel clients per second per db node (we have dozen of Offline DB nodes at the moment).
While we do not expect DRAM to become our primary storage component, these tests will allow to estimate the benefit of partial migration of our most-intensively used tables to volatile but fast storage.
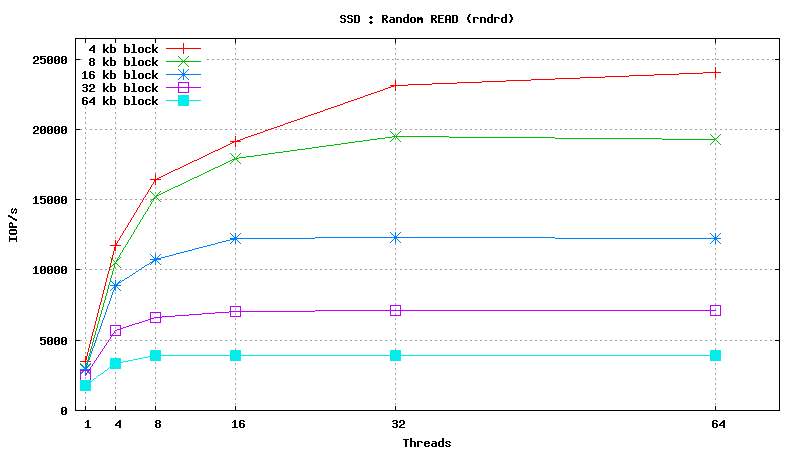
Basic results of filesystem IO testing :
- Serial Attached SCSI drive testing results taken with default CFQ scheduler and noatime mount option;
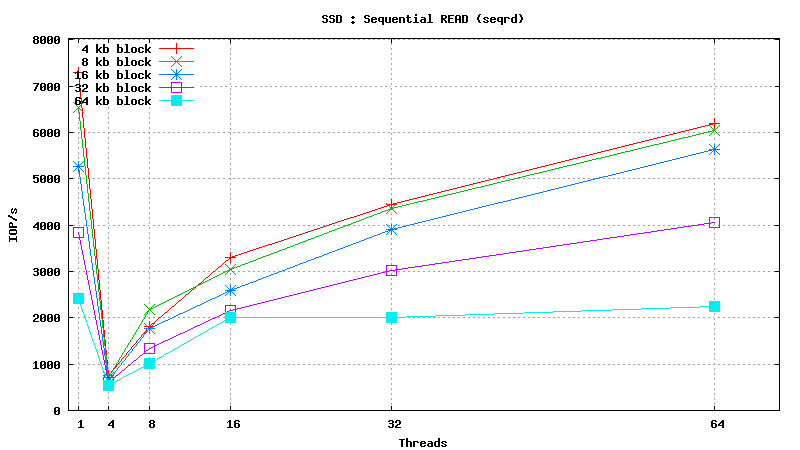
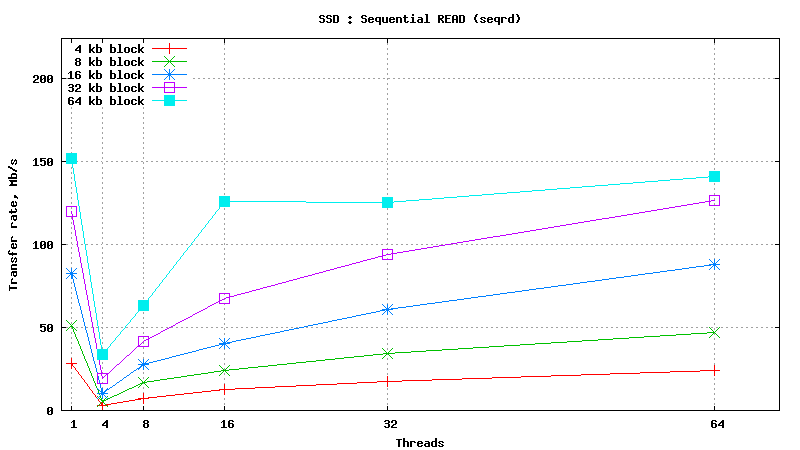
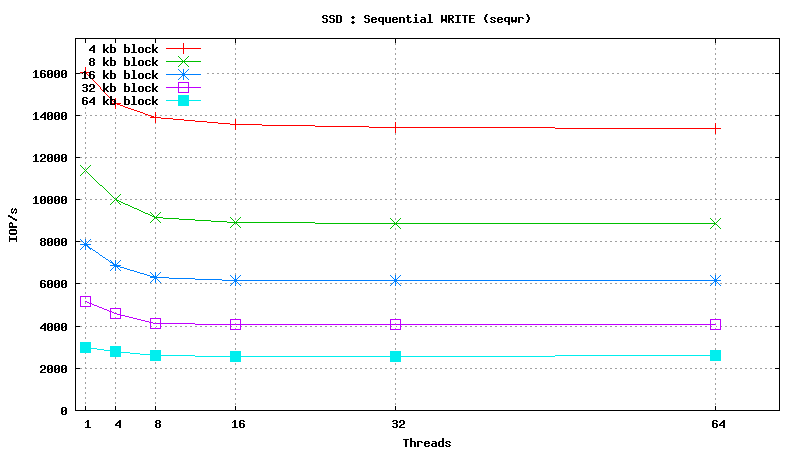
- Solid State Drive testing results taken with default CFQ scheduler and noatime mount option;
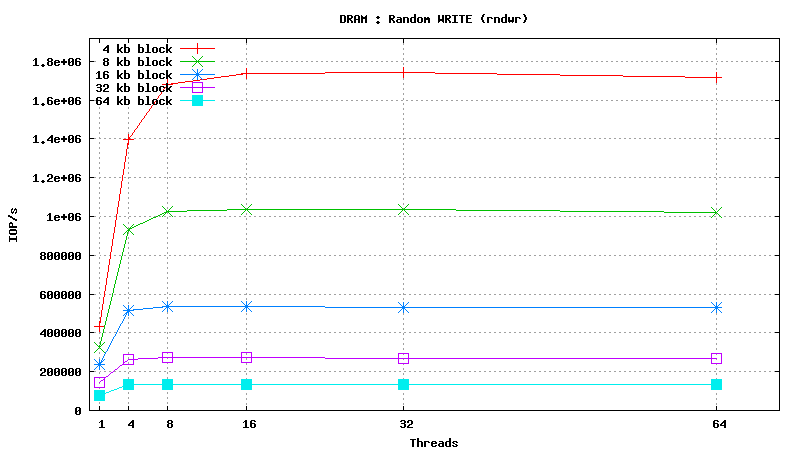
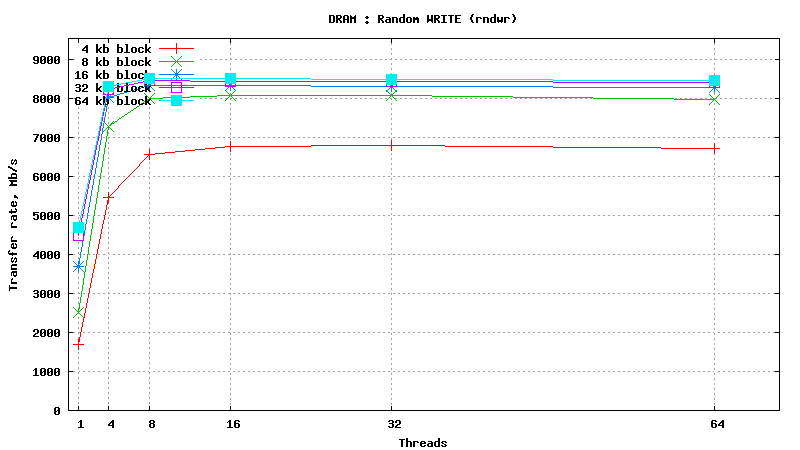
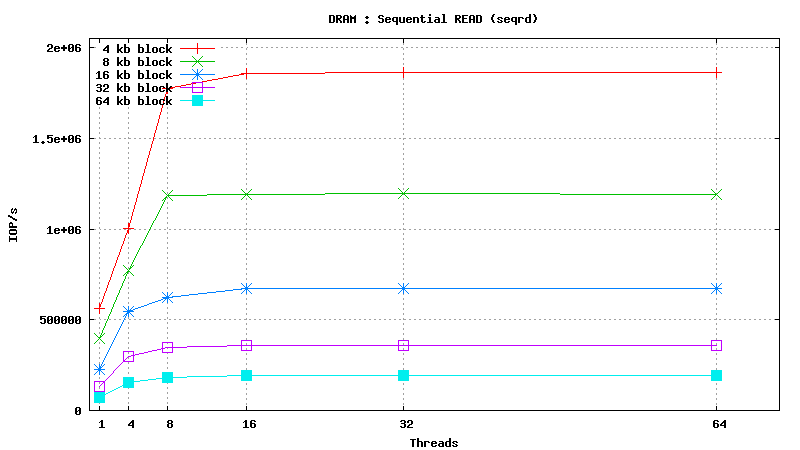
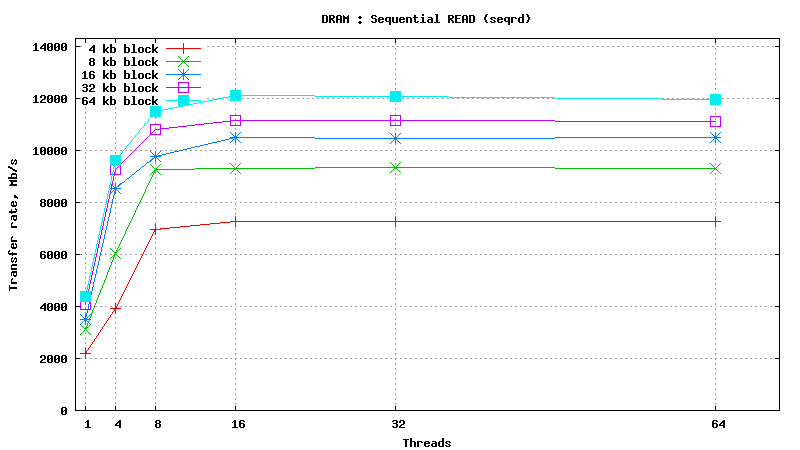
- Dynamic Random Access Memory testing results
Summary :
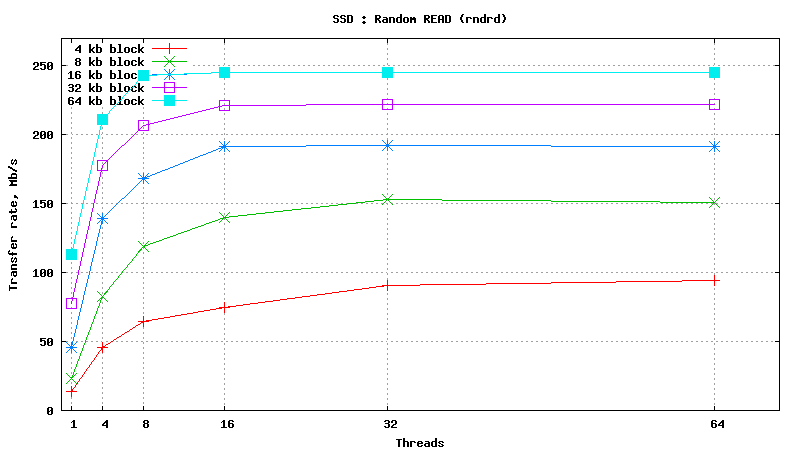
- DATABASE INDEX SEARCH or SPARSE DATA READ: SSD performs ~50 times better than SAS HDD in short random reads (64 threads, 4kb blocks, random read) : 24000 IOP/s vs 500 IOP/s
- SEQUENTIAL TABLE SCAN: SSD performs ~2 times better than SAS HDD in flat sequential reads (64 threads, 256kb blocks, sequential read) : 200 MB/s vs 90 MB/s
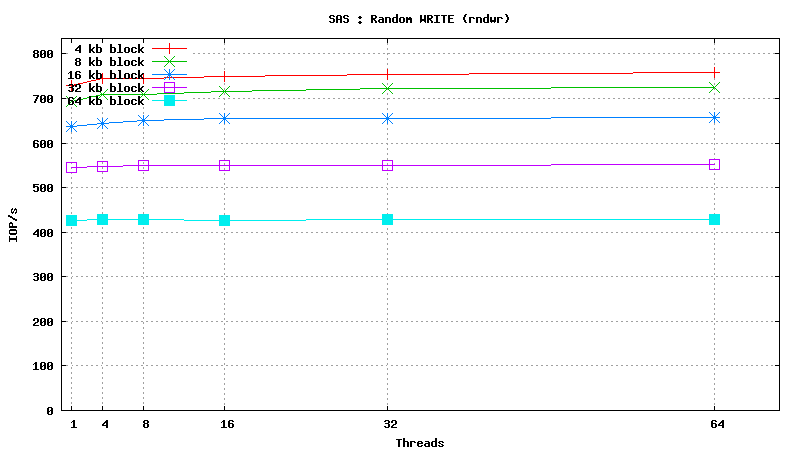
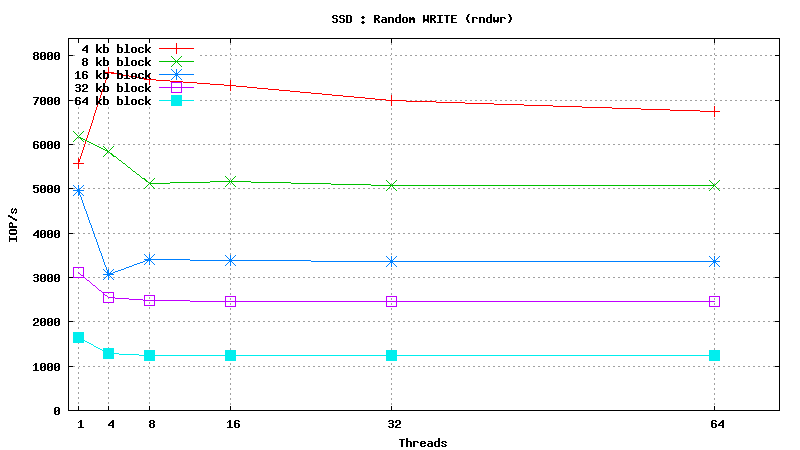
- DATABASE INSERT SPEED: SSD performs ~10 times better than SAS HDD in short random writes (64 threads, 4kb blocks, random write) : 6800 IOP/s vs 750 IOP/s
Simulated MySQL Load testing :
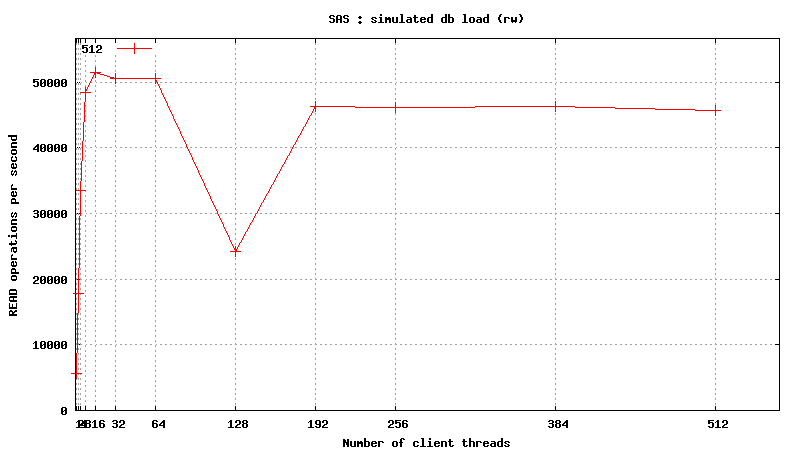
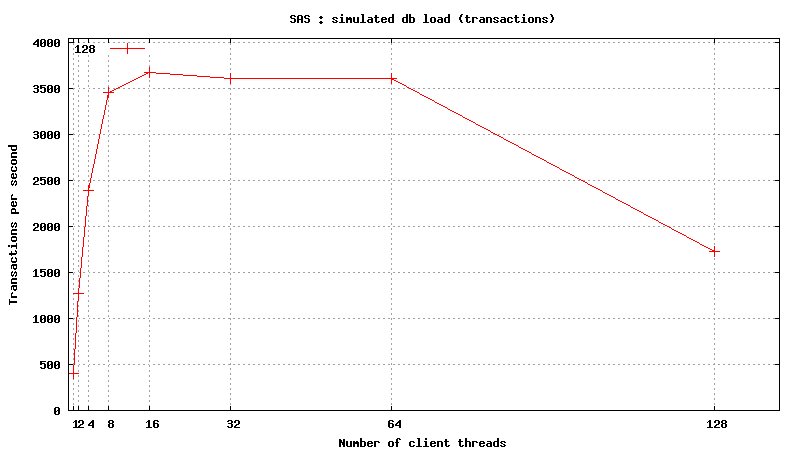
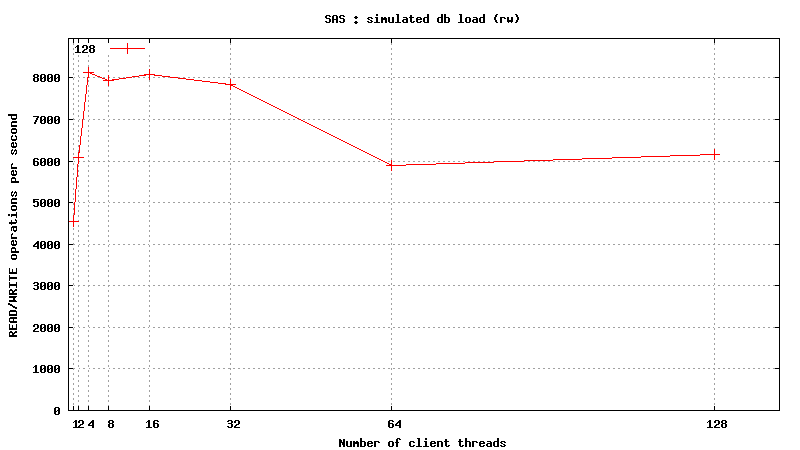
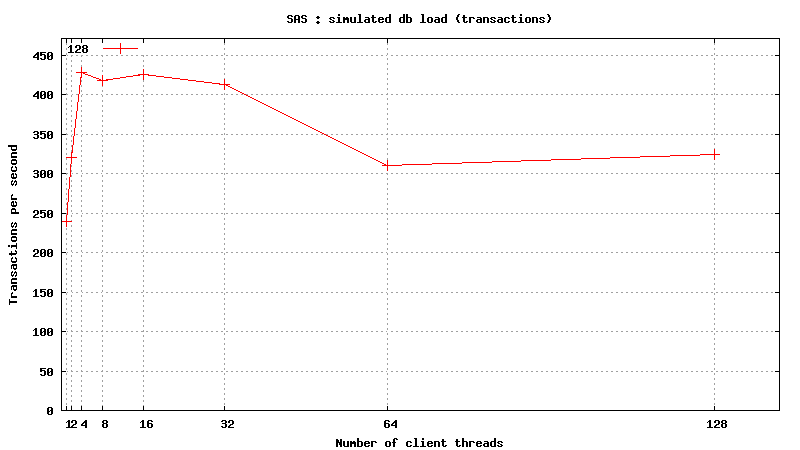
- Simulated DB Load : SAS
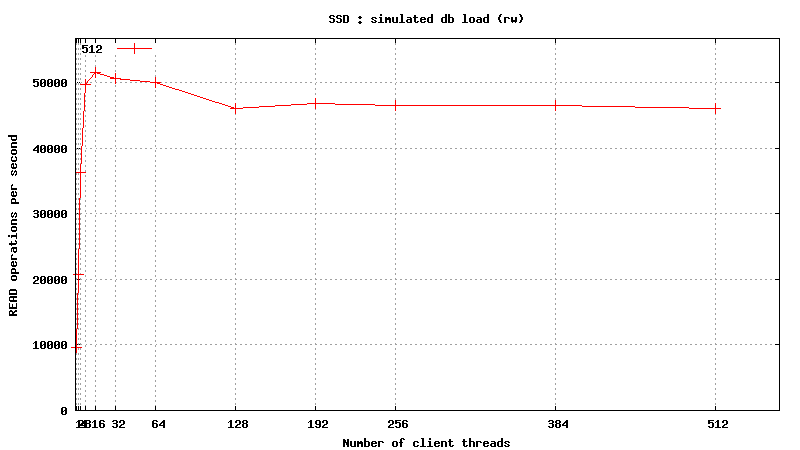
- Simulated DB Load : SSD
- Simulated DB Load : DRAM
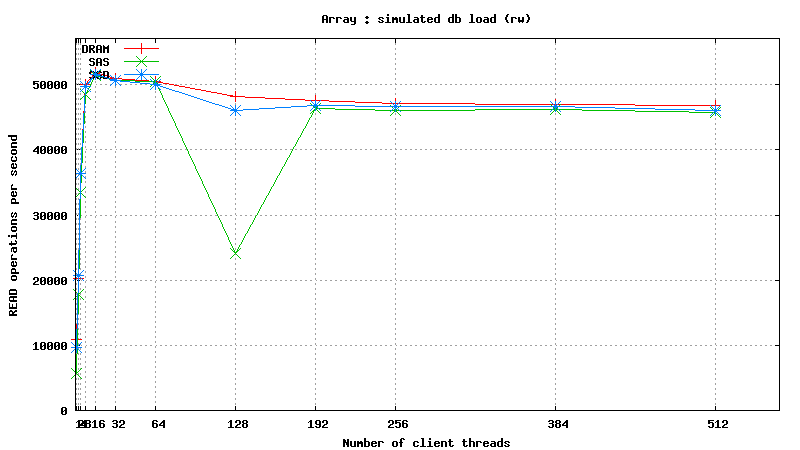
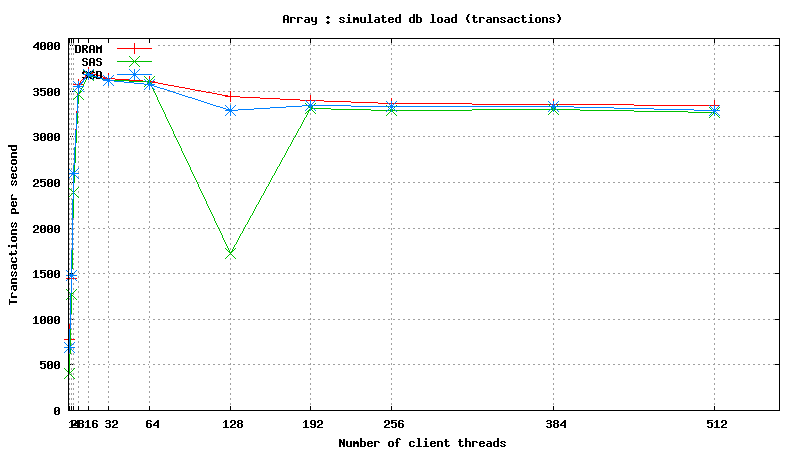
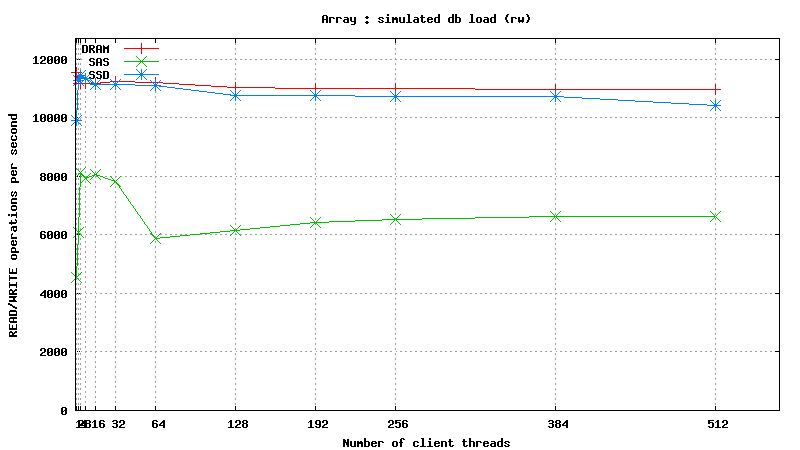
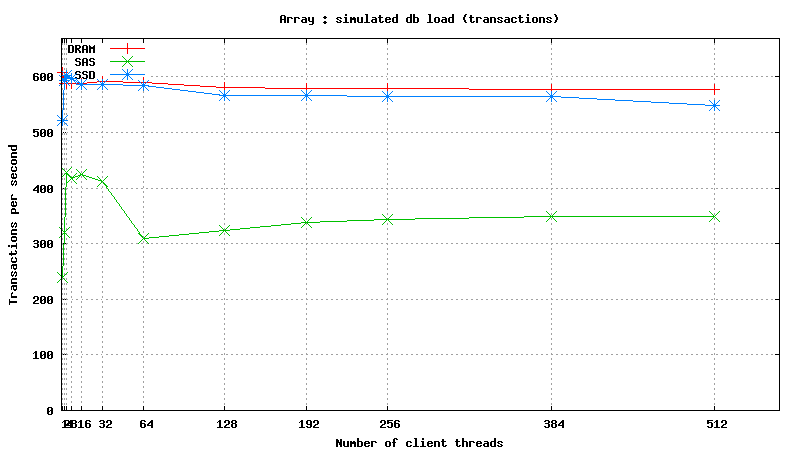
- Simulated DB Load : DRAM vs SSD vs SAS
Summary : quite surprising results were uncovered.
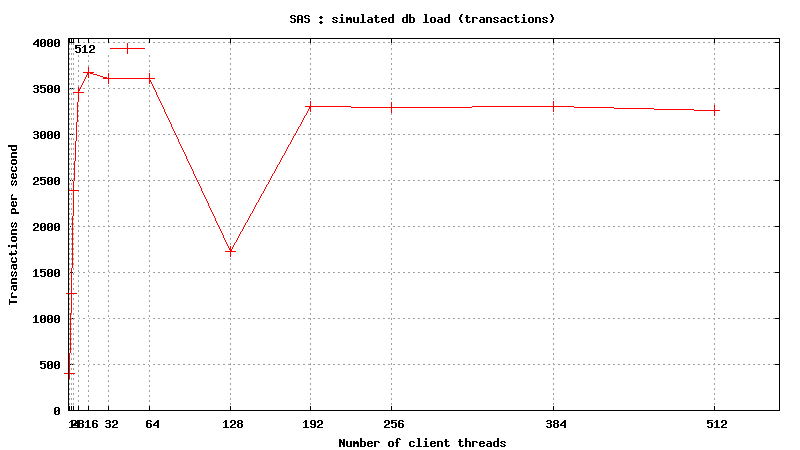
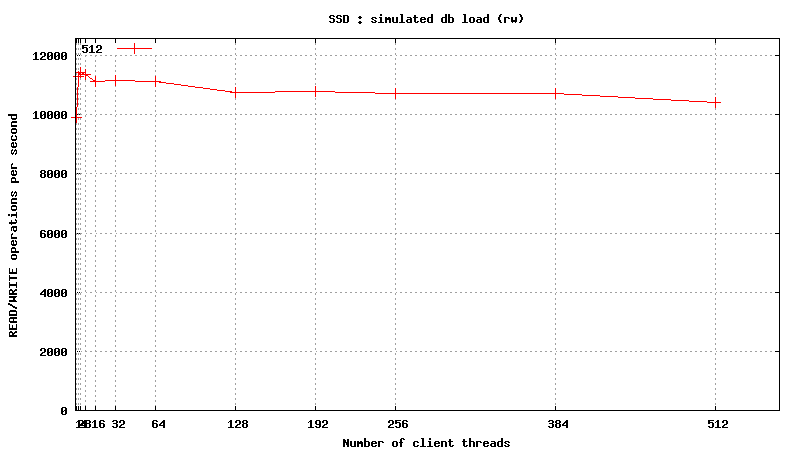
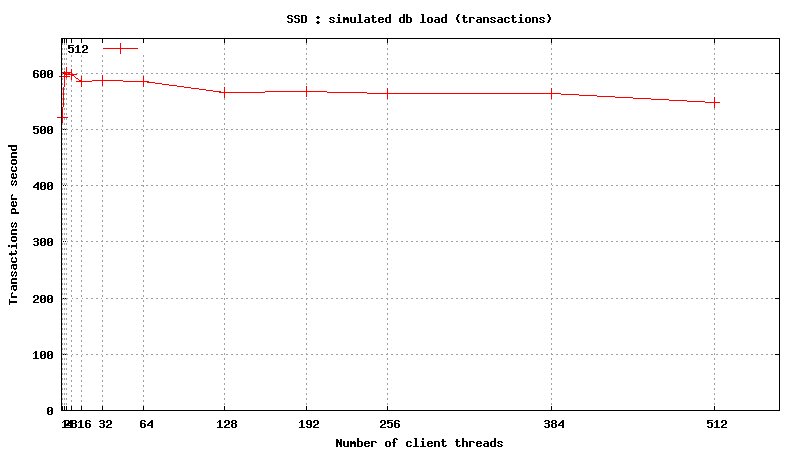
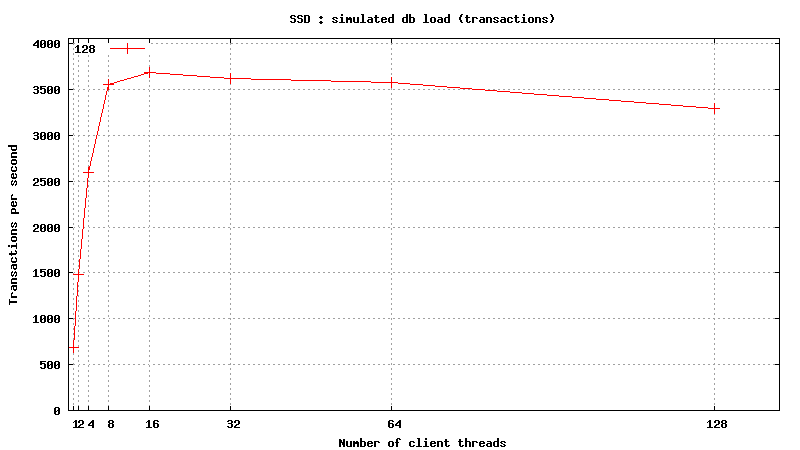
- READONLY Operations : *ALL* Drives show roughly identical performance! Does it mean that MySQL treats all drives as SAS by default (Query Optimizer), or synthetic test is not quite great for benchmarking? Real data testing to follow...
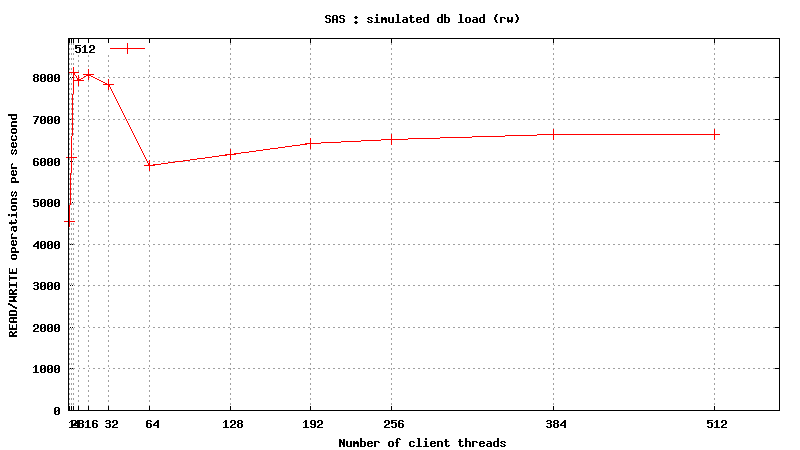
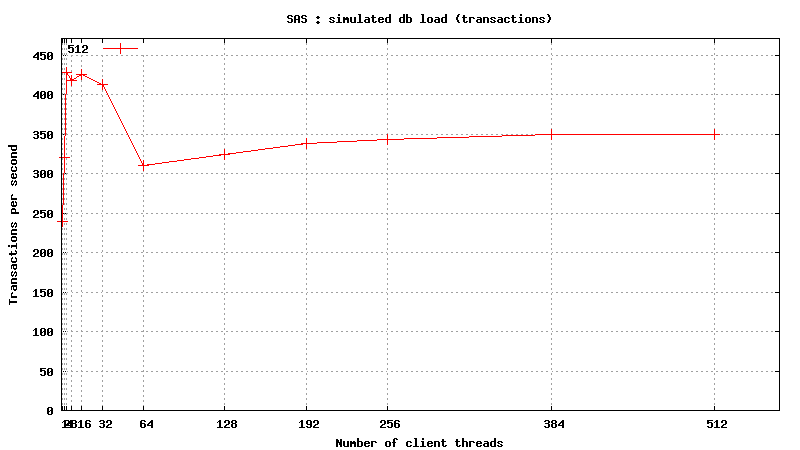
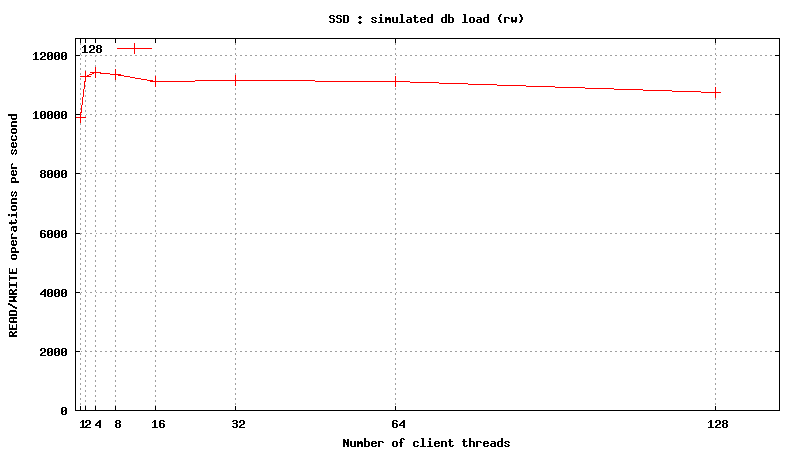
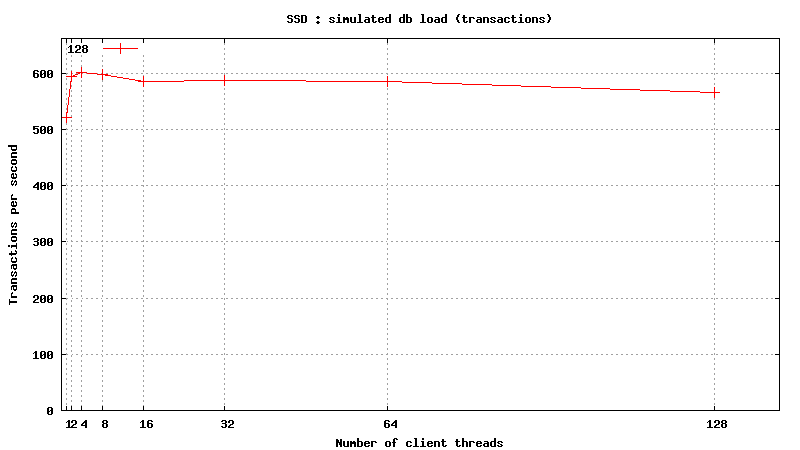
- Mixed READ/WRITE Operations: SSD and DRAM results are practically identical, and SAS is x2 slower than SSD/DRAM!
STAR Offline DB testing :
TBD
Summary :
CONCLUSIONS:
TBD
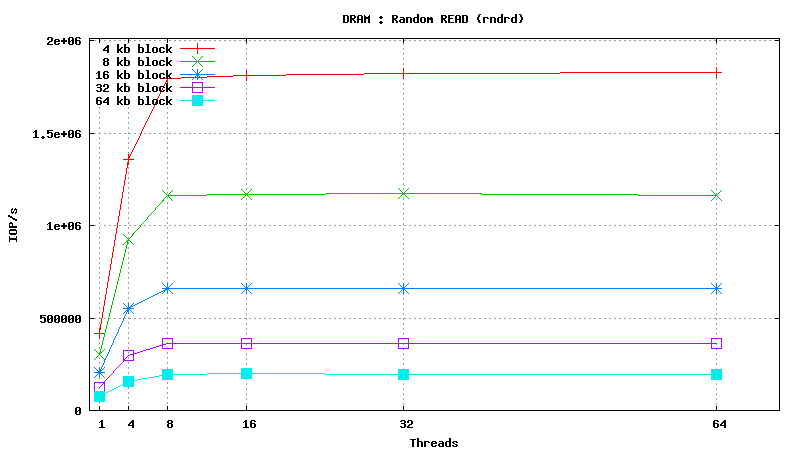
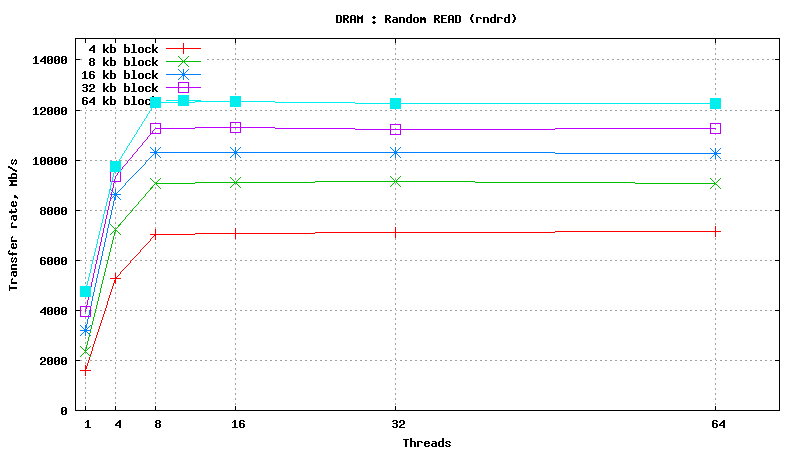
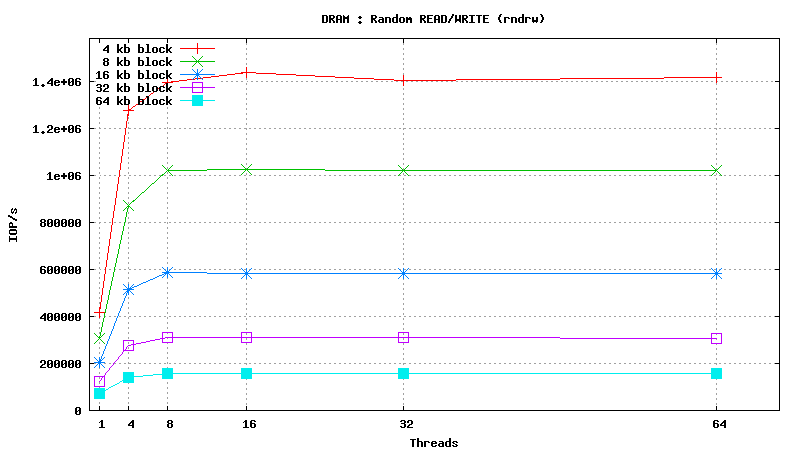
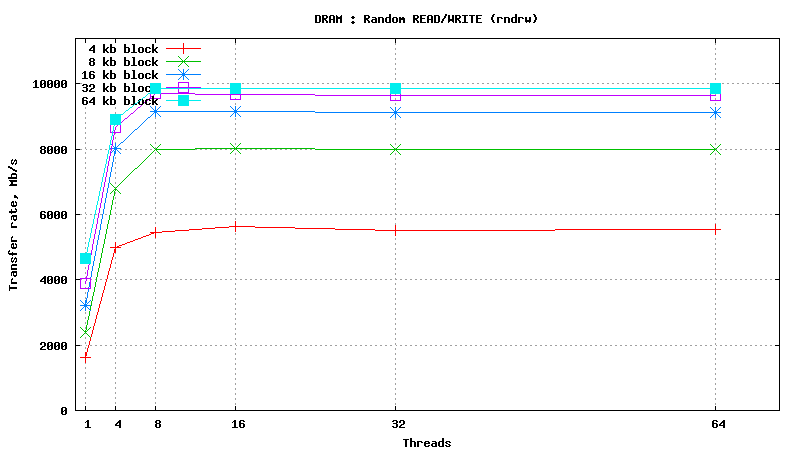
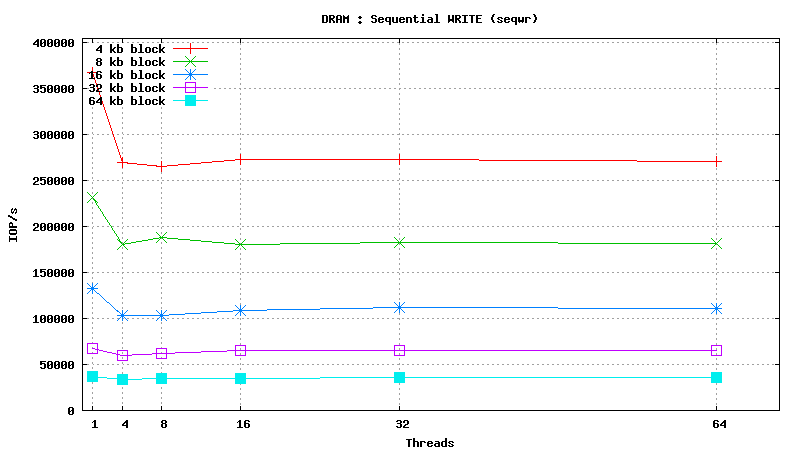
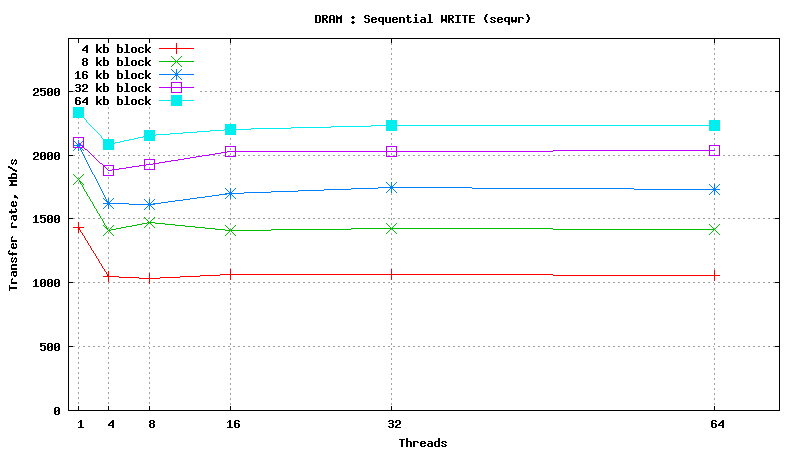
Dynamic Random Access Memory testing results
SysBench results for tmpfs using 6 GB of DRAM
[ SAMSUNG DDR3-1333 MHz (0.8 ns) DIMM, part number : M393B5673DZ1-CH9 ]
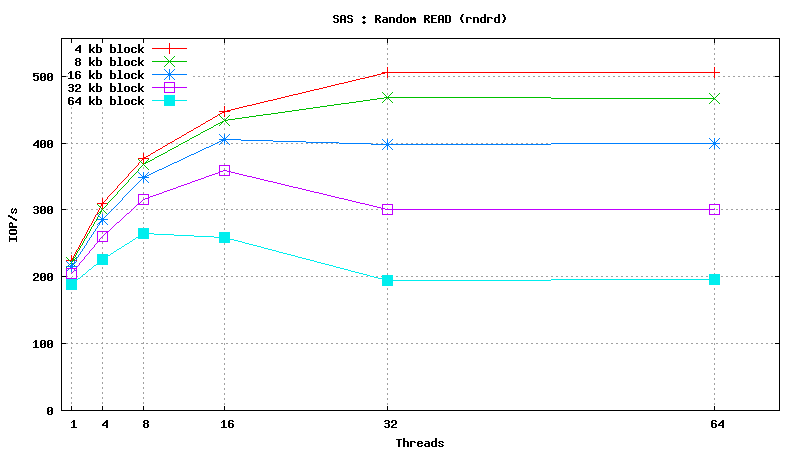
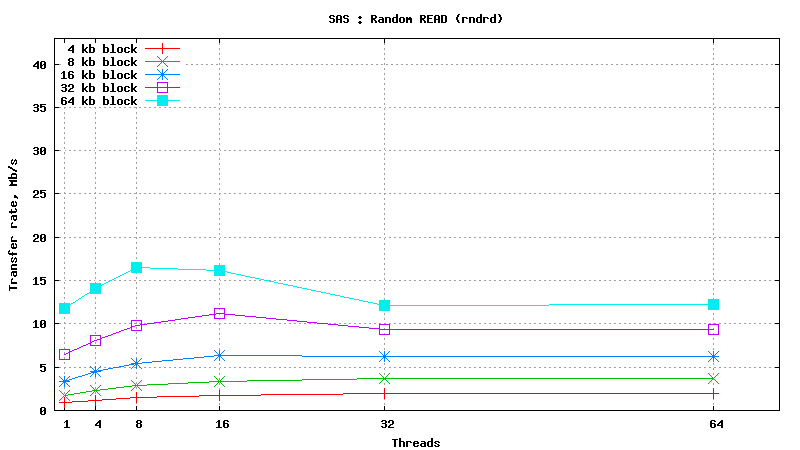
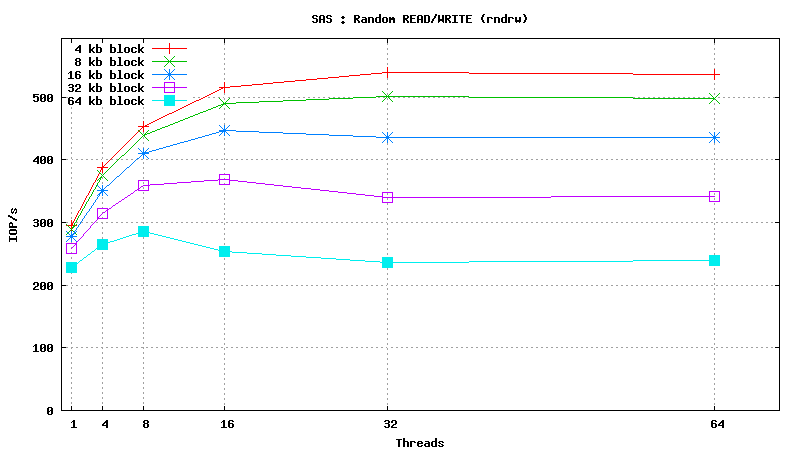
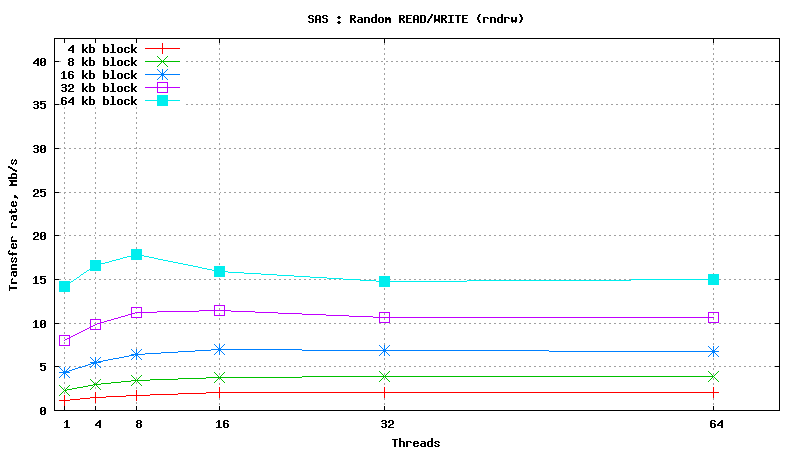
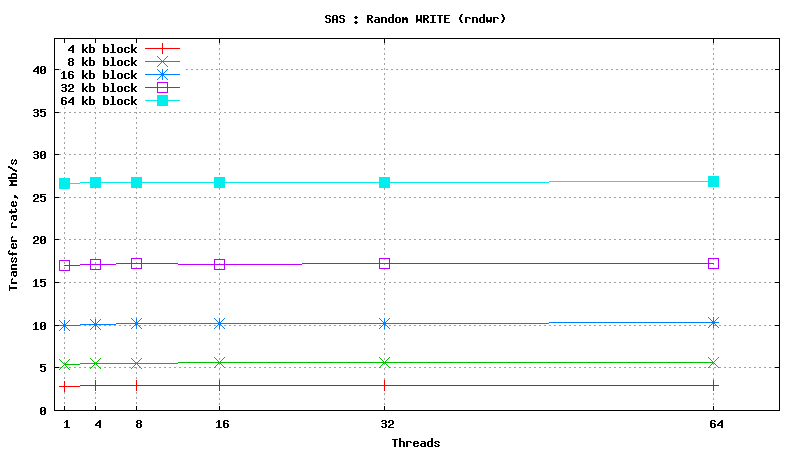
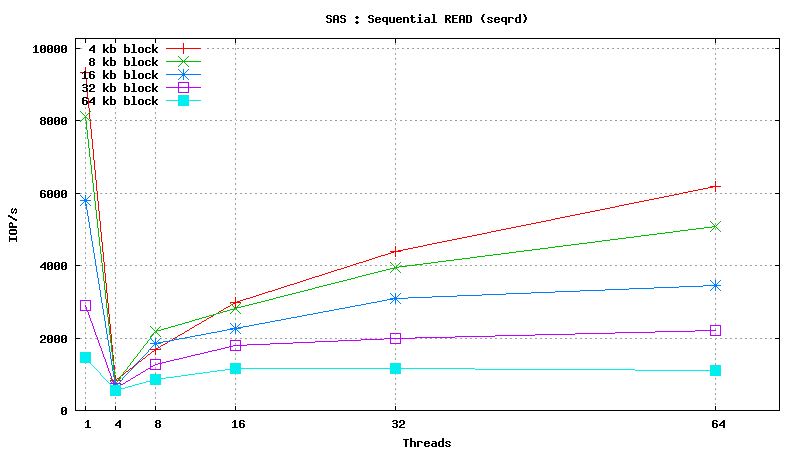
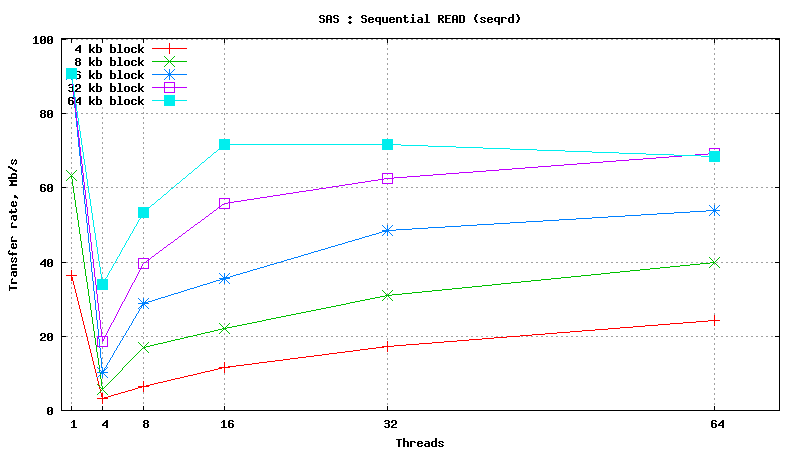
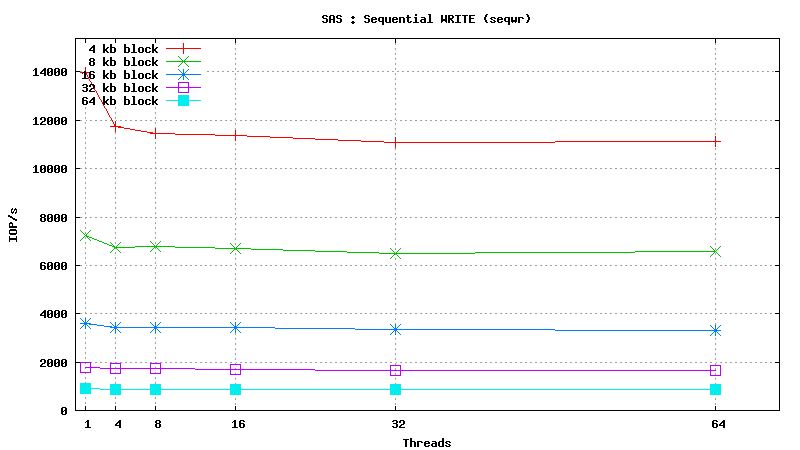
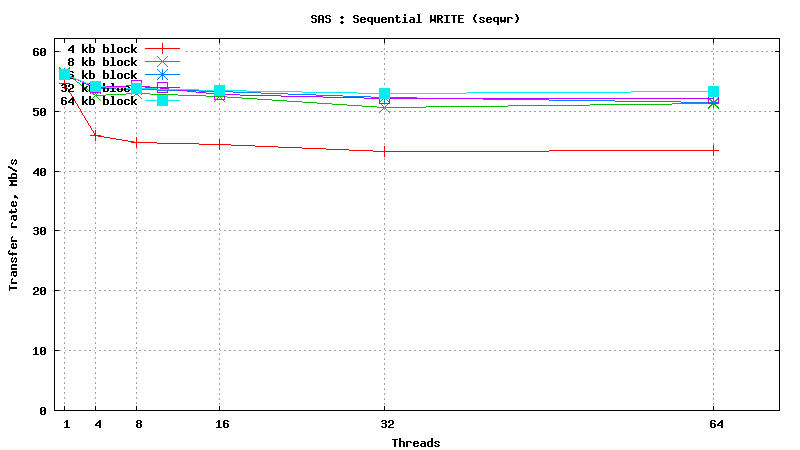
Serial Attached SCSI drive testing results
SysBench results for Fujitsu MBC2073RC
(size: 72 GB; 15,000 RPM; SAS; 16 MB buffer; cost is ~160$ per unit)
Simulated DB Load : DRAM
Simulated DB Load Testing Results : DRAM
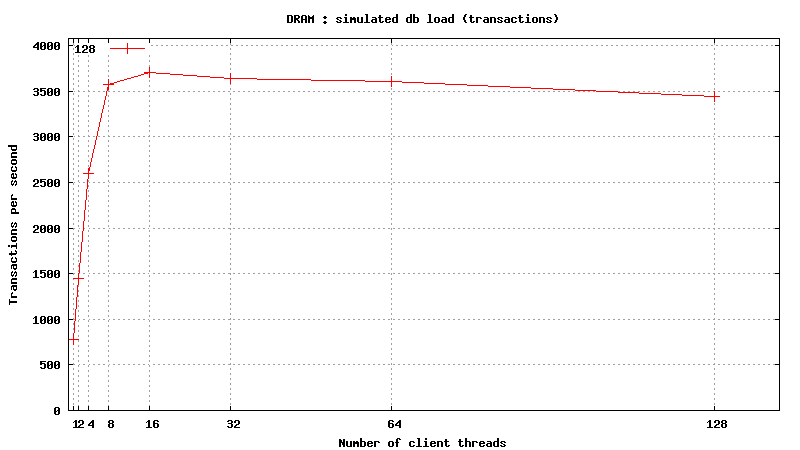
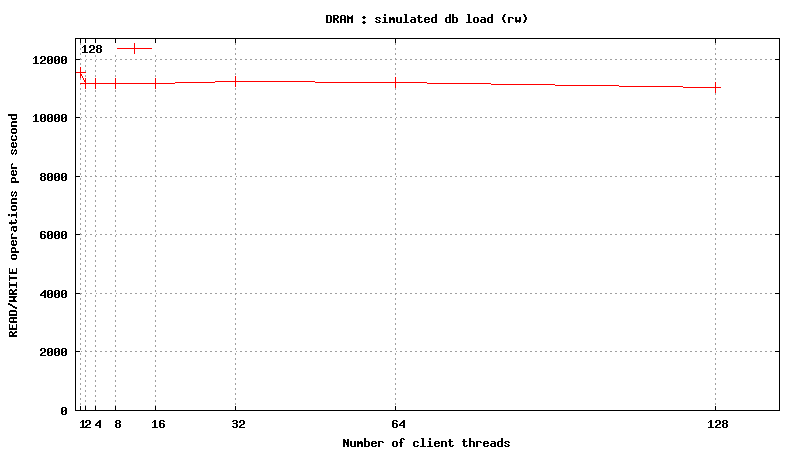
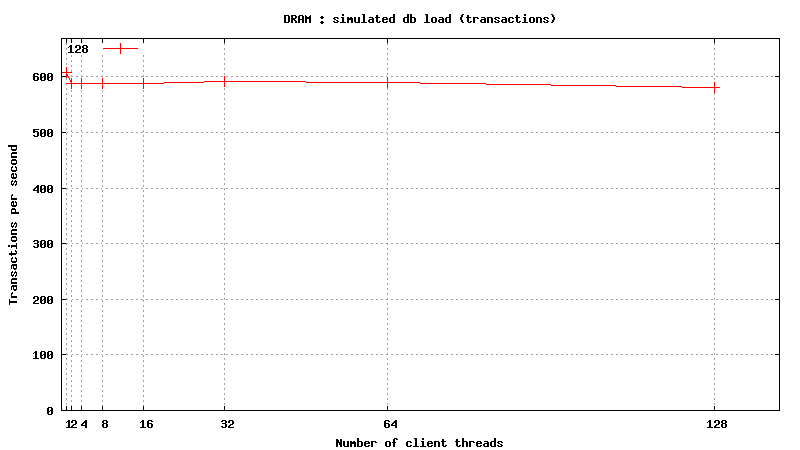
SysBench parameters: table with 20M rows, readonly. No RAM limit, /dev/shm was used as MySQL data files location.
READ only operations

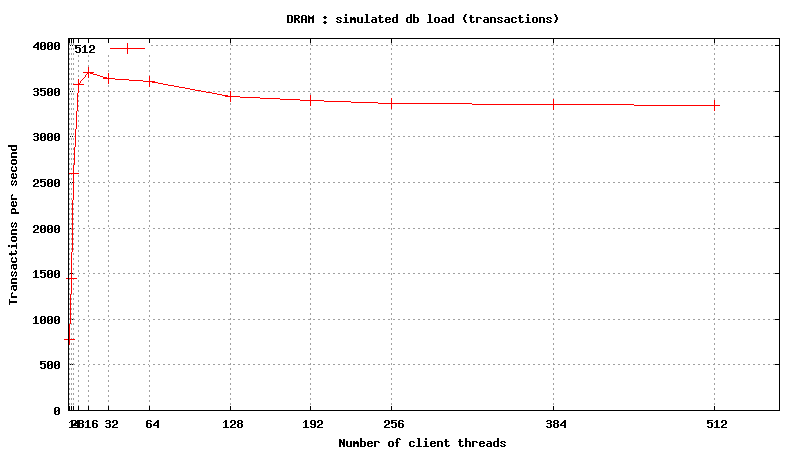
READ/WRITE operations
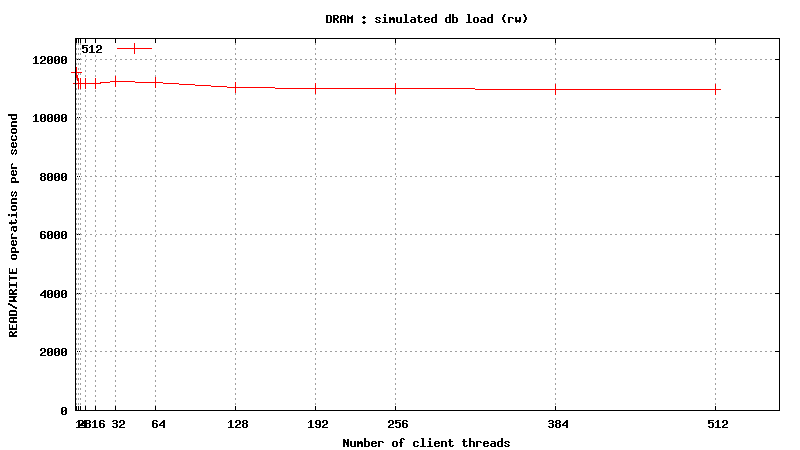
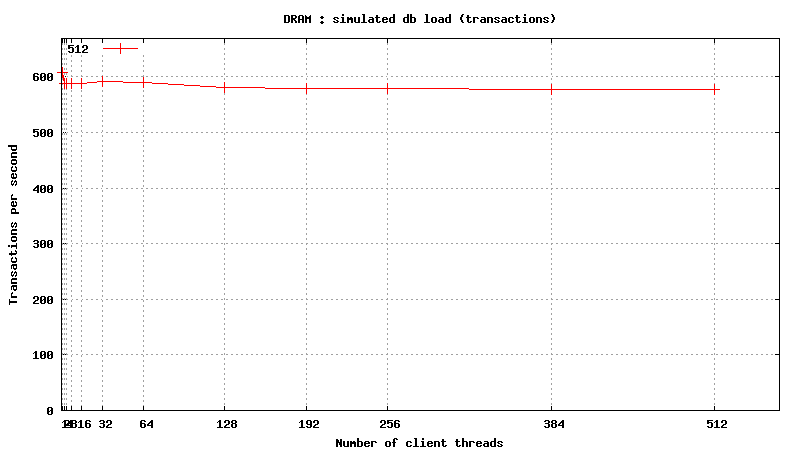
Same plots, focus on 1-128 threads
READ only operations
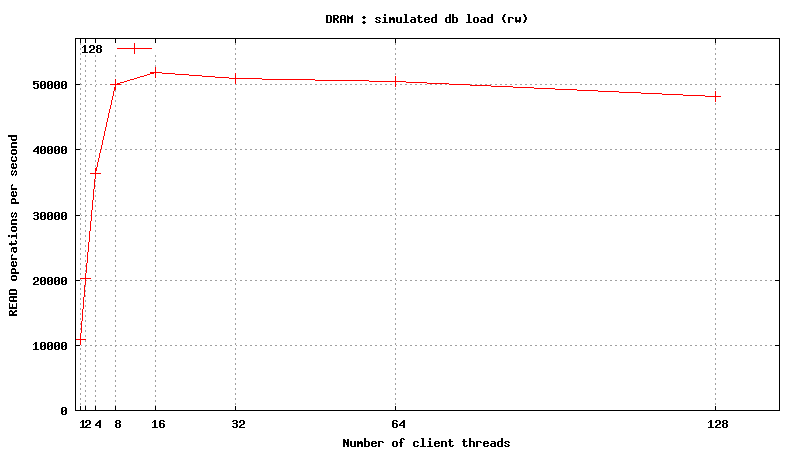
READ/WRITE operations
Simulated DB Load : DRAM vs SSD vs SAS
Simulated DB Load : DRAM vs SSD vs SAS
READ only operations
READ/WRITE operations
Simulated DB Load : SAS
Simulated DB Load : Serial Attached SCSI
SysBench parameters: table with 20M rows, readonly. Allowed RAM limit: 2Gb to reduce fs caching effects.
READ only operations
 <h1 class="rtecenter">Simulated DB Load : Solid State Disk</h1>
READ/WRITE operations
Same plots, focus on 1-128 threads
READ only operations
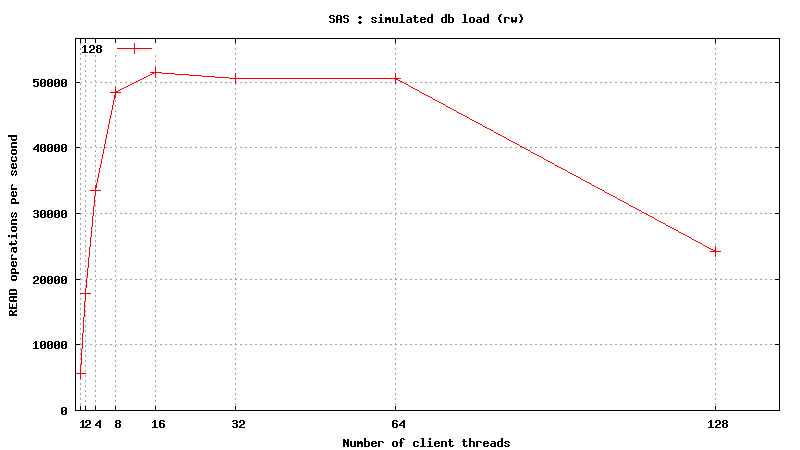
READ/WRITE operations
Simulated DB Load : SSD
Simulated DB Load : Solid State Disk
SysBench parameters: table with 20M rows, readonly. Allowed RAM limit: 2Gb to reduce fs caching effects.
READ only operations
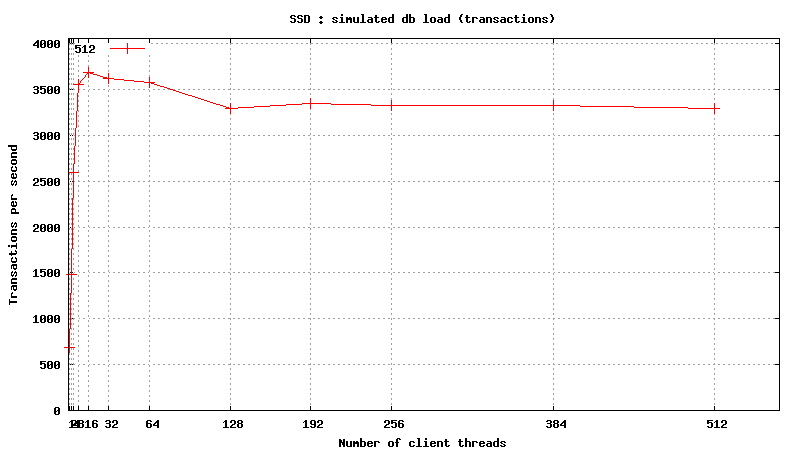
READ/WRITE operations
Same plots, focus on 1-128 threads
READ only operations
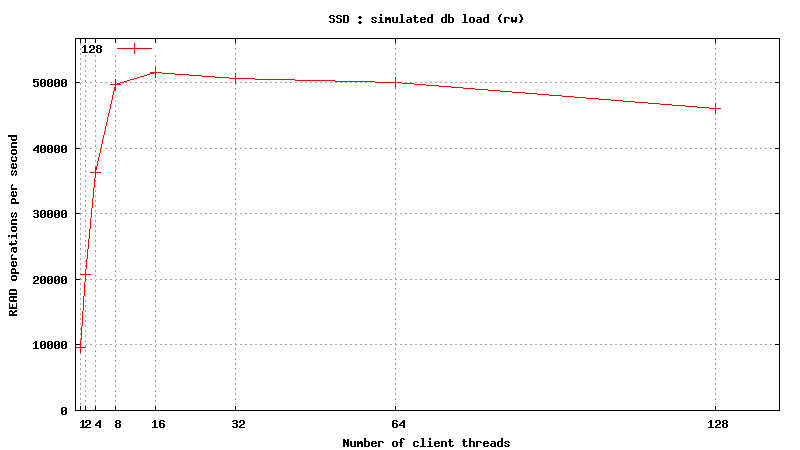
READ/WRITE operations

.png)