06 Jun
June 2010 posts
2010.06.15 First look at data vs. TuneA/Perugia0 filtered MC with latest EEMC geometry
Data samples and colour coding
- black: pp2006 data
- open green: MC-QCD-TuneA, partonic pt 4-35
- solid green: MC-QCD-Perugia0, partonic pt 4-35
(these not shown yet -> still generating data points) - open red MC-prompt-photon-TuneA, partonic pt 3-35
- solid red MC-prompt-photon-Perugia0, partonic pt 3-35
Event selection
- di-jets from the cone jet-finder algorithm
- photon and jet are opposite in phi:
cos (phi_gamma-phi_jet) < -0.8 - pt away side jet > 5GeV
- detector eta of the away side jet: |eta_jet_det| < 0.8
- data: L2e-gamma triggered events
- No trigger emulation in Monte-Carlo yet
- MC scaled to 3.164^pb based on Pythia luminosity (no fudge factors)
Figure 1: Reconstructed photon candidate pt, pt_gamma (no cut on pt_gamma, pt_jet > 5GeV)
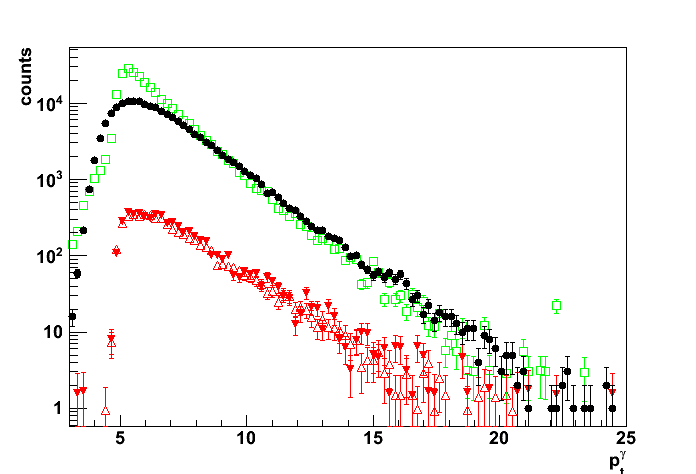
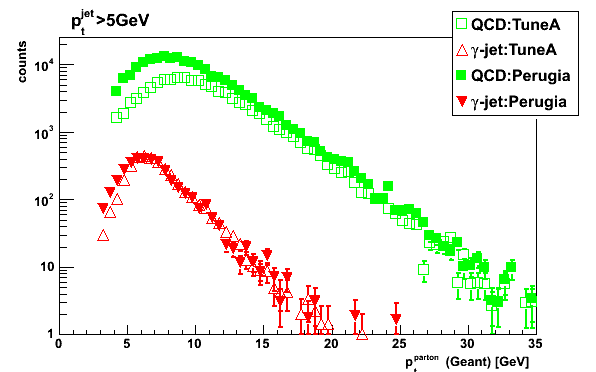
Figure 2: Partonic pt distribution (pt_gamma>7GeV, pt_jet > 5GeV)
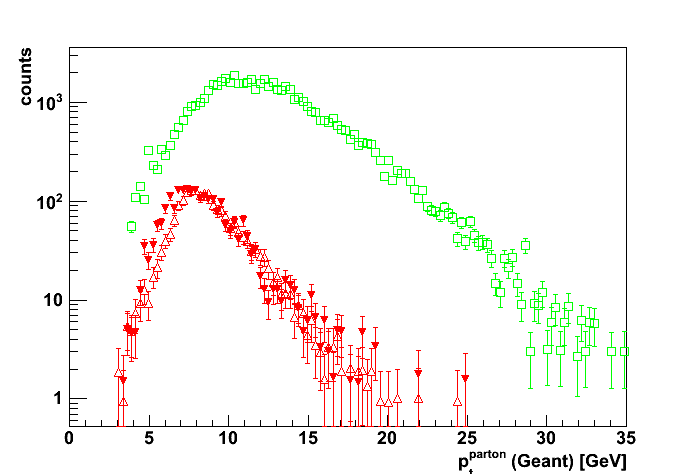
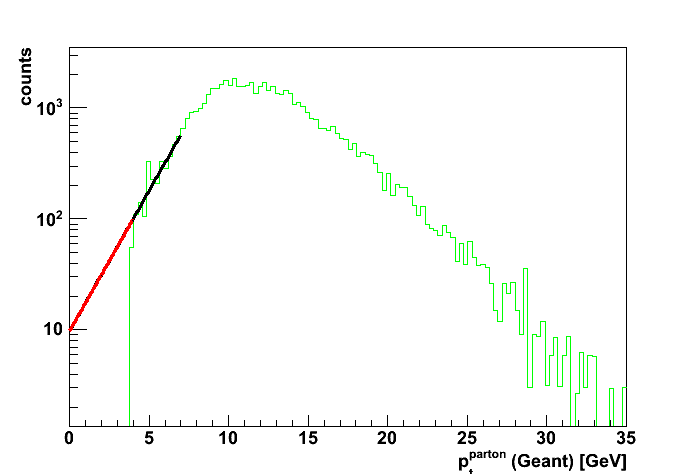
Figure 3: Estimate of the contribution from low partonic pt,
only QCD-TuneA MC are shown (pt_gamma>7GeV, pt_jet > 5GeV)
Black line: Exponential fit to partonic pt distribution in 4-7GeV range
(pt_gamma>7GeV cut for the photon candidate)
Red line: Exponential fit extrapolated to the partonic pt range below 4GeV.
Ratio of the area under the red line (integral pt=0-4geV)
to the area under the green line (integral pt=4-35GeV) is 0.0028.
Comments
- (based on Fig. 3)
I would propose we drop both of the lowest parton pt bins,
i.e. pt=2-3 and pt=3-4 (Inherited error for pt_gamma>7GeV < 0.3%)
and instead use our CPU time to produce more
statistics in the 4-35 partonic pt range. - (based on Fig. 2)
There is a small difference between CDF-Tune-A and
Perugia0 tunes partonic pt distributions
even for the prompt photon Monte-Carlo. - Comparison with Perugia0 QCD MC is coming.
Hopefully after that we will be able to decide what
Pythia tune is better match the L2e-gamma data.
2010.06.17 Pythia TuneA/Perugia0 filtered MC vs. pp2006 data
Data samples and colour coding
- black circles: pp2006 data
- open green: MC-QCD-TuneA, partonic pt 4-35
- solid green: MC-QCD-Perugia0, partonic pt 4-35
- open red MC-prompt-photon-TuneA, partonic pt 3-35
- solid red MC-prompt-photon-Perugia0, partonic pt 3-35
Event selection
- di-jets from the cone jet-finder algorithm
- photon and jet are opposite in phi:
cos (phi_gamma-phi_jet) < -0.8 - pt away side jet > 5GeV
- detector eta of the away side jet: |eta_jet_det| < 0.8
- data: L2e-gamma triggered events
- No trigger emulation in Monte-Carlo yet
- MC scaled to 3.164^pb based on Pythia luminosity (no fudge factors)
Plots before cuts on photon candidate pt
Figure 1: Reconstructed photon candidate pt, pt_gamma (no cut on pt_gamma, pt_jet > 5GeV)
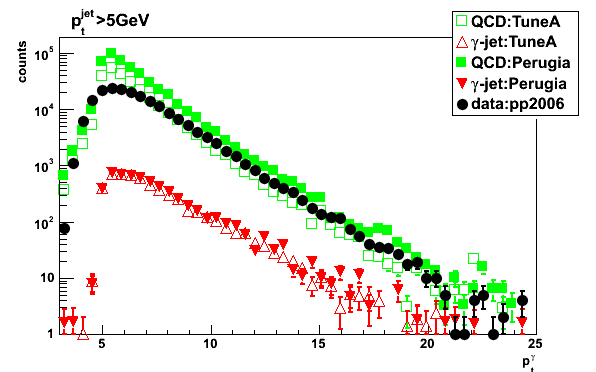
Figure 2: Partonic pt distribution (no cut on pt_gamma, pt_jet > 5GeV)

Plots with pt_gamma>7GeV cut
Figure 3: Partonic pt distribution (pt_gamma>7GeV, pt_jet > 5GeV)
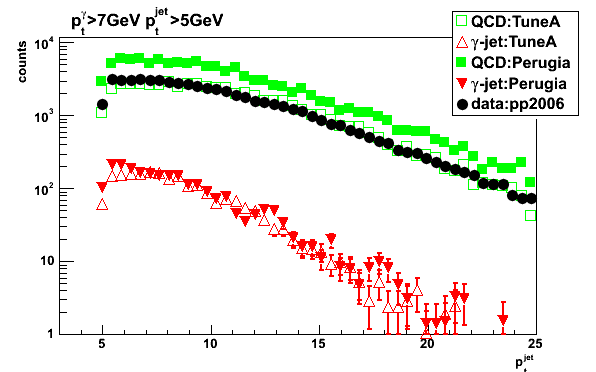
Figure 4: Away side jet pt (pt_gamma>7GeV, pt_jet > 5GeV)
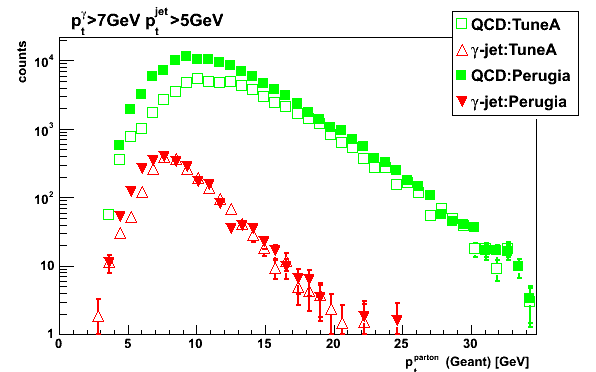
Figure 5: Reconstructed z vertex (pt_gamma>7GeV, pt_jet > 5GeV)

Figure 6: Partonic pt distribution for Pythia CDF-Tune-A QCD simulations (pt_gamma>7GeV, pt_jet > 5GeV)
Estimate of the contribution from low partonic pt:
Black line: Exponential fit to partonic pt distribution in 4-7GeV range
Red line: Exponential fit extrapolated to the partonic pt range below 4GeV.
Ratio of the area under the red line (integral over pt=0-4GeV)
to the area under the green line (integral over pt=4-35GeV) is 0.0028 (<0.3%)
Comments
-
Simulations with Perugia0 tune has a higher yield than that from CDF-Tune-A simulations
-
Shapes vs. partonic pt are different for Perugia0 and CDF-TuneA simulations
-
Shapes vs. reconstructed variables are similar for Perugia0 and CDF-TuneA simulations
-
(based on Fig. 6) I would propose we drop both of the lowest parton pt bins,
i.e. pt=2-3 and pt=3-4 (Inherited error for pt_gamma>7GeV < 0.3%)
and instead use CPU time to produce more statistics in the 4-35 partonic pt range. -
More discussion at phana hyper news:
http://www.star.bnl.gov/HyperNews-star/protected/get/ phana/496.html
Additional figures
Figure 7a: Photon candidate yield vs. rapidity (pt_gamma>7GeV, pt_jet > 5GeV)
Left: pt_gamma>7GeV; right: zoom into eta < 1 region
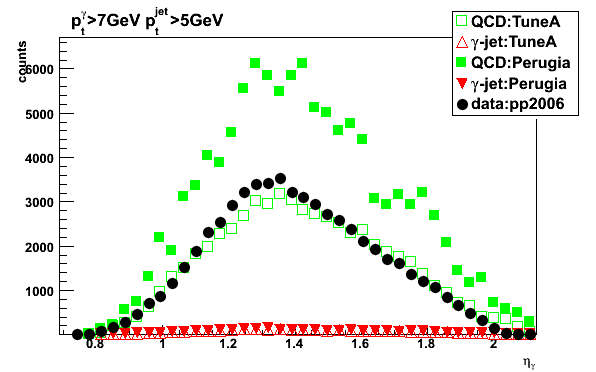
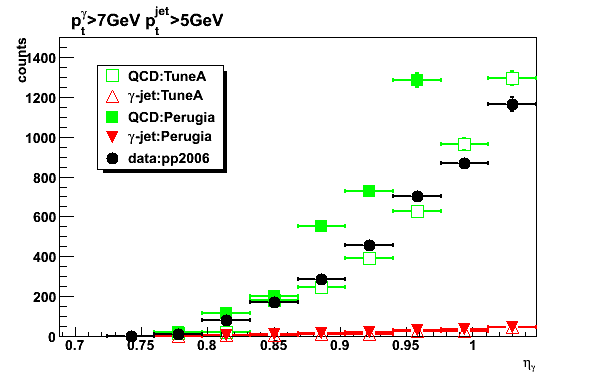
Figure 7b: yield vs. jet1 momentum (pt_gamma>7GeV, pt_jet > 5GeV)
Figure 7c: eta yield without pt_gamma cut
Yields ratio for eta <0.95 to the total yield is ~ 1.7% (1004/58766 = 0.0171)
Figure 8: Photon candidate yield vs. rapidity (pt_gamma>7GeV, pt_jet > 5GeV)

Note: trigger condition is not applied in simulations yet
but at high pt the data to Pythia CDF-Tune-A ratio is about 1.28 (at 9GeV: 3200/2500),
what is consistent with an additional 25% scaling factor
used for CIPANP 2009 presentation (see slide 6)
2010.06.18 L2e-gamma trigger effect: Py-CDF-Tune-A, Py-Perugia0, and pp2006 data comparison
Related posts
- Pythia and BFC filter QA vs. gamma candidate pt and eta
- L2e-gamma trigger effect with old Monte-Carlo (before EEMC geometry fix)
Data samples and colour coding
- black circles: pp2006 data
- open green: MC-QCD-TuneA, partonic pt 4-35
- solid green: MC-QCD-Perugia0, partonic pt 4-35
- open red MC-prompt-photon-TuneA, partonic pt 3-35
- solid red MC-prompt-photon-Perugia0, partonic pt 3-35
Event selection
- di-jets from the cone jet-finder algorithm
- photon and jet are opposite in phi:
cos (phi_gamma-phi_jet) < -0.8 - pt away side jet > 5GeV
- detector eta of the away side jet: |eta_jet_det| < 0.8
- data: L2e-gamma triggered events
- No trigger emulation in Monte-Carlo yet
- MC scaled to 3.164^pb based on Pythia luminosity (no fudge factors)
Figure 1: Reconstructed photon candidate pt, pt_gamma (no cut on pt_gamma, pt_jet > 5GeV)
Figure 2: Same as Fig. 1 with L2e-gamma condition simulated in Monte-Carlo
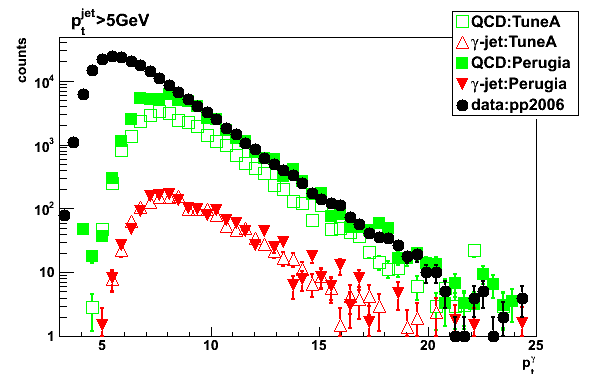
Figure 3: Same as Fig. 1, added distribution for photon pt from geant record (prompt photon MC only)

Figure 4: raw jet pt from jet trees: QCD pt=6-9
upper plot: mit0043 M. Betancourt simulations (MIT Simulation Productions)
bottom plot: new filtered MC


2010.06.28 Tests of L2e-gamma trigger emulation with single photon Monte-Carlo
Related links
- L2e-gamma trigger effect: Py-CDF-Tune-A, Py-Perugia0, and pp2006 data comparison
- http://www.star.bnl.gov/HyperNews-star/get/emc2/3531/1.html
- http://www.star.bnl.gov/HyperNews-star/protected/get/phana/499.html
Monte-Carlo configuration
- Single photon in the EEMC (flat in eta, pt, phi)
- Narrow vertex distribution with sigma=1cm
- 10 muons thrown in Barrel (|eta|<0.5) to reconstruct vertex
- 3 muons thrown in each BBC (|eta|~4) to fire the trigger
- Run 6 L2e-gamma-trigger id = 137641
- STAR geometry tag: y2006h
- Photon cuts:
1.1 < eta < 1.95
3 < pt < 15 GeV
0 < phi < 2pi
Trigger effect vs. thrown photon pt, eta, and energy
Figure 1:
Yields vs. thrown photon pt
left: Yields with (red) and without (black) L2e-gamma trigger condition
right: Yield ratio (with/without trigger)
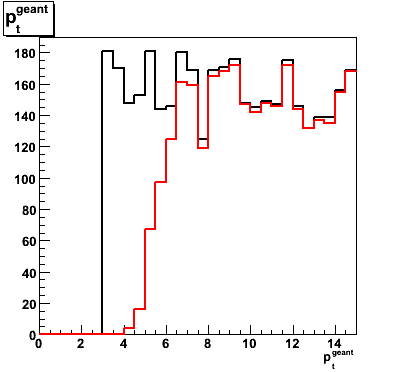
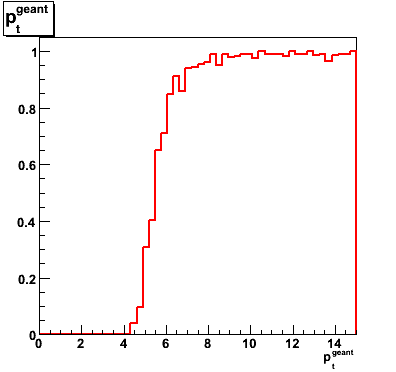
Figure 2: Same as Fig. 1 vs. thrown eta
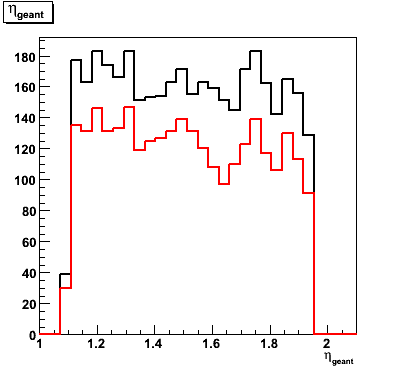
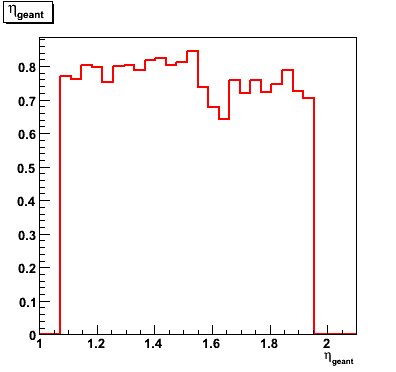
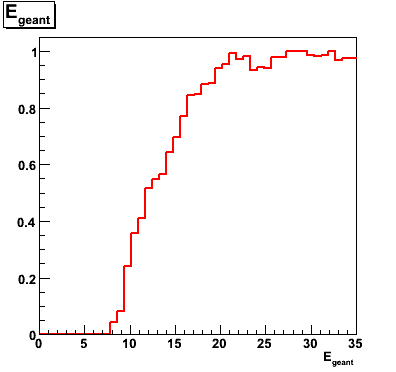
Figure 3: Same as Fig. 1 vs. thrown energy

Trigger effect vs. reconstructed energy in the EEMC (high tower, 2x1, 3x3, energy and total E_T)
Figure 4: Same as Fig. 1 vs. total reconstructed transverse energy
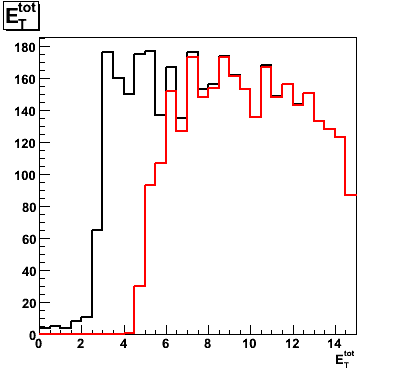
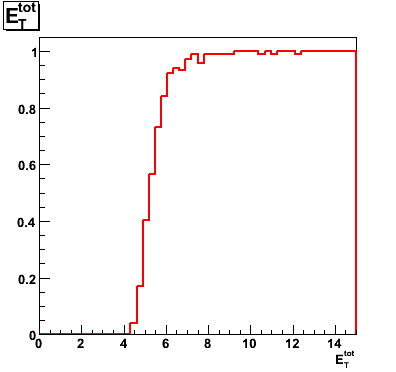
Figure 5: Same as Fig. 1 vs. reconstructed high tower energy
![]()
![]()
Figure 6: Same as Fig. 1 vs. reconstructed energy of the 2x1 tower cluster
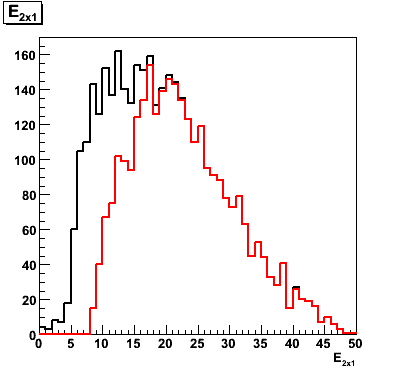
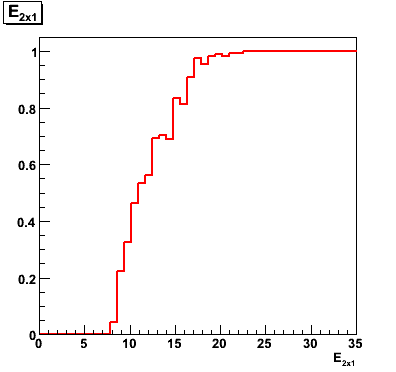
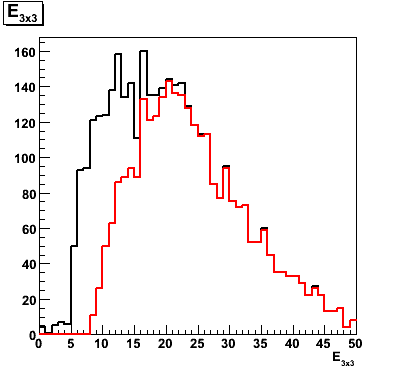
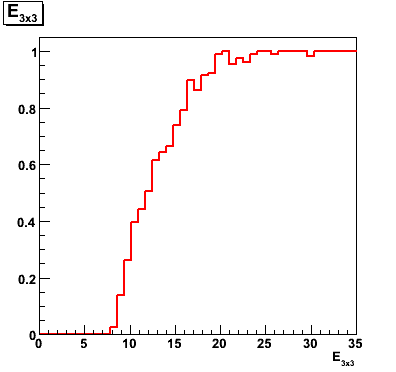
Figure 7: Same as Fig. 1 vs. reconstructed energy of the 3x3 tower cluster
2010.06.30 Py-tunes (GEANT+L2e-gamma trigger) vs. Run 6 data
Related posts
- Michael's Perugia 0, Pro-pT0, and CDF Tune A comparison
- Previous comparison without trigger condition in simulations
- Tests of L2e-gamma trigger emulation with single photon Monte-Carlo
Data samples and colour coding
- black circles: pp2006 data
- open green: MC-QCD-TuneA, partonic pt 4-35
- solid green: MC-QCD-Perugia0, partonic pt 4-35
- open red MC-prompt-photon-TuneA, partonic pt 3-35
- solid red MC-prompt-photon-Perugia0, partonic pt 3-35
Event selection
- di-jets from the cone jet-finder algorithm
- photon and jet are opposite in phi:
cos (phi_gamma-phi_jet) < -0.8 - pt away side jet > 5GeV
- detector eta of the away side jet: |eta_jet_det| < 0.8
- data : L2e-gamma triggered events
- Monte-Carlo: emulated L2e-gamma triggered condition
- MC scaled to 3.164^pb based on Pythia luminosity (no fudge factors)
Figure 1: Reconstructed photon candidate pt (no pt_gamma cut, pt_jet > 5GeV)
L2e-gamma condition simulated in Monte-Carlo
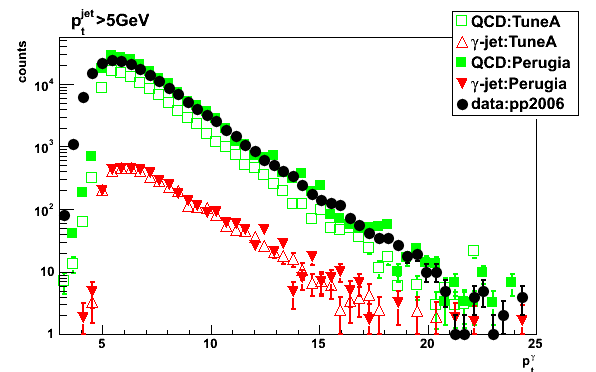
Figure 2: Yield ratios (no pt_gamma cut, pt_jet > 5GeV)
Black: data[pp2006] / QCD[Perigia0]
Green: QCD[Perigia0] / QCD[CDF-Tune-A]
Red: g-jet[Perigia0] / g-jet[CDF-Tune-A]
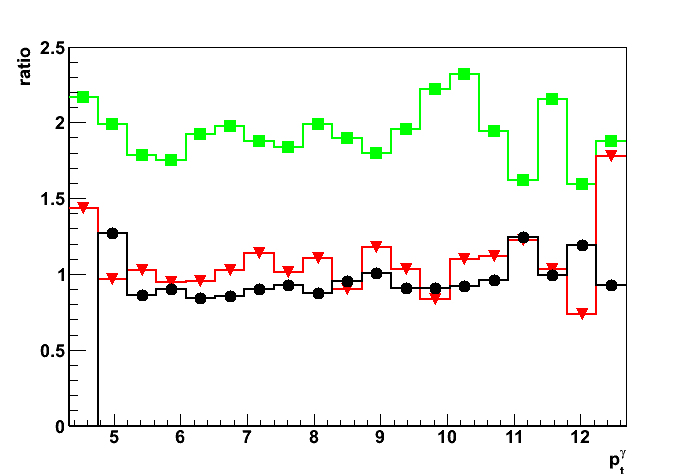
Figure 3: Vertex z distribution (pt_gamma>7GeV, pt_jet > 5GeV)
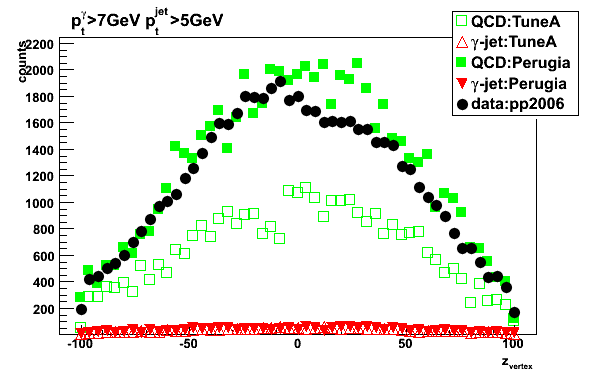
Figure 4: Simulation yield vs. partonic pt (no pt_gamma cut, pt_jet > 5GeV)