Pythia Simulations
Pythia Simulations
All partonic pT
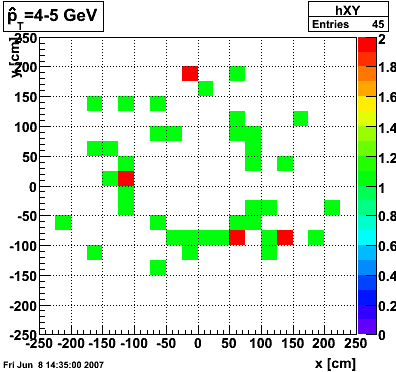
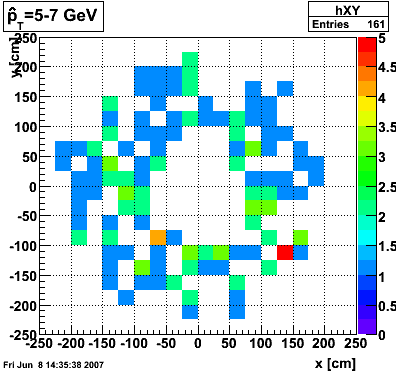
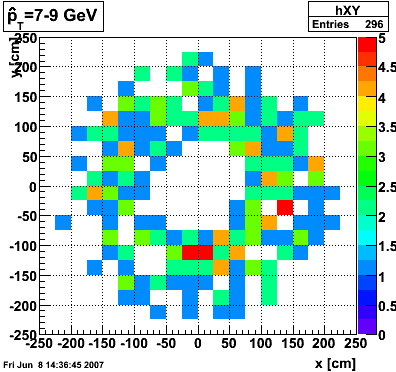
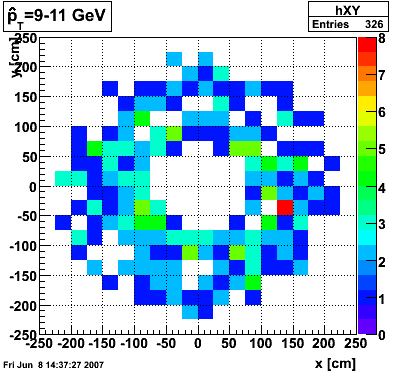
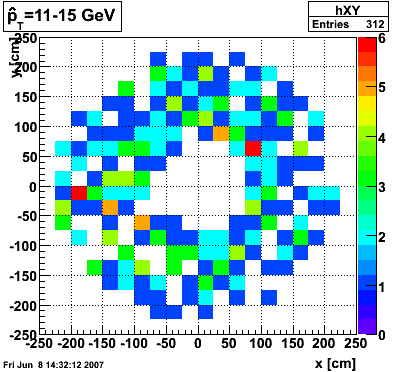
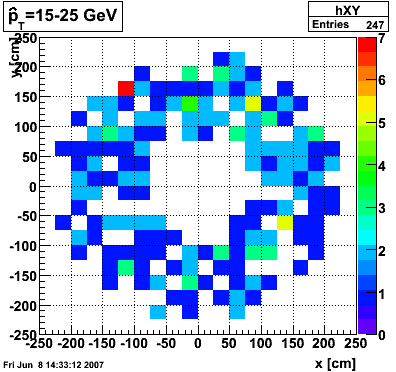
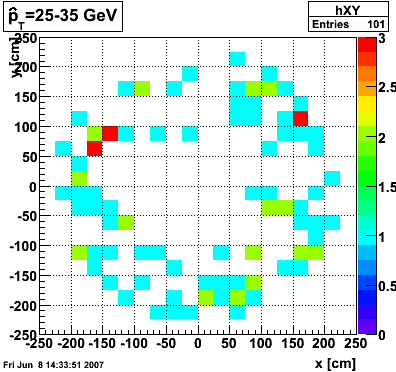
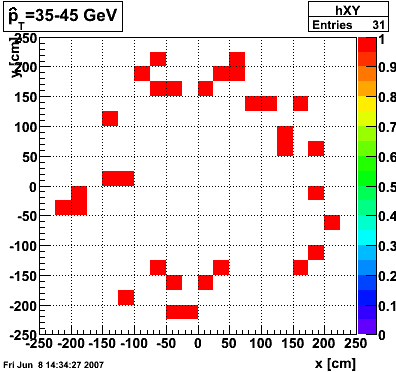
The plots below show the distribution of clusters in the endcap calorimeter for different partonic pT ranges. 2000 events were generated for each pT range. A cluster is made up of a central high tower above 3 GeV in pT and its surounding 8 neighbors. The total cluster pT must exceed 4.5 GeV.
 |
 |
 |
 |
 |
 |
 |
 |
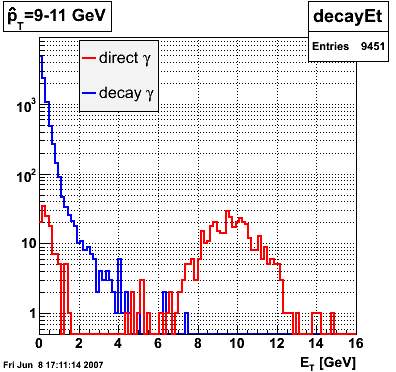
pT=9-11 GeV
Below is the pT of direct and decay photons from the Pythia record. Note how the two subsets are well separated at a given partonic pT. Any contamination to the direct photon signal would have to come from higher partonic pT.
 |
 |
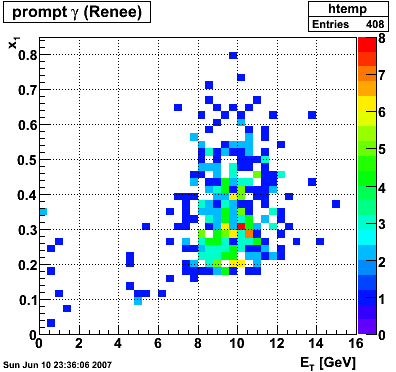
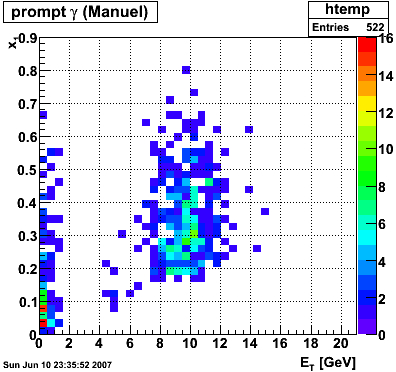
Differences between Renee's and Manuel's Pythia records?
 |
 |
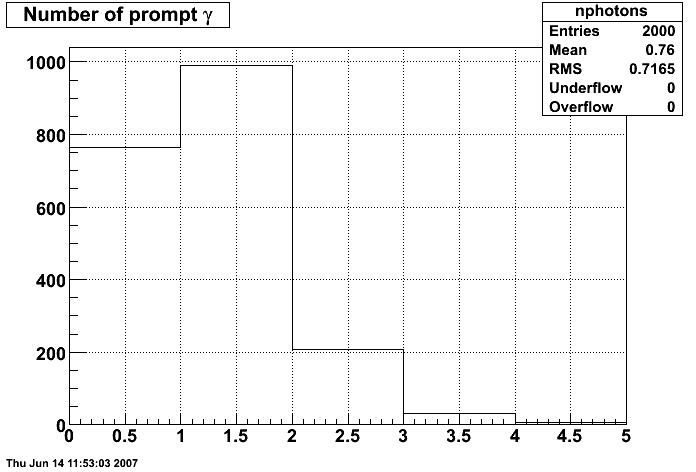
Number of prompt photons per event from GEANT record
Pibero Djawotho Last updated Fri Jun 8 16:08:27 EDT 2007