Upsilon Analysis in Au+Au 2007
Paper Title: Observation of Upsilon mesons in Au+Au collisions at sqrt(sNN) = 200 GeV
Target Journal: PRC
PAs: Rosi Reed, Debasish Das, Haidong Liu, Pibero Djawotho, Thomas Ullrich and Manuel Calderón de la Barca Sánchez.
Links.
Rosi Reed's Upsilon-related presentations.
Abstract:
We report on a measurement of the dielectron mass spectrum from 7 to 15 GeV/c2 at midrapidity in Au+Au collisions at √sNN = 200 GeV. The main contributions to the spectrum in this range are the ϒ(1S+2S+3S) states as well as the Drell Yan and b-bbar continuum. We compare the ϒ yield to the measured cross-section measured in p+p, scaled by the number of binary collisions, to obtain a nuclear modification factor of RAA (1S+2S+3S) = 0.92 +/- 0.37 (stat.) +0 -0.14 (syst.). The measured yield, which is dominated by the ϒ(1S) state, is consistent with no suppression within the available statistics.
Conclusion:
We report on a measurement of the dielectron mass spectrum near the ϒ mass region with the STAR detector. Our result opens a new era of bottomonium studies in heavy-ion collisions. The yield of ϒ(1S+2S+3S) states in 0-60% central Au+Au collisions is found to be 83 +/- 17 (stat) +/- X (syst). Given a cross-section of ϒ in p+p of 114 pb, we find that the nuclear modification factor RAA for ϒ(1S+2S+3S) → e+e is 0.92 +/- 0.37 (stat.) +0 -0.14 (syst.). Our measured yield is dominated by the ϒ(1S), so our result indicates that this state shows little suppression in Au+Au collisions at RHIC energies. We see a slight indication of suppression in the 0-10% most central collisions, but more statistics are needed to make definite conclusions. Lattice QCD results on quarkonium suppression due to color screening indicate that the ϒ(1S) state survives to ~4Tc, so the observed yield places a model-dependent upper limit on the temperature reached in Au+Au collisions at RHIC.
Figures:
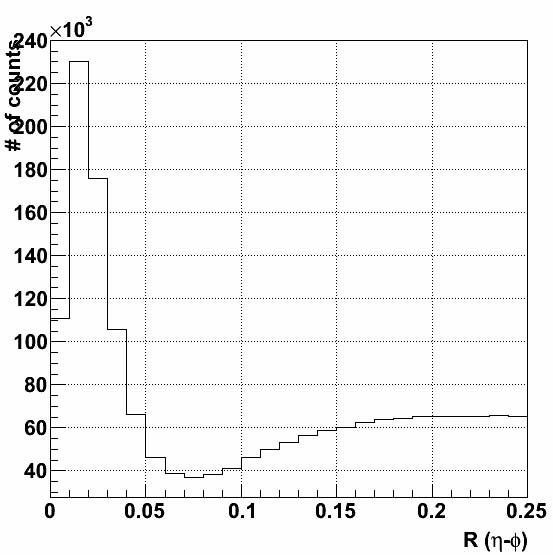
Figure 1a: The black histogram shows the η−φ radial distance R = √(Δη)2+(Δφ)2 where Δη and Δφ are the differences in η−φ between the candidate electron tracks in the TPC and the centroid of the triggered cluster in the BEMC.
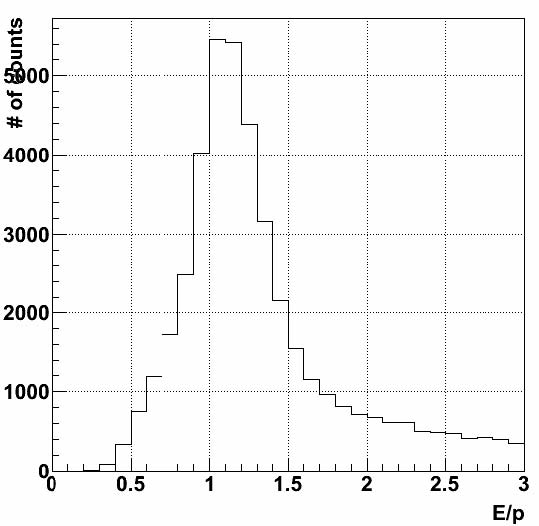
Figure 1b: The E/p distribution for towers between 6.0 < E < 7.0 GeV, and tracks which have satisfied the conditions R < 0.04 and -2.0 < nσelectron < 3.0. An electron should leave all of its energy in the calorimeter, so we would expect this distribution to be a Gaussian centered about 1. The Energy measurment includes contributions from the underlying-event, which is high in Au+Au collisions, shifting the E/p peak to values greater than 1. The tail at high E/p results from pi0 events, as the Upsilon trigger also selects dijet events.
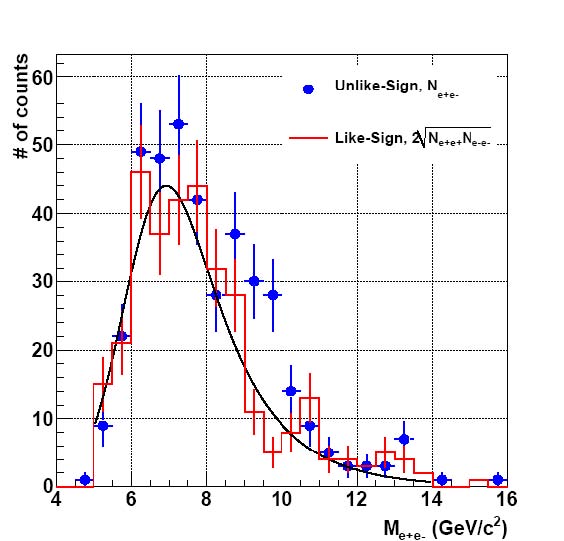
Figure 4: Invariant mass spectrum for unlike-sign (closed circles) and like-sign (line histogram) electron pairs. The like-sign spectra were combined as B = 2√N++N--.
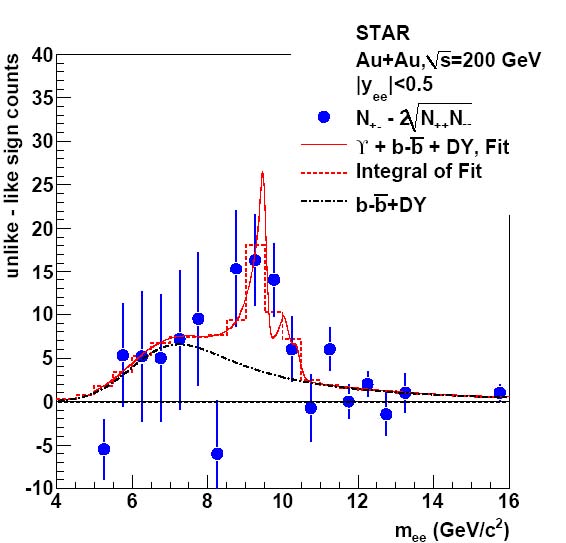
Figure 5: The solid circles depict the invariant-mass spectrum after subtraction of the like-sign combinatorial background. The fit (solid line: functional form; dashed histogram: integral in each bin) includes contributions from the ϒ states, as well as Drell-Yan and b-bbar. The ϒs are represented in the fit by three Crystal-Ball functions. The dot-dashed curve illustrates the Drell-Yan and b-bbar continuum as extracted in the fit.
Invariant Mass
0-60% Centrality
From ntuple generated on 5/25/2010. Macro MacroUpsAAInvMassMakeHistosFromTree06012010.C is attached.
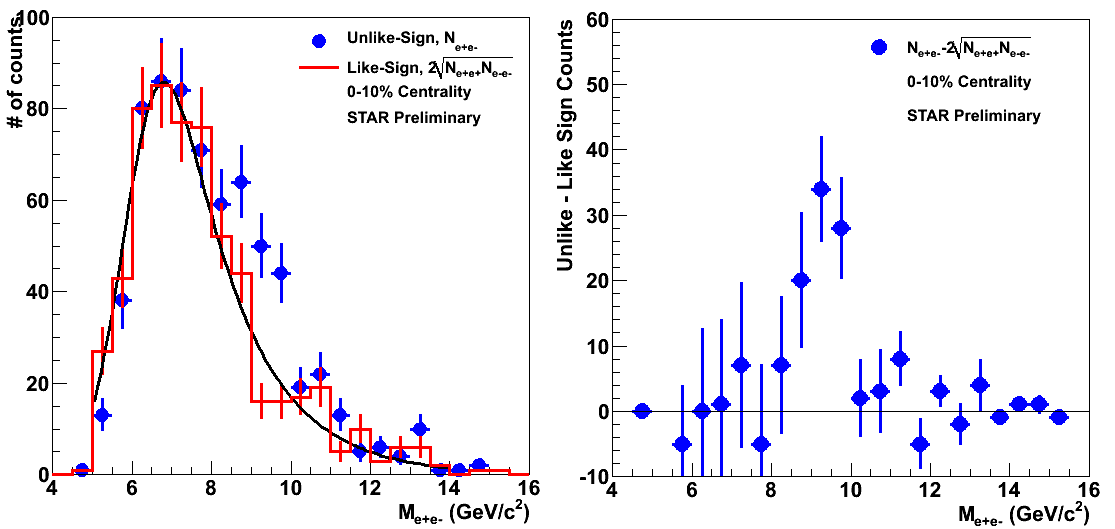
Figure 1: Invariant mass plots for 0-60% centrality. Generated with cuts -1.4<nSigmaElectron<3.0, 0.8<E/p<1.4, refMult>47. m_0 shfit was calculated to be 6.36+/-0.20 and wdith is 1.10+/-0.15. For 8<=m<=11 n+- = 258, n++ = 90, n-- = 74.
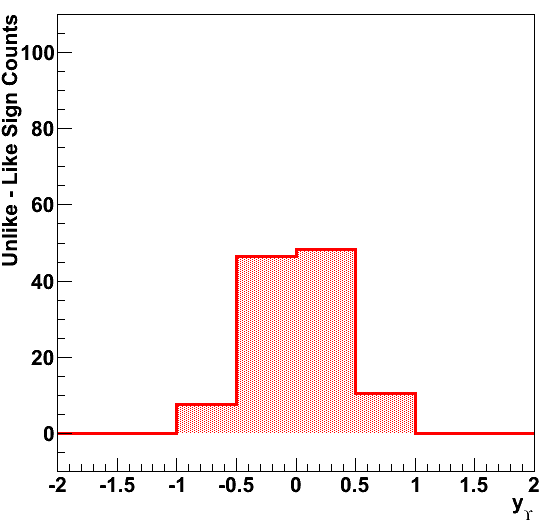
Figure 2: Invariant Mass versus rapdity for 0-60% centrality.
For refMult > 50 all values remained the same. For refMult>44, n+- =259 but everything else remained the same.
This indicates that the systematic uncertainty on dN/dy for the 0-60% centrality is extremely small.
0-10%
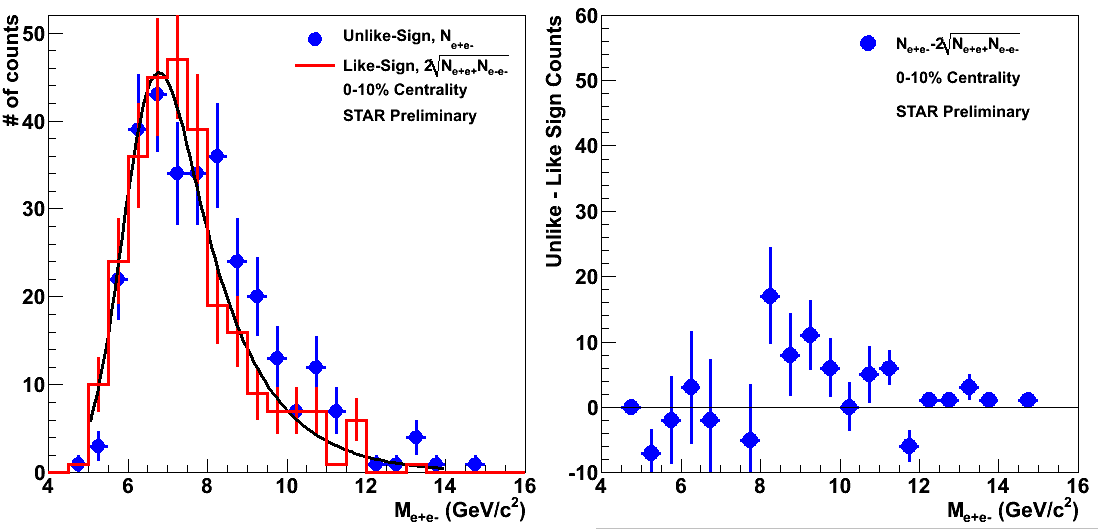
Figure 3: Invariant mass plots for 0-10% with the same cuts as Figure 1 except refMult>430. m_0shift = 6.39 +/- 0.25 and width 0.99 +/- 0.15. n+- = 112, n-- = 28, n++ = 37.

Figure 4: Invariant mass versus rapidty for 0-10% centrality.
For refMult>449 m_0 shift = 6.50 +/- 0.32 width = 1.05 +/- 0.18
n+- = 104, n-- = 28, n++ = 35
For refMult>411 m_0 shift 6.41 +/- 0.28 width = 1.10 +/- 0.17
n+- = 140, n-- = 35, n++ = 44
ref>449
N++ = 34
N-- = 28
N+- = 98
ref>411
N++ = 43
N-- = 35
N+- = 133
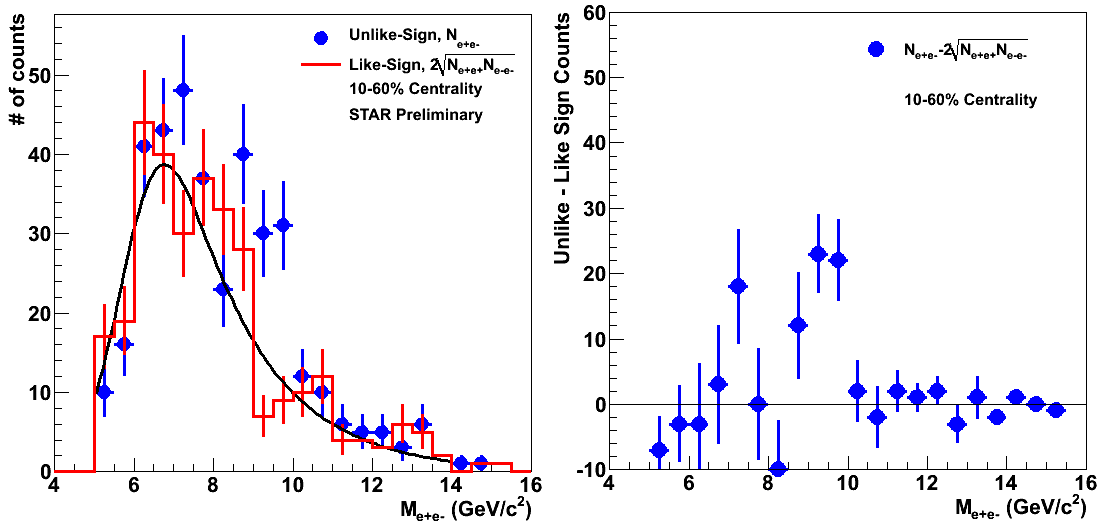
Figure 5: Invariant mass plots for 10-60% with the same cuts as Figure 1 except 47<refMult<430. m_0shift = 6.20 +/- 0.33 and width 1.16 +/- 0.29. n+- = 146, n-- = 46, n++ = 53.
The lower cut in refMult does not change the value much, see discussion for Figures 1 and 2. If we vary the higher refMult cut, the results are:
47<ref<449
N++ = 56
N-- = 46
N+- = 157
47<ref<411
N++ = 46
N-- = 39
N+- = 125
For the 3 cases, we can calculate the signal (upsilon+DY+b-bbar) as:
0-10% S = 48 +/- 13(stat) +7/-12 (sys)
10-60% S = 47 +/-16(stat) +8/-7 (sys)
0-60% S = 95 +/- 21(stat) +1/-0 (sys)
Where the systematic errors here are only related to the uncertainty in the centrality definition. The uncertainty in the efficiency due to the centrality selection will be calculated using embedding. I looked at the differences in the yield from data because the refMult distribution of upislon candidates is drastically different than the triggered or minbias distribution. It is heavily weighted towards the central end, which is why uncertainty on the cut for 60% central events doesn't make a large difference. We don't really have any upsilon candidate events with refMult < 47 (candidate defined as a trigger cluster with tracks extrapolated to the clusters with basis PID cuts).
In the 0-60% centrality case, we unfortunately have a downward fluctuation in the background curve right under the upsilon peak. Instead of using the background histogram, I populated a histogram using the fit to the background and filled it with the same number of counts as the original background. I then set the error bars in each bin of the new histogram to the same values as in the original background histogram.
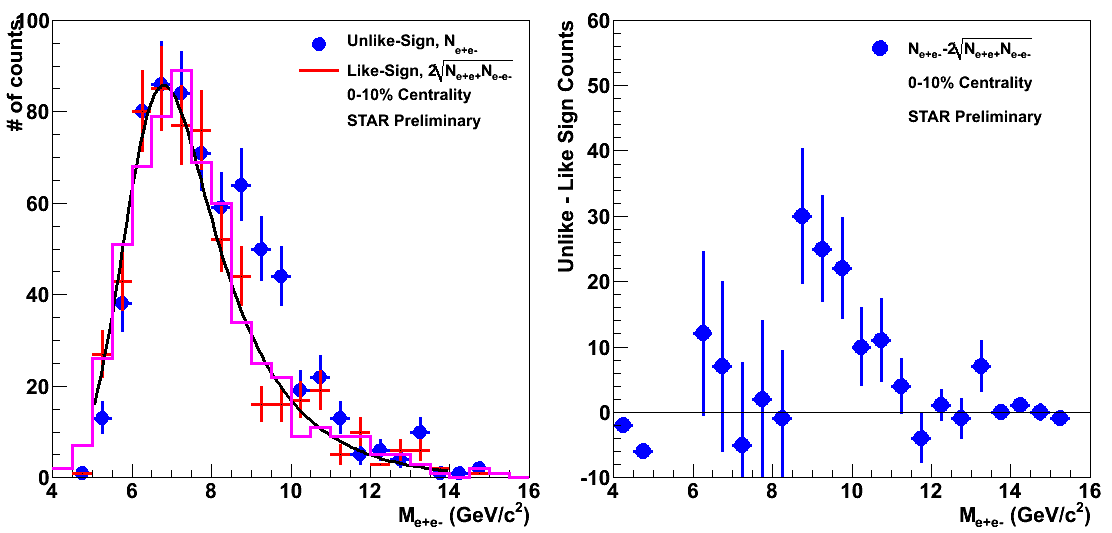
Figure 5: Purple histogram on the left is the created histogram and the histogram on the right is the subtracted histogram using the purple histogram instead of the red background histogram. The resulting counts are 101 in the signal region. The number when using the background histogram is 103.
Invariant Mass fits
In order to calculate the yield of the Upsilon (1S+2S+3S) state, we need to be able to subtract out the contribution from Drell Yan (DY) and the b-bbar continuum. This is difficult because the yields are not known precisely for this mass range in p+p, and in Au+Au the b-bbar continuum is hypothesized to experience some supression.
0-60% Centrality
First, fit leaving the amplitude for the DY, b-bbar and total upsilon yield free. The ratio of the 1S, 2S and 3S states is kept the same as in p+p.
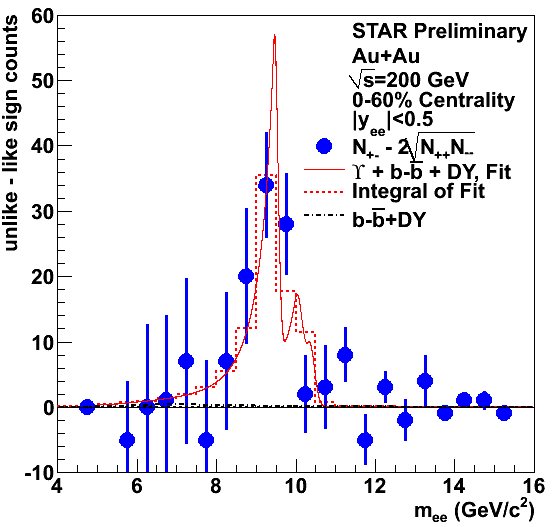
Figure 1: 0-60% centrality fit with 3 free parameter, the yield of DY, b-bbar and upislon. The chi^2/dof for this fit is 1.28. The number of b-bbar counts is 0, and the number of DY counts is 1.15 +/- 22.3. The upsilon yield in 5<m<16 from the fit is 88.2+/-17.7 and is 100.4+/-20.2 from a bin-by-bin counting.
Given our statistics and the very similar shape of the DY and b-bbar curve, the fit in Figure 1 convinced me that it is best to fit with only 1 parameter that is the sum of the DY and b-bbar background.
Next, the question must be asked, do we see any evidence for upsilons in this region? Or can we explain the entire unlike sign subtracted yield by the combination of Drell-Yan and b-bbar background?
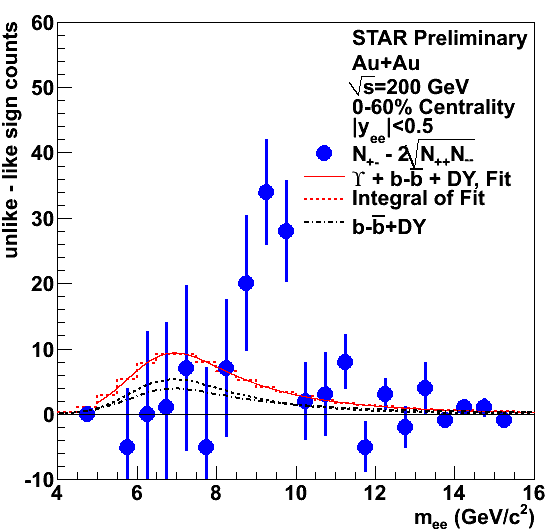
Figure 2: 0-60% Centrality fit with only the DY and b-bbar background. It is obvious that this fit can not explain the peak, which indicates that we do observe Upsilons in Au+Au collisions. The chi^2/dof was 2.56. The yield of b-bbar was 12.7 +/- 25.3 and the DY yield was 11.2 +/- 24.4. The total counts in the region 8<m<11 is 94, which is much larger than the yield from the fit.
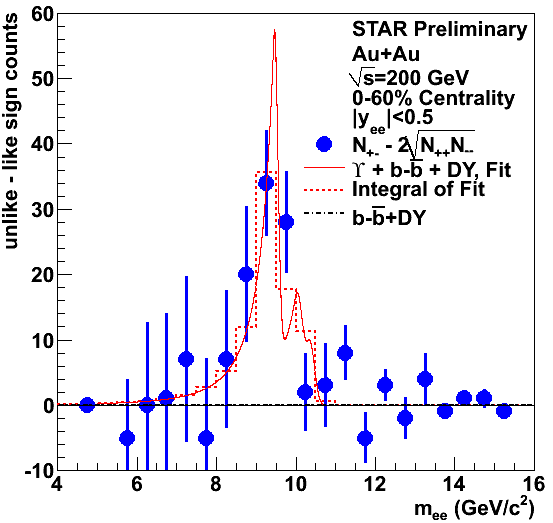
Figure 3: Fit to data assuming that there is no Drell-Yan or b-bbar background. This fit will give the largest yield of upsilons and will be used for the systematic uncertainty. The chi^2/dof is 1.14. The upsilon yield in 5<m<16 is 88.9+/- 16.3 by fit and 101.6 +/- 18.7 by a bin by bin counting method.
If we assume no suppression of a particular physics process, we are assuming RAA = 1. Rearranging this equation gives us:

In our p+p paper, we quote a combined yield of (sigma DY + sigma b-bbar )||y|<0.5, 8<m<11 GeV/c^2 = 38 ± 24 pb.
For 0-60% NmbAA = 1.14e9 and Nbin = 395. Sigma_pp is 42 mb at sqrt(s)=200 GeV. This means the number of expected DY and b-bbar counts in the 8<m<11 GeV mass range is (1.14e9)x395x38e-12/42e-3 = 407 +/- 257 if Nbin scaling were true.
If we assume the efficiency for the DY and b-bbar->e+e- is the same as the upsilon within this range, we can use the calculated upsilon efficiency of 4.4%. This means we'd expect to observe 18+/- 11 DY and b-bbar counts in 8<m<11.
The cross section for Upsilon(1S+2S+3S) was reported as 114 +/- 38(stat) pb, over all ranges. Doing the same calculation, we'd expect 1222 +/- 407 counts if Nbin scaling were true. With the calculated efficiency, this number becomes: 54 +/- 18 counts.
L2 Parameters
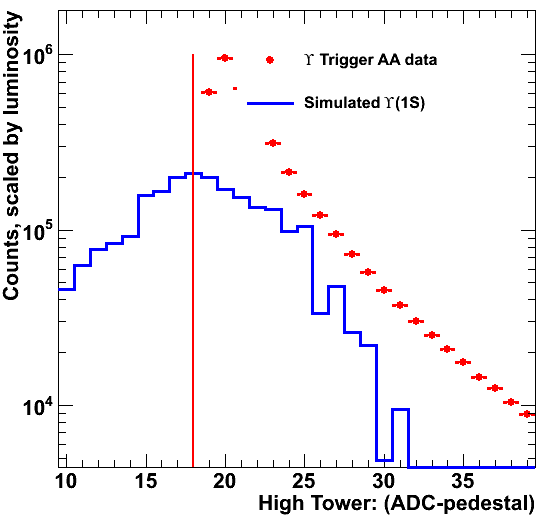
Figure 1: Red points are the bit-shifted adc-pedestal value of the tower with the highest adc value. The blue curve is from embedding series 120-123 upsilon 1S scaled by 5000.
NmbAA calculation
NmbAA = #upsilon minbias events in the given centrality bin
upsilon minbias trigger ID 200611
Total # of ups-mb events = sum #ups-mb(i)*prescale(i) where i is done on a run by run basis
To calculate this #, I used Jamie's bytrig.pl script, which returns a cross-section per run #
This cross-section was calculated assuming a "minbias" cross-section of 3.12 b. This number is comes from Jamies assumption that 10 b is the ZDC cross-section, but 3 b is from E&M processes that don't produce any particles and won't fire the vpd-mb trigger. 7 b is the hadronic cross-section as calculated by Glauber, but the vpd will miss about 1 b in the peripheral region. Then, the vpd vertex cut will remove ~1/2 of all triggers giving a cross-section ~3.12 b. This number is very ad hoc, but is necessary to use in order to get the # of events from the macro. To get from the integrated luminosity per run number to the # of minbias events, one calculates int L(i)/min-bias cross section = #minbias triggers(i) x prescale(i). I have confirmed that this works by checking some run numbers calculated by the script versus the runlog.
Summing over all "good" runs gives a total number of upsilon minbias triggers x prescale of 1.57 x 10^9. Attached is a spread sheet of each run number, the number of L2 upsilon triggers, the integrated luminosity per run # and the # of ups-mb triggers x prescale for that run #.
This information was presented to the HF list in presentation at:
http://drupal.star.bnl.gov/STAR/system/files/HF05112010.ppt
The error on this number is essentially zero because the statistical error of a number of order 10^9 is of order 1/10000, see: http://www.star.bnl.gov/HyperNews-star/protected/get/heavy/2753.html for discussion.
Next, we need the number of these events that are in the 0-60% or the 0-10% centrality bin. Since the vpd is inefficient for peripheral collisions, the total number of upsilon minbias events should be higher than what we see in the detector. First, we need to know the reference multiplicity cut for these centrality bins. See:
http://drupal.star.bnl.gov/STAR/system/files/HF06012010.ppt
Centrality
This trigger could not use the standard STAR centrality definitions because the base upsilon minbias trigger had a much wider vpd cut then the +/-30 cm that the more generic minbias trigger had. Beyond 30 cm the acceptance of the TPC changes, which means that the reference Multiplicity will not be constant. The centrality definitions are calculated by integrating a glauber model calculation of the reference Multiplicity.
First, I used Hiroshi Masui's code "run_glauber_mc.C" which runs the actual glauber simulation to generate Ncoll and Npart for 100k throws. The default values are for AuAu 200 GeV. The created root file along with the refMult from the upsilon minbias data set are then analyzed with NbdFitMaker. This code attempts to take Npart and Ncol and turn those into a reference multiplicity by using the two component model to describe the reference multiplicity. See Hiroshi's talk at:
dN/deta = npp[(1-x)Npart/2 + xNcoll] and is convoluted with a negative binomial distribution with 2 free parameters. The calculated RefMult is then matched to the data refMult at high refMults where the trigger efficiency should be 100%. Minuit is not used because it doeos not converge. I found that it was difficult to get these distributions to match exactly at the high end. Stepping through the allowed range of parameters, I found that mu = 2.2, x = 0.145 and k = 2.0 gave the closest result of chi^2/dof of 2.2 (for refMult>100). This resulted in a total efficiency of 84.6% and 100% for centrality 0-60%. Changing x and k by a reasonable amount did not significantly change the centrality defintion. Changing mu did change the centrality defintion slightly.
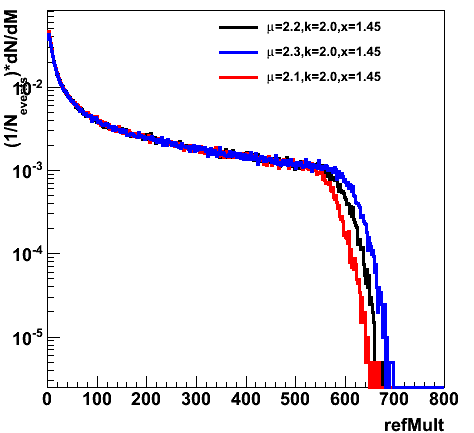
Figure 1: RefMult distributions versus changes in mu. The default mu was set to 2.4 which is ~npp the mean multipliclity of p+p collisions. This was changed to match the upsilon trigger minbias refmult distribution.
The calculated refMult cuts are > 47+/-3 for 0-60% centrality and >430+/-19 for 0-10% centrality.
Output and input files for this calculation can be found at:
/star/u/rjreed/UpsilonAA2007Paper/GlauberRefMult/
Hiroshi's code used for this exercise can be found at:
/star/u/rjreed/glauber/Try02/
Attached to this note is the "Centcut.C" macro used to generate Figure 1 and calculate the centrality versus refMult and the systematic uncertainty in that number.
Also of interest is the refMult distributions of the L2 upsilon triggered data set and the candidates. I normalized all these distributions to the glauber calculation at the high end. This is especially true of the candidate distribution as there can be more than one candidate per vertex. For these purposes, I limited the distributions to the index 0 vertices.
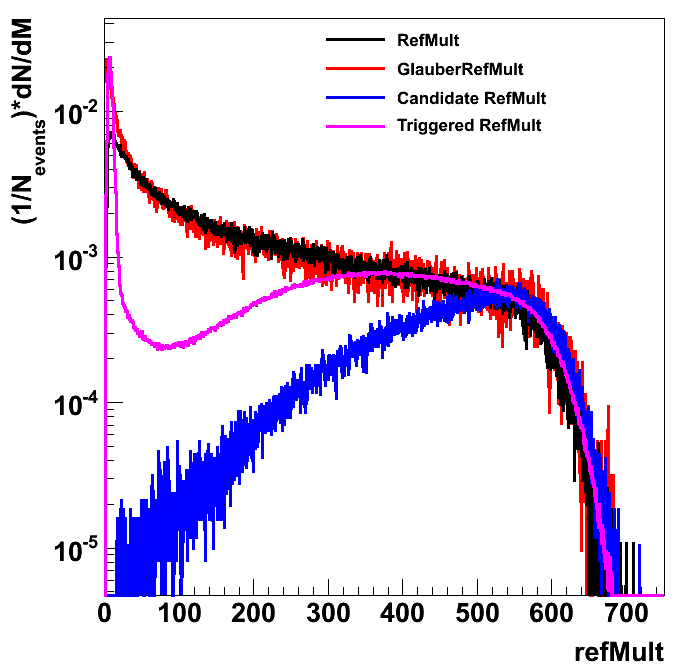
Figure 2: Normalized refMult distributions for the upsilon minbias trigger in black, the glauber calculation in red, the L2 upsilon triggered sample in pink and the upsilon candidates in blue. Candidates were chosen from index 0 vertices where the two daughter particles had an R<0.04, -2<nsigmaElectron<3 and E/p<3. Macro used to generate this graph, drawRef2.C is attached to this post.
Another number that is needed from this calculation is Nbin, the number of binary collsisions. I altered Hiroshi's code so that it created a text file with Ncoll, Nbin and refMult. This allowed me to calculate the average Nbin for a particular refMult. For 0-60% centrality, Nbin = 395 +/- 6.5(sys) and for 0-10% centrality Nbin = 964 +/- 27(sys). Additional systematic uncertainties due to the cross-section, Woods-Saxon distribution and exclusion region need to be checked. Attached is a spreadsheet I made from the output text file that allowed me to calculate these numbers. The values were generated with the mu=2.2 k=2.0 x=0.145 values, but the different centrality cuts were applied.
The corrected yield for upsilons is calculated as (1/NmbAA)*(dN/dy). We can cancel out the base minbias efficiency from this number by using the exact same cuts for NmbAA and dN/dy. This means that we merely need to calculate the number of minbias triggers that pass the reference multiplicity cut. For 0-60% centrality, NmbAA = 1.14e9 +0.2e9/-0.1e9 (sys due to centrailty determination) and for 0-10% centrality NmbAA = 1.78e8 +0.25e8/-0.24e8 (sys due to centrality determination)