Upsilon analysis in p+p 2009 - Yield Extraction
Upsilon cross-section in p+p collisions at sqrt(sNN) = 200 GeV, 2009 data - Yield Extraction
Note: All plots are currently using -1.8 < nσe < 3 which is not optimized for this analysis!
Note: All plots are using every run using Trigger ID 240641; run-by-run QA has not yet been completed or implemented!
- Invariant mass distributions
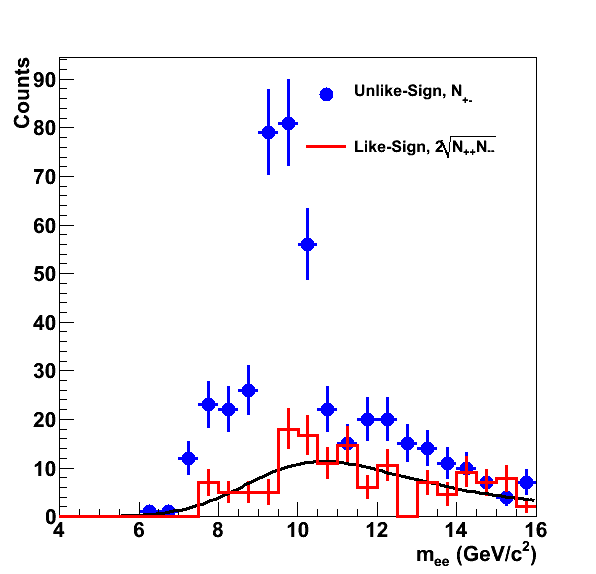
- Unlike-sign and Like-sign inv. mass (Drew)
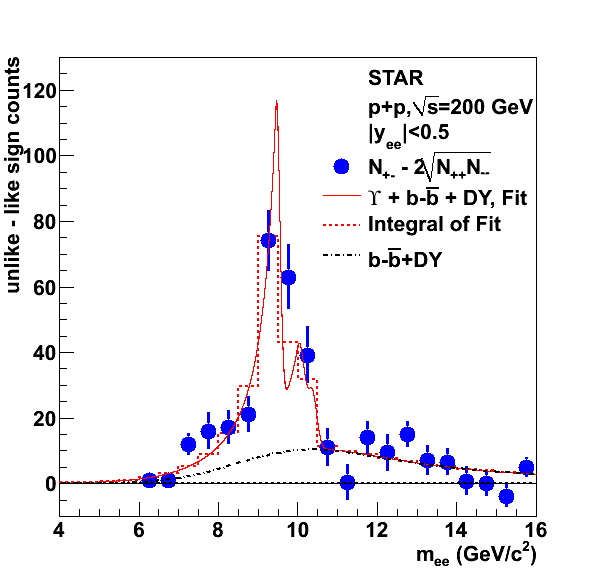
- Like-sign subtracted inv. mass (Drew)

- Fit is from 5 GeV/c2 to 16 GeV/c2
- Crystal-Ball shapes from embedding/simulation. (Kurt)
- 0<pt<10 & 0<|y|<0.5
Param 1S 2S 3S alpha 1.18 1.16 1.21 n 1.83 2.06 2.04 mu 9.46 10.02 10.35 sigma 0.125 0.143 0.150 0<pt<10 & 0.5<|y|<1
-
Param 1S 2S 3S alpha 1.21 1.21 1.27 n 1.85 1.96 1.89 mu 9.46 10.02 10.35 sigma 0.124 0.145 0.154 - 0<pt<2 & 0<|y|<0.5
-
Param 1S 2S 3S alpha 1.30 1.43 1.12 n 1.81 1.65 2.78 mu 9.46 10.02 10.35 sigma 0.119 0.139 0.141 - 0<pt<2 & 0.5<|y|<1
-
Param 1S 2S 3S alpha 1.72 1.53 1.25 n 1.23 1.86 2.37 mu 9.46 10.02 10.35 sigma 0.141 0.151 0.163 - 2<pt<4 & 0<|y|<0.5
-
Param 1S 2S 3S alpha 1.30 1.14 1.31 n 1.72 2.12 1.85 mu 9.46 10.02 10.35 sigma 0.126 0.134 0.155 2<pt<4 & 0.5<|y|<1
-
Param 1S 2S 3S alpha 1.59 1.25 1.65 n 1.52 2.13 1.23 mu 9.46 10.02 10.35 sigma 0.135 0.139 0.159 - 4<pt<6 & 0<|y|<0.5
-
Param 1S 2S 3S alpha 1.11 1.22 1.30 n 1.97 2.17 2.07 mu 9.46 10.02 10.35 sigma 0.117 0.152 0.155 - 4<pt<6 & 0.5<|y|<1
-
Param 1S 2S 3S alpha 1.17 1.60 1.30 n 2.20 1.46 1.66 mu 9.46 10.02 10.35 sigma 0.136 0.179 0.162 - 6<pt<8 & 0<|y|<0.5
-
Param 1S 2S 3S alpha 1.08 1.11 .984 n 2.07 2.18 2.82 mu 9.46 10.02 10.35 sigma 0.138 0.154 0.154 - 6<pt<8 & 0.5<|y|<1
-
Param 1S 2S 3S alpha 1.06 1.22 1.03 n 2.16 2.16 2.75 mu 9.46 10.02 10.35 sigma 0.133 0.166 0.165 - 0<pt<2 & 0<|y|<1
-
Param 1S 2S 3S alpha 1.39 1.46 1.18 n 1.66 1.63 2.42 mu 9.46 10.02 10.35 sigma 0.124 0.142 0.146 - 2<pt<4 & 0<|y|<1
-
Param 1S 2S 3S alpha 1.33 1.16 1.35 n 1.72 2.10 1.78 mu 9.46 10.02 10.35 sigma 0.128 0.135 0.152 - 4<pt<6 & 0<|y|<1
-
Param 1S 2S 3S alpha 1.10 1.25 1.32 n 2.06 1.90 1.93 mu 9.46 10.02 10.35 sigma 0.121 0.157 0.157 - 6<pt<8 & 0<|y|<1
-
Param 1S 2S 3S alpha 1.08 1.25 1.00 n 2.06 2.18 2.71 mu 9.46 10.02 10.35 sigma 0.138 0.156 0.156 - Crystal-ball parameters to be used in fit (Drew)
0<pt<10 & 0<|y|<1
Param 1S 2S 3S alpha 1.21 1.21 1.27 n 1.85 1.96 1.89 mu 9.46 10.02 10.35 sigma 0.124 0.145 0.154 - Unlike-sign and Like-sign inv. mass (Drew)
- Fit to Like-sign subtracted inv. mass, using CB, DY, b-bbar.
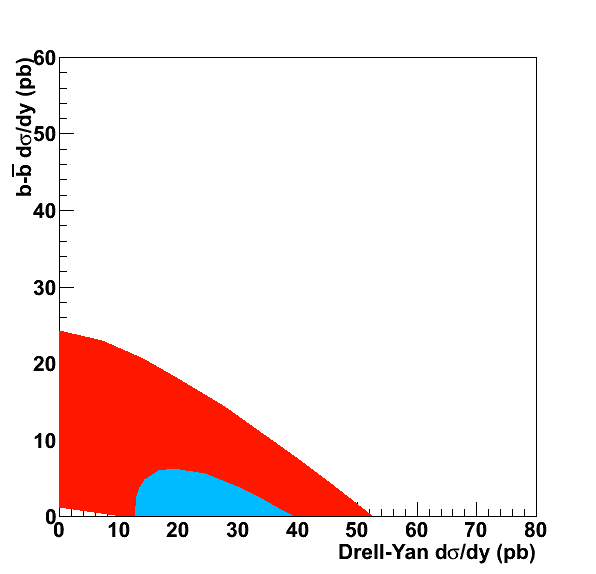
- Contour plot (1sigma and 2sigma) of b-bbar cross section vs. DY cross section. (Drew)

- This plot is flawed -- using 2006 background fit and integrated luminocity
- Upsilon yield estimation and stat. + fit error. (Drew)
- Contour plot (1sigma and 2sigma) of b-bbar cross section vs. DY cross section. (Drew)
- (2S+3S)/1S
- Method 1
- Fix the 1S, 2S, and 3S to PDG ratios
- f = (CB1 + (CB2+CB3)*B ) / N
- B = (pp2009 2S+3S) / (PDG 2S+3S)
- Method 2
- Fix the 1S, 2S, and 3S to PDG ratios
- f = (CB1 + CB2*B2 + CB3*B3) / N
- Need to think more about what B2 and B3 are
- B2 = pp2009(2S / 1S)?
- B3 = pp2009(3S / 1S)?
- Method 1
