Performance testing'13
I. Intro
Three nodes tested: my own laptop with home-quality SSD drive, reserve1.starp.bnl.gov (old db node), db04.star.bnl.gov (new node).
II. hdparm results:
extremely basic test of sequential read - baseline and sanity check [passed]
1. Dmitry's laptop (SSD):
/dev/disk/by-uuid/88ba7100-0622-41e9-ac89-fd8772524d65:
Timing cached reads: 1960 MB in 2.00 seconds = 980.43 MB/sec
Timing buffered disk reads: 532 MB in 3.01 seconds = 177.01 MB/sec
2. reserve1.starp.bnl.gov (old node):
/dev/md1:
Timing cached reads: 2636 MB in 2.00 seconds = 1317.41 MB/sec
Timing buffered disk reads: 252 MB in 3.02 seconds = 83.34 MB/sec
3. db04.star.bnl.gov (new node):
/dev/disk/by-uuid/53f45841-0907-41a0-bfa3-52cd269fdfb6:
Timing cached reads: 5934 MB in 2.00 seconds = 2969.24 MB/sec
Timing buffered disk reads: 884 MB in 3.00 seconds = 294.19 MB/sec
III. MySQL bench test results: test suite to perform "global" health check, without any particular focus, single thread..
1. laptop:
connect: Total time: 113 wallclock secs (44.75 usr 16.29 sys + 0.00 cusr 0.00 csys = 61.04 CPU)
create: Total time: 221 wallclock secs ( 7.22 usr 1.96 sys + 0.00 cusr 0.00 csys = 9.18 CPU)
insert: Total time: 894 wallclock secs (365.51 usr 64.07 sys + 0.00 cusr 0.00 csys = 429.58 CPU)
select: Total time: 240 wallclock secs (33.26 usr 3.86 sys + 0.00 cusr 0.00 csys = 37.12 CPU)
2. reserve1.starp.bnl.gov:
connect: Total time: 107 wallclock secs (44.85 usr 14.88 sys + 0.00 cusr 0.00 csys = 59.73 CPU)
create: Total time: 750 wallclock secs ( 6.37 usr 1.52 sys + 0.00 cusr 0.00 csys = 7.89 CPU)
insert: Total time: 1658 wallclock secs (378.28 usr 47.53 sys + 0.00 cusr 0.00 csys = 425.81 CPU)
select: Total time: 438 wallclock secs (48.92 usr 4.50 sys + 0.00 cusr 0.00 csys = 53.42 CPU)
3. db04.star.bnl.gov:
connect: Total time: 54 wallclock secs (18.63 usr 11.44 sys + 0.00 cusr 0.00 csys = 30.07 CPU)
create: Total time: 1375 wallclock secs ( 1.94 usr 0.91 sys + 0.00 cusr 0.00 csys = 2.85 CPU) [what's this??]
insert: Total time: 470 wallclock secs (172.41 usr 31.71 sys + 0.00 cusr 0.00 csys = 204.12 CPU)
select: Total time: 185 wallclock secs (16.66 usr 2.00 sys + 0.00 cusr 0.00 csys = 18.66 CPU)
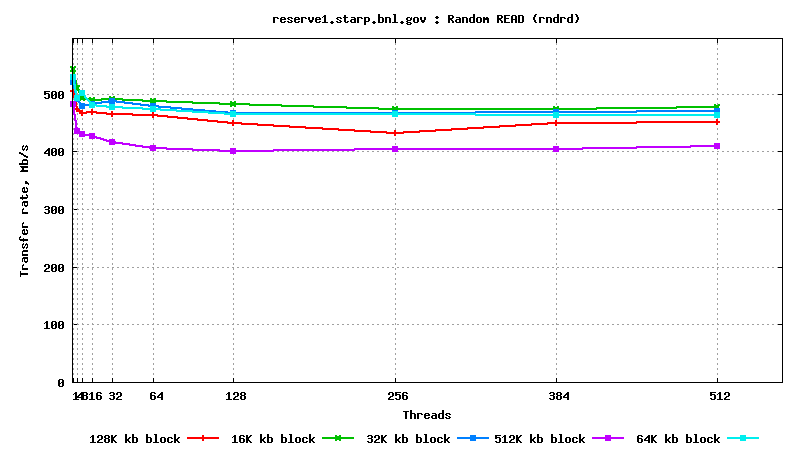
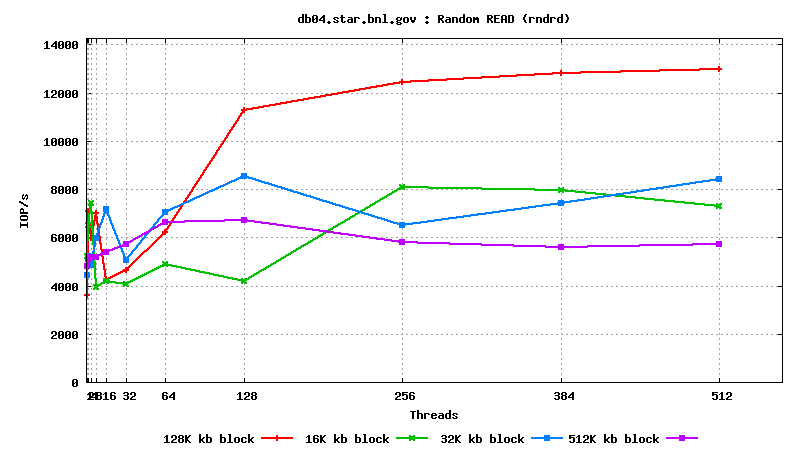
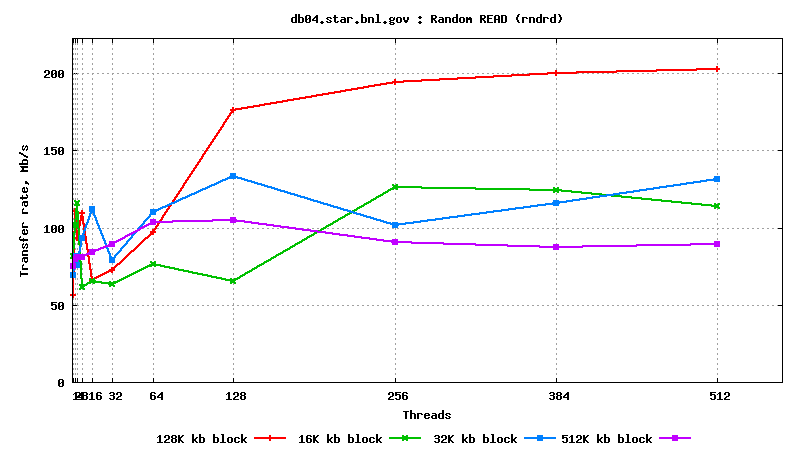
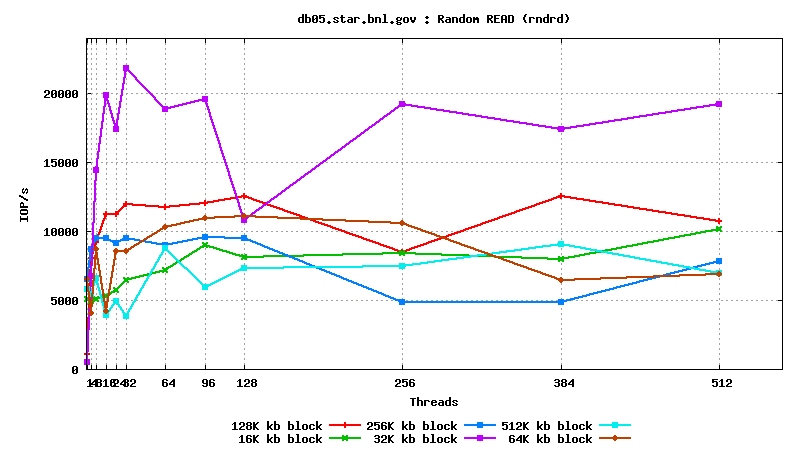
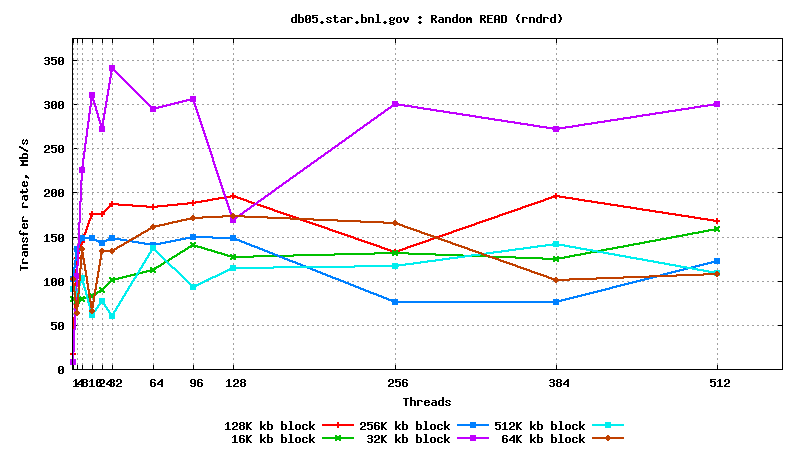
IV. SysBench IO test results: random reads, small block size, many parallel threads
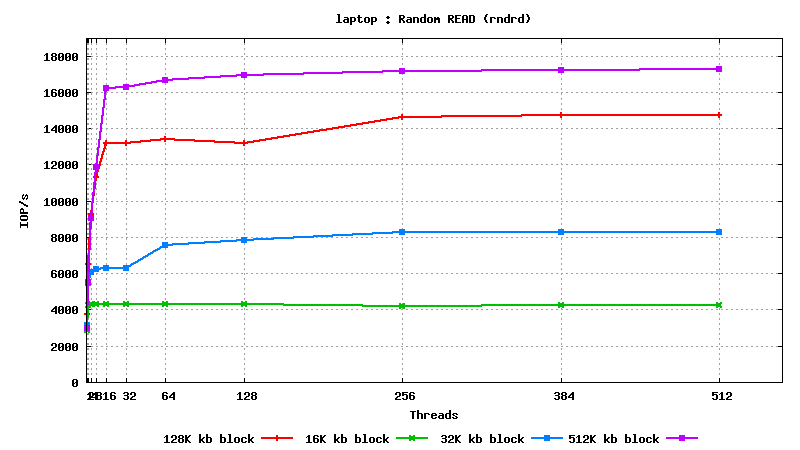 t
t
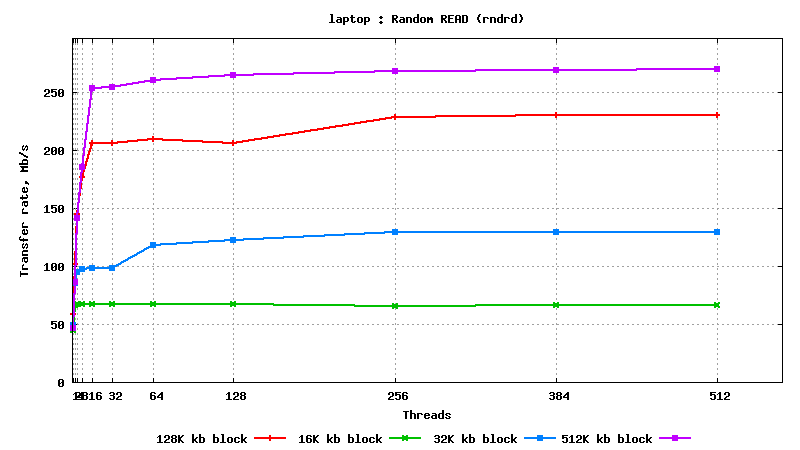
est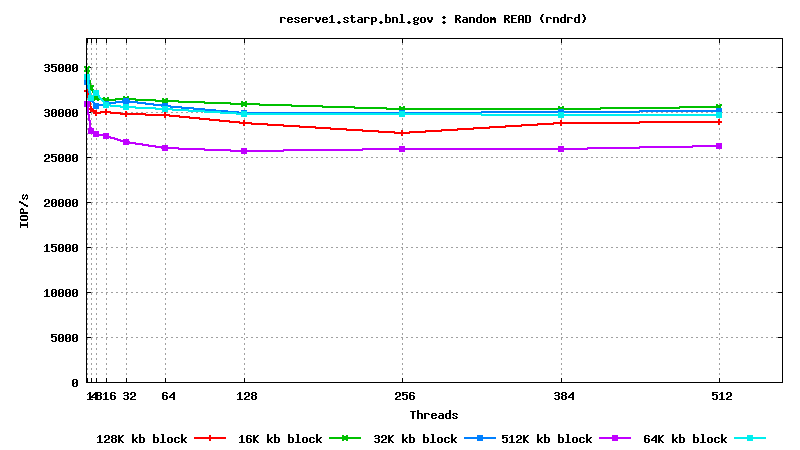
DB05.star.bnl.gov, with "noatime" option:
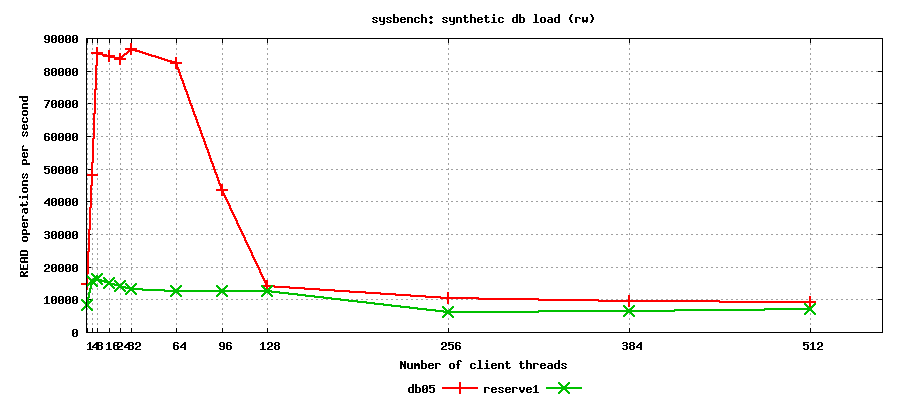
V. SysBench SQL test results: synthetic read-only
Interestingly, new system beats old one by a factor of x7 up to 128 clients, and is only marginally better at 128+ parallel threads..
V. STAR production chain testing (nightly test BFC):
Test setup:
- auau200, pp200, pp500 x 10 jobs each, run using db05 (new node) and db10 (old node, equivalent to reserve1.starp);
- jobs run in a single-user mode: one job at a time;
- every server was tested in two modes: query cache ON, and query cache OFF (cache reset between tests);
- database maker statistics was collected for analysis;
RESULTS:
auau200, old -> new :
qc_off: Ast = 2.93 -> 2.79 (0.1% -> 0.1%), Cpu = 0.90 -> 1.15 (0% -> 0%)
qc_on : Ast = 2.45 -> 2.26 (0.1% -> 0.1%), Cpu = 0.88 -> 0.86 (0% -> 0%)
pp200, old -> new :
qc_off: Ast = 2.72 -> 6.49 (5.59% -> 10.04%), Cpu = 0.56 -> 0.86 (1.36% -> 1.83%)
qc_on : Ast = 2.24 -> 3.20 (4.90% -> 6.49%), Cpu = 0.60 -> 0.55 (1.46% -> 1.32%)
pp500, old -> new:
qc_off: Ast = 2.65 -> 2.41 (15.9% -> 15.4%), Cpu = 0.55 -> 0.79 (5.05% -> 6.2%)
qc_on : Ast = 2.09 -> 1.94 (13.8% -> 14.8%), Cpu = 0.53 -> 0.53 (4.87% -> 4.88%)
Summary for this test:
- as expected, databases with query cache enabled were processing requests faster than databases;
- new node (having query cache on) is performing at the level very similar to old node, difference is not noticable/significant within test margins;
Additional studies: db11 (very new node):
![]()