Run 6: Issues with 2006 BeamLine calibration
From the beamline constraint calibration which has been done for the BeamLine constraint calibration for p+p 2006, there is some reason for concern over the relatively large fluctuations seen in the vertical position of the beamline constraint during periods II and III of the run (the transverse polarization period and the second longitudinal polarization period). To investigate this further, I have examined the beamline constraint as a function of luminosity (as measured by the east+west sum of the zdc rates).
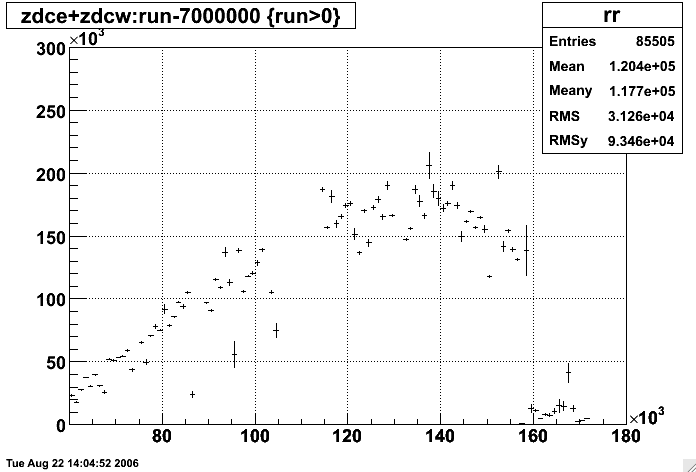
In order to get the zdc information, I averaged all zdc values of each run to use a a single value for each run. I plot here the average for each day just for demonstration.
I will focus only on the 200 GeV running for now (periods I-III, up to day 157).
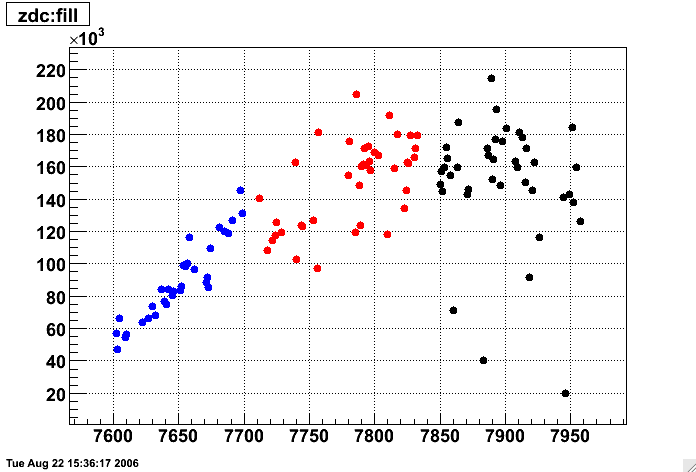
The first thing I looked at was my calibrated y-intercept of the beamline constraint vs. zdc and zdc vs. fill number (which is pretty similar to the above plot), where zdc is averaged by Sum{zdc[run] * N_verts[run]} / N_verts[all]. In these plots, the color represents the run period: blue=I, red=II, black=III:
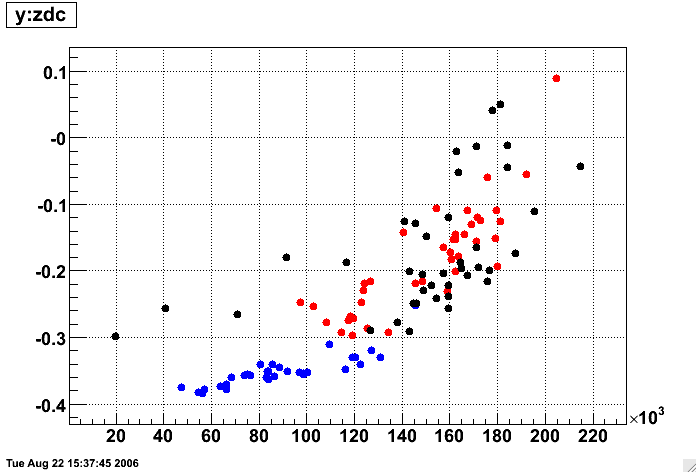
It is clear from these plots that there IS some correlation between y and zdc rate for all three periods. The first period also shows a strong correlation between zdc rate and fill (the RHIC luminosity was increasing as time progressed, and the luminosity plateaued for subsequent running). This information by itself is not enough to say whether there is a distortion in the TPC; it could simply mean that there is a correlation between how much luminosity the collider delivers and the vertical position of the beam, which is not all that unlikely.
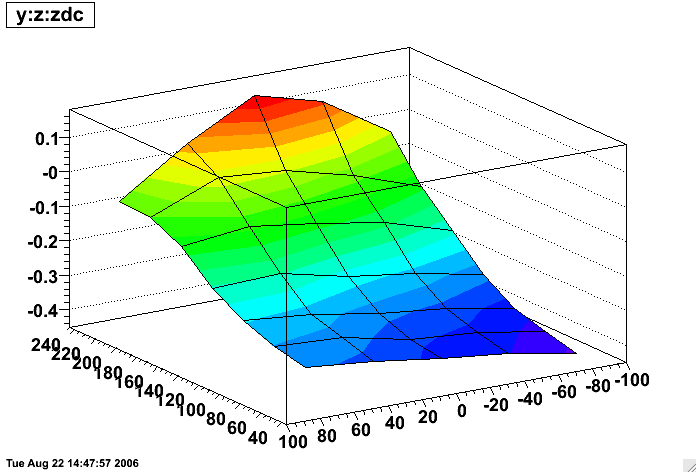
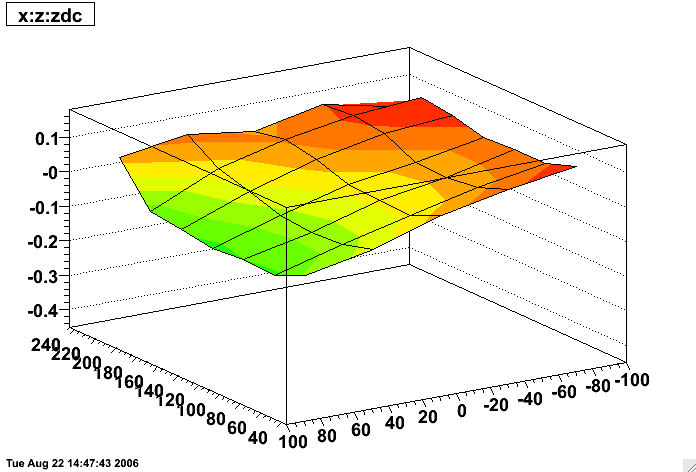
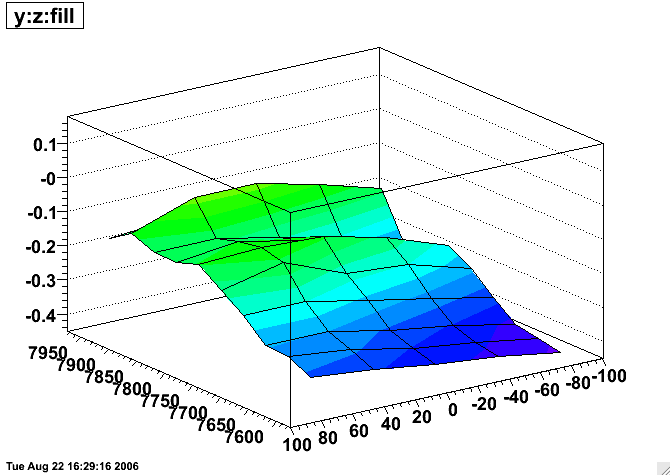
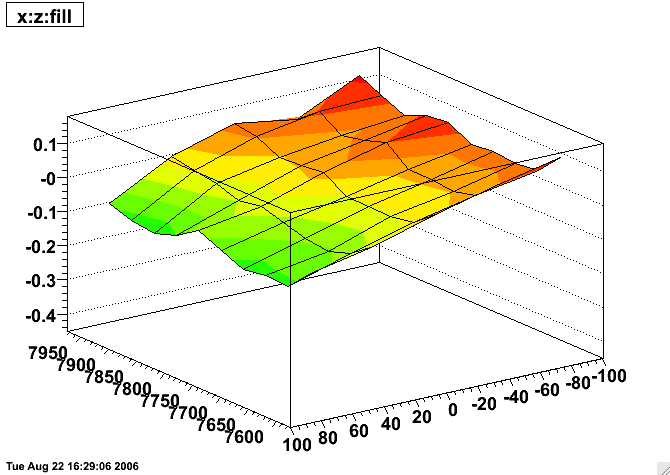
To investigate further, I created an ntuple with all the vertices used in the beamline calibrations and stored the fill number and zdc rate for each reconstructed vertex. Normally, the beamline is found by simply projecting the vertex positions onto plots of y vs. z, and x vs. z and fitting straight lines. But now I can plot differentially vs. zdc or fill, as I have done in the next 4 plots. In each plot, a single slice in zdc is a profile of y vs. z or x vs. z. The plots have z of the reconstructed vertices on the lower right horizontal axis, zdc rate divided by 1000 (or fill number ) on the lower left horizontal axis, and the profile of y for the vertical axis, and the scales are held identical for all four plots.
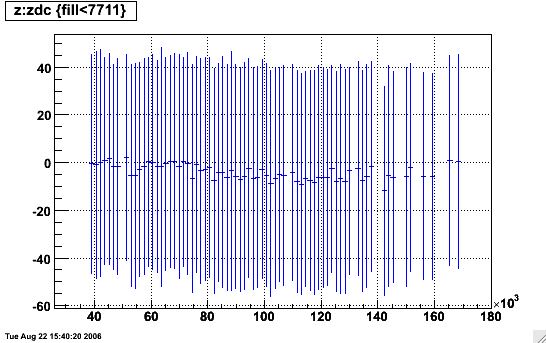
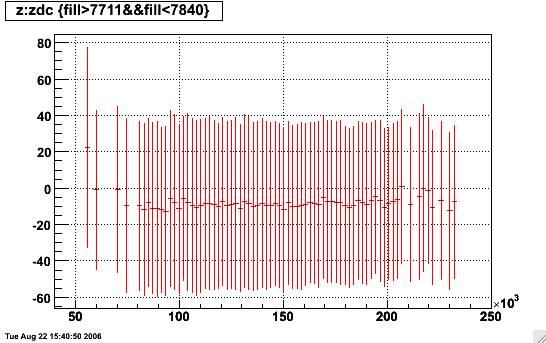
For some idea of the errors on these data, here is the error plot for the y:z:zdc plot (the x:z:zdc errors are nearly identical):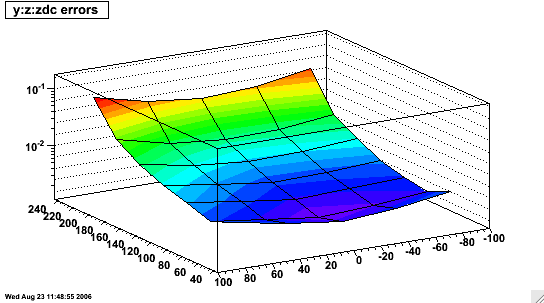
These plots possibly suffer to some degree from overlapping different run periods where different beam tunes were actually quite likely (the trade off is that they get improved statistics). So the next set of plots show y and x vs. zdc by period (arranged as periods I, II, III from top to bottom):
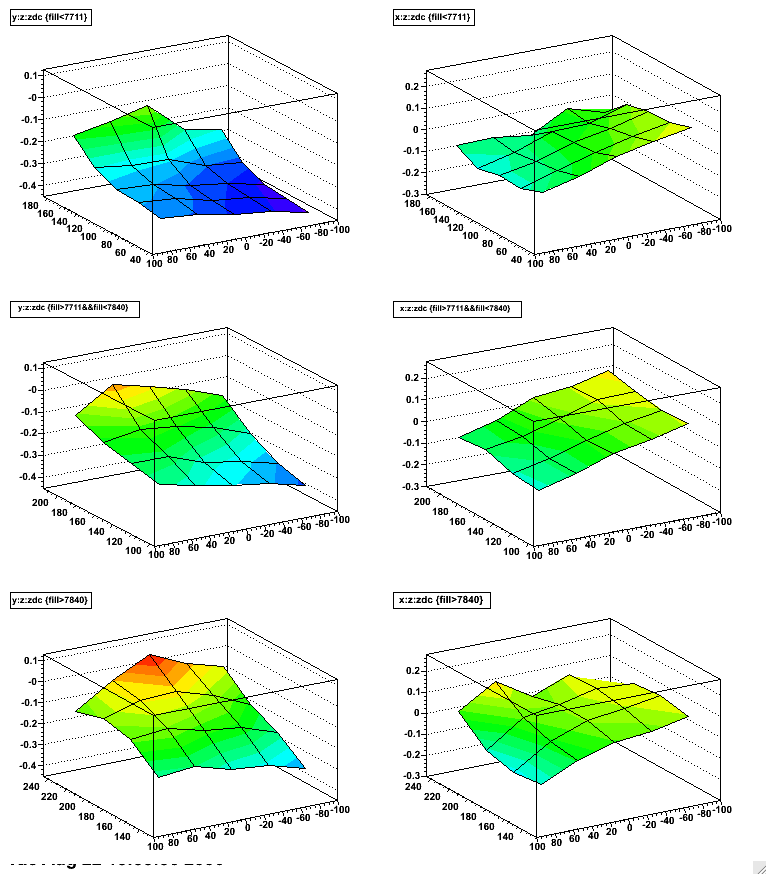
The above plots make it more clear that all three periods appear to have a z dependence to their y vs. z profiles at the highest luminosities recorded during those periods (NOTE: luminosities may actually extend both higher and lower than the plot axes, but have insufficient statistics to add appreciable information to the plots and have been cropped).
DISCUSSION:
The z dependence of the reconstructed vertices at high luminosity is a red flag that this is likely to be a distortion issue in the TPC (e.g. SpaceCharge whose distortion is largest for tracks near the central membrane). A hypothesis is that this is the old issue of particles going through just one side of the TPC from some kind of beam background. An interesting question is where the background must be to produce this effect. Azimuthally symmetric SpaceCharge (in full field data, not reveresed full field) causes tracks at positive x to want a vertex which is higher vertically, while tracks at negative x want a lower vertex; the effects should cancel. In order to raise the vertical position of the primary vertex, there would either need to be more of the standard SpaceCharge distribution at positive x (3 o'clock in the TPC), or a buildup of ionization only at either low radius (near the IFC) or large radius (near the OFC) at negative x (9 o'clock in the TPC). The former would mean simply an increased rotation of tracks at positive x due to the standard SpaceCharge distribution. The latter would actually be a decrease in the rotation of tracks at negative x, thereby failing to fully counter the effects of SpaceCharge at positive x. There could also be any combination of these three:
The third possibility may be the most intriguing as it may most closely match the backgrounds which have been documented in the past. It should also be stated clearly that reality could be a combination of a distortion and real shifts in the beam position as delivered by the collider. We want to correct for any of the former, and measure/calibrate any of the latter.
_________
As supplementary information, here are the z distributions ("profs" - spread profile) of vertices as a function of zdc in periods I, II, and III, showing that althought the mean position changes somewhat with run period, the distribution is rather stable as a function of zdc.
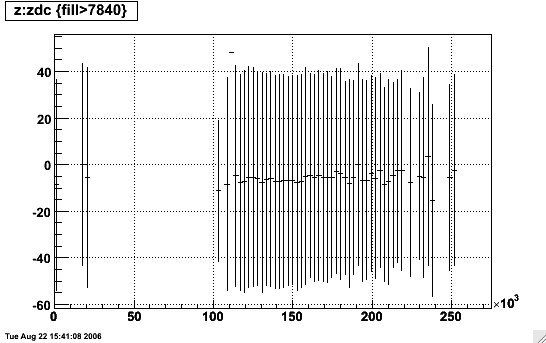
In order to get the zdc information, I averaged all zdc values of each run to use a a single value for each run. I plot here the average for each day just for demonstration.
I will focus only on the 200 GeV running for now (periods I-III, up to day 157).
The first thing I looked at was my calibrated y-intercept of the beamline constraint vs. zdc and zdc vs. fill number (which is pretty similar to the above plot), where zdc is averaged by Sum{zdc[run] * N_verts[run]} / N_verts[all]. In these plots, the color represents the run period: blue=I, red=II, black=III:
It is clear from these plots that there IS some correlation between y and zdc rate for all three periods. The first period also shows a strong correlation between zdc rate and fill (the RHIC luminosity was increasing as time progressed, and the luminosity plateaued for subsequent running). This information by itself is not enough to say whether there is a distortion in the TPC; it could simply mean that there is a correlation between how much luminosity the collider delivers and the vertical position of the beam, which is not all that unlikely.
To investigate further, I created an ntuple with all the vertices used in the beamline calibrations and stored the fill number and zdc rate for each reconstructed vertex. Normally, the beamline is found by simply projecting the vertex positions onto plots of y vs. z, and x vs. z and fitting straight lines. But now I can plot differentially vs. zdc or fill, as I have done in the next 4 plots. In each plot, a single slice in zdc is a profile of y vs. z or x vs. z. The plots have z of the reconstructed vertices on the lower right horizontal axis, zdc rate divided by 1000 (or fill number ) on the lower left horizontal axis, and the profile of y for the vertical axis, and the scales are held identical for all four plots.
For some idea of the errors on these data, here is the error plot for the y:z:zdc plot (the x:z:zdc errors are nearly identical):
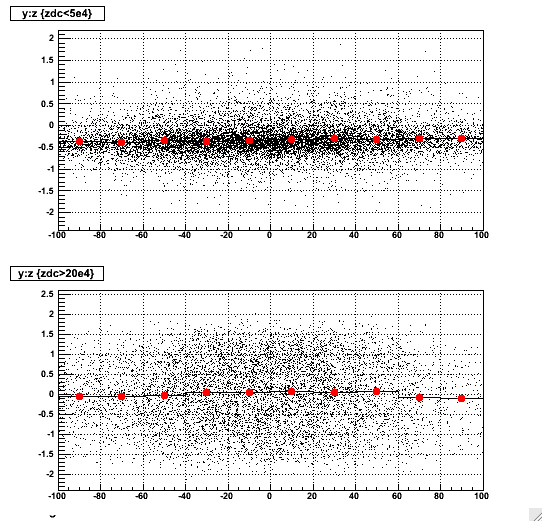
Here is another plot of the the y vs. z data and its profile for low and high zdc rates where one can gain some perspective on the true spread of the data and the scale of the profile relative to it.
These plots show several points:
- x vs. z has essentially no dependence on fill, and has perhaps a small correlation with zdc
- y vs. z looks nicely linear at the lowest luminosities (which also correspond to the earliest fills)
- y vs. z shows a mild increase with early fill numbers, but not as clear a correlation with later fills
- y vs. z shows a dramatic increase with zdc rate
- y vs. z shows a modification from linearity with zdc rate, appearing to bulge at z values near the center of the TPC
These plots possibly suffer to some degree from overlapping different run periods where different beam tunes were actually quite likely (the trade off is that they get improved statistics). So the next set of plots show y and x vs. zdc by period (arranged as periods I, II, III from top to bottom):
The above plots make it more clear that all three periods appear to have a z dependence to their y vs. z profiles at the highest luminosities recorded during those periods (NOTE: luminosities may actually extend both higher and lower than the plot axes, but have insufficient statistics to add appreciable information to the plots and have been cropped).
DISCUSSION:
The z dependence of the reconstructed vertices at high luminosity is a red flag that this is likely to be a distortion issue in the TPC (e.g. SpaceCharge whose distortion is largest for tracks near the central membrane). A hypothesis is that this is the old issue of particles going through just one side of the TPC from some kind of beam background. An interesting question is where the background must be to produce this effect. Azimuthally symmetric SpaceCharge (in full field data, not reveresed full field) causes tracks at positive x to want a vertex which is higher vertically, while tracks at negative x want a lower vertex; the effects should cancel. In order to raise the vertical position of the primary vertex, there would either need to be more of the standard SpaceCharge distribution at positive x (3 o'clock in the TPC), or a buildup of ionization only at either low radius (near the IFC) or large radius (near the OFC) at negative x (9 o'clock in the TPC). The former would mean simply an increased rotation of tracks at positive x due to the standard SpaceCharge distribution. The latter would actually be a decrease in the rotation of tracks at negative x, thereby failing to fully counter the effects of SpaceCharge at positive x. There could also be any combination of these three:
The third possibility may be the most intriguing as it may most closely match the backgrounds which have been documented in the past. It should also be stated clearly that reality could be a combination of a distortion and real shifts in the beam position as delivered by the collider. We want to correct for any of the former, and measure/calibrate any of the latter.
_________
As supplementary information, here are the z distributions ("profs" - spread profile) of vertices as a function of zdc in periods I, II, and III, showing that althought the mean position changes somewhat with run period, the distribution is rather stable as a function of zdc.
Update on 2006 issues
FINDINGS:
BeamLine position does move with SpaceCharge(+GridLeak) correction. Here I plot the BeamLine constraint as a function of turning on the SpaceCharge correction 10% at a time:
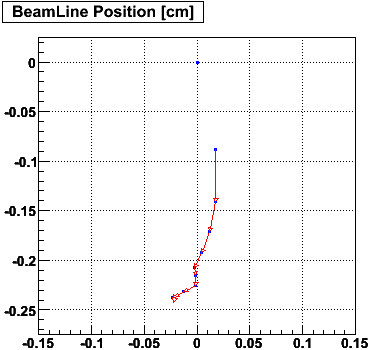
The cause appears to be the Minuit Vertex Finder exhibiting something like a (x,y) = (0,0) bias which gets worse when the distortion corrections are not proper. To demonstrate this, I plot the beamline position as reconstructed using SpaceCharge,GridLeak,ShortedRing-corrected data (left) and uncorrected data (right). The center point in each plot is the "as-is" reconstructed beamline x and y intercepts. I shift all the hits in the TPC by +/-0,1,2 mm in x and y and re-calibrated the BeamLine for each shift. The blue dots represent those shifts given to the TPC hits, while the arrowheads point at the value that comes from the calibration for the respective shifts. Some bias appears to remain even with the calibrations in place, but the bias is clearly stronger for uncorrected data.
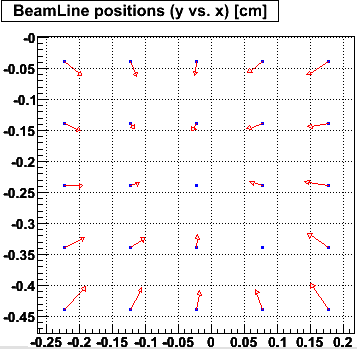
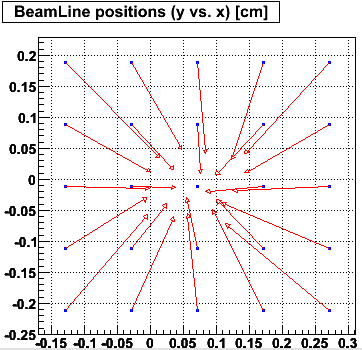
In this case, the uncorrected data is actually using calibrations as they were in June when the BeamLine calibration was originally done: no SpaceCharge, and only a partial Shorted Ring correction.
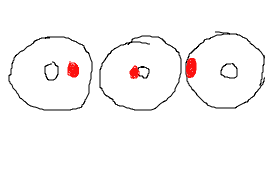
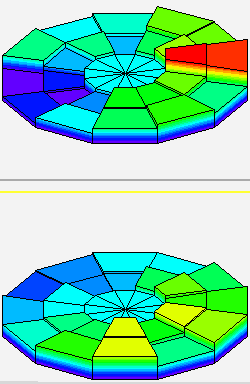
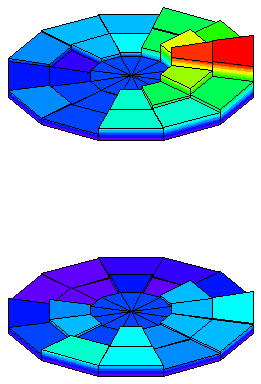
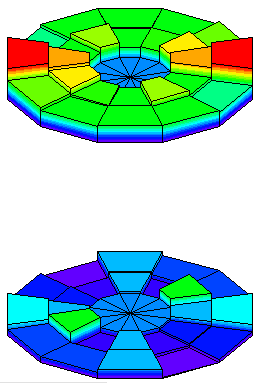
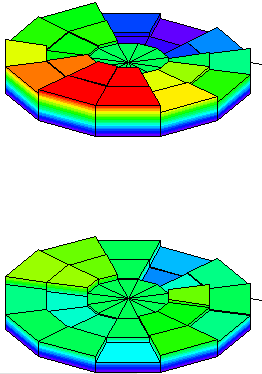
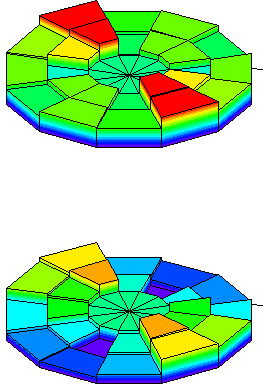
A few more things can be learned from the data by excluding sections of the TPC. In these plots, I show sector positions as they are in the TPC, divided into 12 supersectors with inner (padrows 1-12) and outer (padrows 14-45) subsectors. Each bin then represents the y-intercept of the beamline when I EXCLUDE the vertices which have any tracks passing through that part of the TPC. I include in text below the plot the y-intercepts for the minimum and maximum shown in the plots, and for the FULL TPC (not excluding any vertices). I can exclude some sectors simultaneously too. EAST IS ON TOP, WEST IS ON BOTTOM (unless I tied east and west exclusion together, so I only show one plot). The disc in the center of each plot represents the FULL TPC position for comparison.
First, using the corrections as they were in June, one can clearly see the effect caused by uncorrected SpaceCharge:
| Uncorrected | July corrections | August corrections | 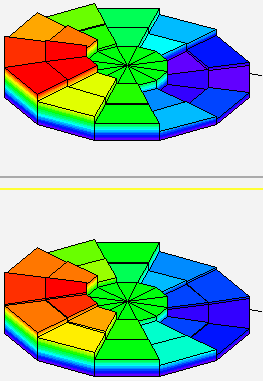 |
 |
 |
Full TPC y = -0.060040 +/- 0.009377 Minimum y = -0.179608 Maximum y = 0.056453 |
Full TPC y = -0.266030 +/- 0.004800 Minimum y = -0.276851 Maximum y = -0.245626 |
Full TPC y = -0.259742 +/- 0.002232 Minimum y = -0.263649 Maximum y = -0.241834 |
|---|
In FullField data like this, SpaceCharge makes tracks rotate clockwise when viewed along the positive axis. So SpaceCharge-distorted tracks at positive x tend to want a higher vertex position, while ones at negative x want a lower vertex position. Therefore, excluding vertices which use tracks at positive x from uncorrected data will effectively lower the average vertex position, and vice versa for negative x. The uncorrected data is dominated by SpaceCharge, so both halves of the TPC look pretty much the same.
With Shorted Ring and SpaceCharge corrections as they were in July (SpaceCharge calibration had been done without the final Shorted Ring corrections), one can see that we were probably slightly over-correcting for this data, but not by much as the minimum and maximum were both within ~300 microns of using the whole TPC.
With the SpaceCharge+GridLeak re-calibrated using the final Shorted Ring corrections in place, the fully corrected plot now appears as in the August-corrections column above. The max-min diff has gone from 310 microns to 220 microns! And the west tpc (bottom) looks essentially flat: there is no distortion apparent in the beamline from the west TPC! The east still shows some remnant distortion. This could be due to either more SpaceCharge in the east than west, or due to not-quite-complete corrections of the shorted ring in the east TPC. Either explanation is viable.
These graphs also demonstrate that there is unlikely to be much contribution from misalignment of TPC (sub)sectors.
We can remove azimuthally symmetric distortions like our standard SpaceCharge+GridLeak and the Shorted Ring by tying together (excluding at the same time) opposing (in phi) subsectors of the TPC:
Full TPC y = -0.259742 +/- 0.002232
Minimum y = -0.263744
Maximum y = -0.243980
Here I think it is of interest to notice that the major cause for altered beamline in the east TPC is from the outer subsectors at 3 and 9 o'clock. Shorted ring distortions are primarily an inner sector effect and should not show up in this plot anyhow. This means that it is more likely to be due to additional ionization in the east TPC over the west.
We can also analyze the horizontal determination of the beamline.
Full TPC x = -0.009712 +/- 0.002242
Minimum x = -0.018511
Maximum x = 0.000031
Again, more distortions in the east TPC. Overall max-min diff here is only 185 microns! It's curious that this is not symetric about 6 and 12 o'clock. Tying opposing subsectors shows something else:
Full TPC x = -0.009712 +/- 0.002242
Minimum x = -0.015330
Maximum x = -0.002258
Both the east and west show something at 5 and/or 10 o'clock (and a bit at 4/10) contributing (minutely - were talking on the order of below 100 microns) to the horizontal position of the beam.