GridLeak Studies
- Review of GridLeak at 2013-03-01 iTPC discussions
Floating Grid Wire Studies
Distortions in TPC data (track residuals) are seen in 2004-2006 data which are hypothesized to come from a floating Gating Grid wire. Notes from a meeting of TPC experts regarding the topic held in October 2006 can be found here.See PPT attachment for simulations of floating grid wires from Nikolai Smirnov which show that the data is consistent with two floating -190V wires in sector 8, and two floating -40V wires in sector 3 (all wires are at -115V when the grid is "open").
GridLeak Distortion Maps
Using the code in StMagUtilities, these are maps of the GridLeak distortion.
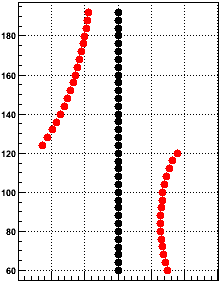
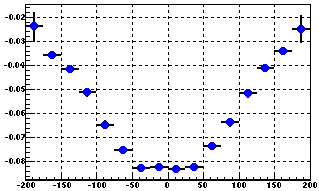
First, this is a basic plot of the distortion on a series of hits going straight up the middle of a sector (black: original hits; red: distorted hits). The vertical axis is distance from the center of the TPC (local Y) [cm], and the horizontal axis is distance from the line along the center of the sector (local X). Units are not shown on the horizontal axis because the magnitude of the distortion is dependence on the GridLeak ion charge density, which is variable.
The scale of the above plot is deceptive in not showing that there is some distortion in the radial direction as well as the r-phi direction. The next pair of plots show a map of the distortion [arb. units] in the direction orthogonal to padrows (left) and along the padrows (right) versus local Y and angle from the line going up the center of the sector (local φ) [degrees].
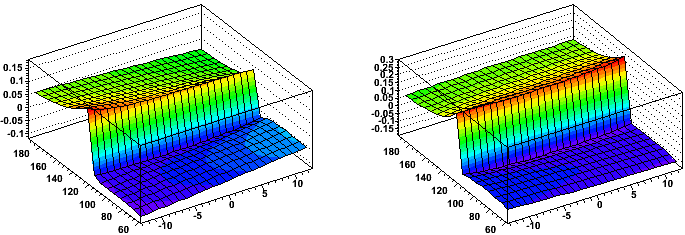
One can see that the distortion is on the order of x2 larger along the padrows than orthogonal to the padrows. Also, it is clear that there is a small variance in magnitude of the distortion across the face of the sectors.
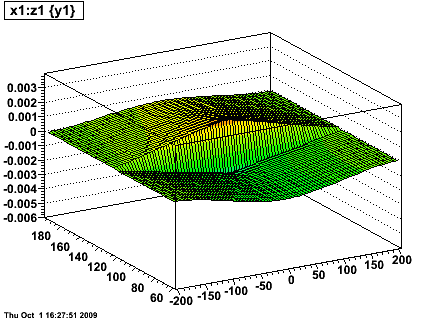
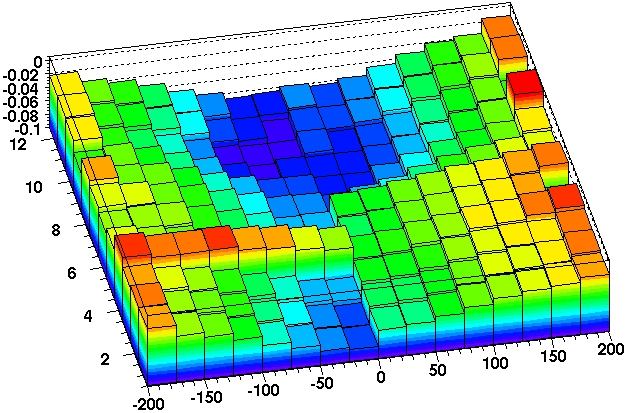
The next plot shows the magnitude of the distortion [arb. units] along the padrow at the middle of the sectors vs. local Y [cm] and global Z [cm]. The distortion is largest near the central membrane (Z=0) and goes to zero at the endcaps (|Z| ≅ 205 cm), with a linear Z dependence in between, which flattens off at the central membrane and endcap due to boundary conditions that the perturbative potentials are due to charge in the volume and are constrained to zero at these surfaces.
GridLeak Simulations
Nikolai Smirnov & Alexei Lebedev:Data for STAR TPC supersector. 05.05.2005 07.11.2005 Jon Wirth, who build all sectors provide these data. Gated Grid Wires: 0.075mm Be Cu, Au plated, spacing 1mm Outer Sector 689 wires, Inner Sector 681 wires. Total 1370 wires per sector Cathode Grid Wires: 0.075mm Be Cu, Au plated, spacing 1mm Outer Sector 689 wires, Inner Sector 681 wires. Total 1370 wires per sector Anode Grid Wires:0.020mm W, Au plated, spacing 4mm Outer Sector 170 wires, Inner Sector 168 wires. Total 338 wires per sector Last Anode Wires: 0.125mm Be Cu, Au plated Outer Sector 2 wires, Inner Sector 2 wires. Total 4 wires per sector
We are most interested in the gap between Inner and Outer sector, where ion leak is important for space charge. On fig. 1 wires set is shown. The distance between inner and outer gating grid is 16.00 mm. When Grid Gate is closed, the border wires in Inner and Outer sectors have -40V, each next wire have -190V and after this pattern preserved in whole sector - see fig. 2. When gating grid is open, each wire in gating grid have the same potential -115V. Above grid plane we have a drift volume with E~134V/cm to move electrons from tracks to sectors and repulse ions to central membrane. Cathode plane has zero voltage, while anode wires for outer sector holds +1390V and for inner sector +1170V.

Fig. 1. Wire structure between Inner and Outer sector.

Fig.2 Voltages applied to Gating Grid with grid closed.
Another configurations of voltages on gating grid wires are presented on fig.3. All these voltages are possible by changing wire connections in gating grid driver. Garfield simulations should be performed for all to find a minimum ion leak.

Fig.3 Different voltages on closed gating grid (top: inverted, bottom: mixed).
This is a key for Nikolai's files: there are 4 sets of files in each set there is simulation for Gating Grid voltages on last wires. Additionally he artificially put a ground shield on the level of cathode plane and simulated collection for last-thick anode wire and also ground shield and last thin anode wire.
| Setups: | Standard | Inverted | Mixed | Ground Strip | Ground Strip and Wire |
|---|---|---|---|---|---|
| Equipotentials | PS |
PS |
PS |
PS |
PS |
| Electron paths | PS |
PS |
PS |
PS |
PS |
| Ion paths (inner sector) |
PS |
PS |
PS |
PS |
PS |
| Ion paths (outer sector) |
PS |
PS |
PS |
PS |
PS |
GridLeak: Gain Study
In February 2005, Blair took some special runs with altered TPC gains so we could study the effect on the GridLeak distortion. What is shown in the following plots is the distortion (represented by the profile of residuals at padrows 12 and 14, which amounts to 0.5 * [residual at padrow 12 + residual at padrow 14]) as a function of Z in the TPC. Black points are the distortions from sectors 7-24, and red are 1-6, which are the sectors where the TPC gain was reduced. I have chosen as labels "Norm", "Half", and "Low" for these three conditions of no gain change, half gain change on the inner pads only, and half gain change on both inner and outer.
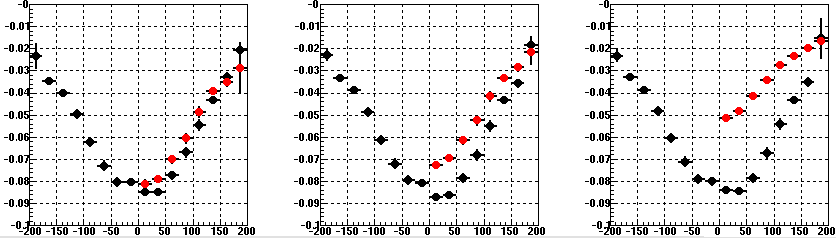
First note: the ever-present problem that our model goes to zero distortion at the endcaps, while the measured distortions do not appear to do so (though the distortion curves should flatten out [as seen in the above plots] as a function of Z near the endcap and central membrane due to boundary conditions on the fields in the TPC).
Second note: I have not excluded sector 20 from these plots, which is partly to explain why the east half (z<0) has slightly less distortions than the west in these profile plots. In reality, east and west were about even for a normal run (distortions excluding sector 20).
Here is the z-phi plot for Low (it's almost difficult to see the distortion reduction in the z-phi (in "o'clock") plot for Half):
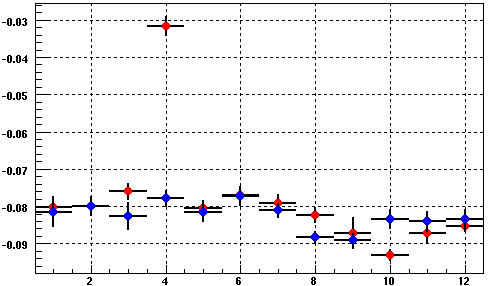
Third note: (though not too important for this study because we generally ignore east/west comparisons) the sectors between 1-6 o'clock already tend to show somewhat less distortion than the sectors at 7-12 o'clock, and because it is true on both halves of the TPC, it is more likely to be due SpaceCharge azimuthal anisotropy than asymmetries in the endplanes. Here are the distortions at |z|<50 for east (red) and west (blue) as a function of phi in "o'clock" where one can see the already present asymmetry, explaining why sectors 1-6 are already less distorted in the Norm run than sectors 7-12:
We have to normalize to sectors 7-12 to see the drop in distortions as it the runs are taken at different times when the luminosity of the machine, and therefore the distortion normalizations, are different. Here are the ratios from sectors 1-6 / sectors 7-12:

And the double ratios to see the drop in the Half and Low runs w.r.t. the Norm run:
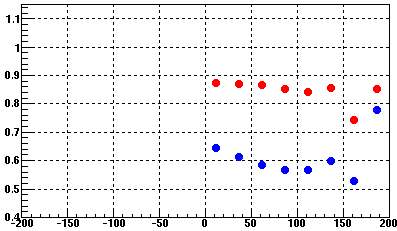
These plots show ratios in the Z = 25-150cm range of about 0.86 and 0.59 respectively, or reductions of about 14% and 41% give or take a few percentage points. Data beyond 150cm tends to be poor and there's little reason to believe that the ratio really changes by much there. However, there does appear to be some shape to the data, which is not understood at this time.
Another way to calculate the difference in distortions is to take a linear fit to the slope of the distortions between z = 25-150cm. Those fit slopes are:
Low:
1-6: 0.000250 +/- 0.000019
7-12: 0.000420 +/- 0.000024
Half:
1-6: 0.000365 +/- 0.000023
7-12: 0.000433 +/- 0.000025
Norm:
1-6: 0.000401 +/- 0.000024
7-12: 0.000422 +/- 0.000023
Again, we need the ratio of ratios:
[Half(1-6)/Half(7-12)] / [(Norm(1-6)/Norm(7-12)] = 0.89+/-0.11 (12%)
[Low(1-6)/Low(7-12)] / [(Norm(1-6)/Norm(7-12)] = 0.63+/-0.08 (12%)
Inner reduction = (11 +/- 11)%
Outer reduction = (26 +/- 11)%
Total reduction = (37 +/- 8)%
These numbers are smaller than the reductions indicate by the above plot of double ratios of the distortions themselves. This likely reflects the errors in fitting the slopes. In that sense, the plot values may be more accurate. We need not worry in this study about getting the reduction numbers exact, but it is perhaps accurate enough to say that the inner sector gain drop reduces the distortion by about 13%, and the outer sector gain drop reduces it further by about 27% (about twice as much as the inner) from the original distortion. It is clear that both inner and outer TPC sectors contribute to the distortion, and that the outer TPC contributes significantly more to the distortion. If hardware improvements can only be implemented for either the inner or outer, then the outer is the optimal choice in this respect. It is not obvious offhand whether this is consistent with the GridLeak Simulations which we have done so far for these ion leaks.