Run 5 BTOW Calibration
Introduction
The final BTOW calibration for Run 5 offers the following improvements over previous database calibrations:
- recovery of 194 swapped towers
- identification and exclusion of 51 towers with correlated firing problems
- identification and exclusion of 33 towers with p/E~0.6
- exclusion of 58 towers with PMTs replaced by Stephen and Oleg during the shutdown
- isolation cut removes background from MIP spectra, identifies correlated towers
- 30 cm vertex cut introduced to reduce path length differences among MIPs
- uniform scale factor (1.04613) introduced after eta ring electron normalization to set E/p==1 when integrated over all towers


p0 = 0.00696912 for the fit parameter implies an <ET> = 28.3 GeV on the west side, but the gains do not seem to be well described by the 1/sin(theta) fit
3997/4240 = 94.3% of commissioned towers have nonzero gains
Procedure
The offline calibration of the BEMC towers for Run 5 is accomplished in three steps. In the first step, MIPs are collected for each tower and their pedestal-subtracted ADC spectra are plotted. The MPV of the distribution for each tower is translated into a gain using an equation originally established by test-beam data (SN 0433). In the second step, electrons are collected for each eta-ring and the ratio of their momentum and energy (with the energy calculated using the MIP gains from step 1) is plotted as a function of the distance between the track and the center of the tower. The calculated curve is fit to a GEANT simulation curve, allowing extraction of scale factors for the MIP gains in each eta ring. Finally, electrons in all eta-rings that pass through the center of a tower are grouped together and the ratio of their energy and momentum (E/p) is plotted, using the energy calculated from the rescaled gains in the second step. The ditribution is fit with a Gaussian and a scale factor is applied so that this Gaussian is centered exactly on 1.000.
Catalog query:
<input URL="catalog:star.bnl.gov?production=P05if,tpc=1,emc=1, trgsetupname=ppProduction||ppTransProduction||ppProductionMinBias, filename~st_physics,filetype=daq_reco_mudst,storage!~HPSS" nFiles="all" />Working directories:
/star/u/kocolosk/emc/offline_tower_calibration/2005/feb08_2005/
/star/u/kocolosk/emc/offline_tower_calibration/2005/feb08_earlyfiles/
The 2005 directory contains jobs run using Dave Relyea's offline pedestals (the bulk of the data), while the earlyfiles directory uses online pedestals for runs before April 26th that are not included in the offline pedestal calculations.
MIP Cuts:
- track momentum > 1
- track enters, exits same tower
- 1 track / tower
- (ADC - ped) > 2*pedRMS
- abs(z-vertex) < 30
- isolation cut (all neighboring towers satisfy (ADC-ped) < 2*pedRMS)
- no trigger selection (previous statement of mb-only triggers was in error)
Electron Cuts:
- 1.5 < track momentum < 20
- track enters, exits same tower
- 1 track / tower
- # track points > 25
- 3.5 < dEdx < 4.5 keV/cm
- (ADC - ped) > 2*pedRMS
- no trigger selection
For More Information:
Detailed information on this and other BTOW calibrations, including tower-by-tower MIP and p/E spectra and a summary of outstanding issues, is available at
http://www.star.bnl.gov/protected/spin/kocolosk/barrel_calibration/saved_tables/
The calibration summarized here has the timestamp 20050101.000001.
First Calibration using CuCu data
Runs used: 6013134 (13 Jan) - 6081062 (22 Mar)
The procedure for performing the relative calibration can be divided into 3 steps:
- Create a histogram of the pedestal-subtracted ADC values for minimum-ionizing particles in each tower
- Identify the working towers (those with a clearly identifiable MIP-peak)
- Use the peak of each histogram together with the location of the tower in eta to calculate a new gain
- Create new gain tables and rerun the data, this time looking for electrons
- Use the electrons to establish an absolute energy scale for each eta-ring
Using Mike's code from the calibration of the 2004 data, an executable was created to run over the 62GeV CuCu data from Run 5, produce the 2400 histograms, and calculate a new gain for each tower. It was necessary to check these histograms by hand to identify the working towers. The output of the executable is available as a 200 page PDF file:
2005_mip_spec.pdf (2400 towers - 21.6 MB)
Towers marked red or yellow are excluded from the calibration. Condensed PDFs of the excluded towers are available at the bottom of the page ("bad" and "weird"). In all, we have included 2212 / 2400 = 92% of the towers in the calibration.
Systematic Behavior of the Gains
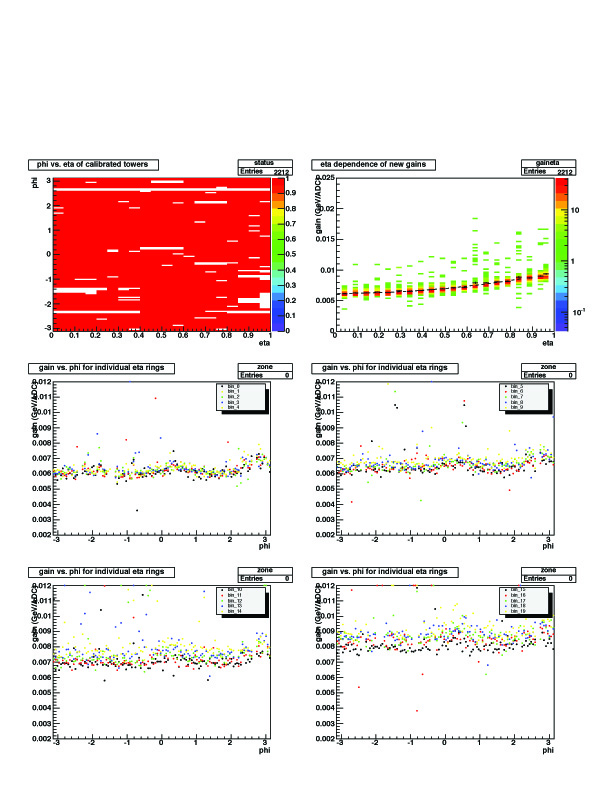
The first plot in the top left shows the excluded towers (white blocks) in eta_phi space
In the second plot we collect the towers into 20 eta-rings (delta-eta = 0.05) and look at the change in gain as we move out in eta. This plot shows the expected increase in gain as we move into the forward region (except for eta-rings 19 and 20).
Finally we look at each individual eta-ring for for systematic variations in azimuth. There appears to be some structure around phi=0.2 and phi=3.
Electron Calibration Status
We have made an attempt to realize the absolute energy scales using electrons. Unfortunately, there does not appear to be a sufficient number of electrons in the processed 62GeV data to do this for each eta-ring. We will revisit this later when more statistics are available, but in the meantime we have established the following workaround:
- Fit the average gains of the first 17 eta-rings with a function that goes as 1/sin(theta)
- Caclulate the expected gains for eta-rings 18, 19, and 20 from this function
- Scale the forward eta-rings accordingly
The results of this procedure are seen in an updated plot of gain vs. eta:
Here are new bemcCalib and bemcStatus .root files created using these rescaled gains:
bemcCalib.20050113.053235.root
bemcStatus.20050113.053235.root
The text file is a list of tower-gain pairs. A gain of zero indicates a tower that has been masked out. Finally, we have a plot of p/E summed over all eta:

Update: Addition of the East BEMC Towers
We have calculated new gains for the 1200 towers in the east half of the barrel that were turned on by March 22. Only data from March 22 were used in this calibration. The results can be found in 2005_mip_spec_newtowers.pdf
bemcCalib.20050322.000000.root
bemcStatus.20050322.000000.root
The gains for towers 1-2400 are the same as before. These files include those entries, as well as new gains for towers 2401-4800. No attempt has been made to get an absolute energy scale for the east towers, so we still see the drop in gain for large eta:

Implementation of Tower Isolation Cut
Originally posted 11 October 2005
Previously we had calibrated the BEMC using data from all triggers. We now have enough data to restrict ourselves to minimum-bias triggers. Additionally, we have implemented a cut that requires the pedestal-subtracted ADC value of neighboring towers to be less than twice the width of the pedestal. This cut does an excellent job of removing background, especially in the high-eta region:
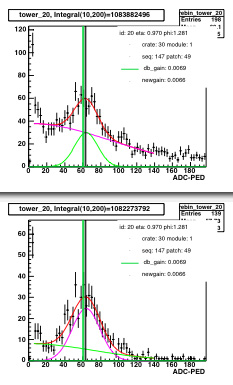
The cut is used in the bottom plot. Unfortunately there is also a small subset of towers where the isolation cut breaks the calibration:
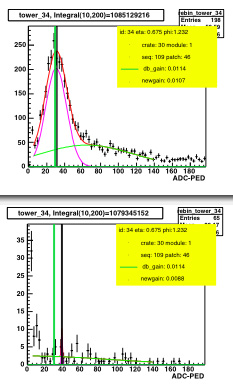
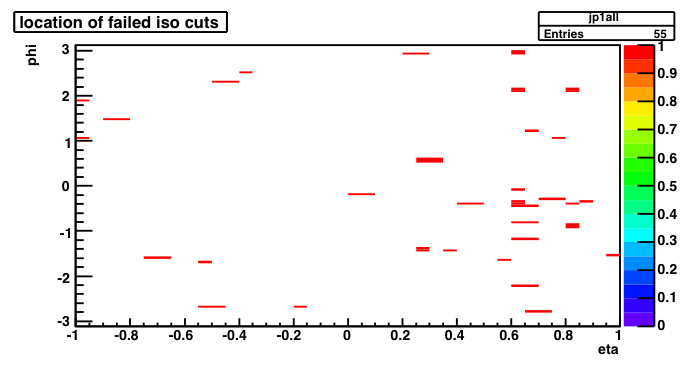
Again the cut is used in the bottom plot. We have decided to use the isolation cut when possible, and use the full minimum-bias data in the case of the (55) towers for which the cut breaks the calibration. This new calibration is able to recover ~30 towers that were previously too noisy to calibrate. We are in the process of reviewing the remaining bad towers found in 2005_MinBiasBadTowers.pdf. Towers 671,1612, and 4672 appear to have problems with stuck bits in the electronics, and there are a few other strange towers, but the majority of these towers just seem to have gains that are far too high. We plan on reviewing the HV settings for these towers. An ASCII file of the bad towers is attached below.
Recalibration Using pp data
Originally posted 26 September 2005
Catalog query:
input URL="catalog:star.bnl.gov?production=P05if,tpc=1,emc=1,trgsetupname=ppProduction,filename~st_physics,filetype=daq_reco_mudst,storage=NFS" nFiles="all"
note: 3915/4240 = 92.3% of the available towers were able to be used in the calibration. Lists of bad/weird towers in the pp run are available by tower id:
bad_towers_20050914.txt
weirdtowers_20050914.txt
The relative calibration procedure for pp data is identical to the procedure we used to calibrate the barrel with CuCu data (described below). The difference between pp and CuCu lies in the electron calibration. In the pp data we were able to collect enough electrons on the west side to get an absolute calibration. On the east side we used the procedure that we had done for the west side in CuCu. We used a function that goes like 1/sin(theta) to fit the first 17 eta rings, extrapolated this function to the last three eta rings, and calculated the scale factors that we should get in that region. Here is a summary plot comparing the cucu and pp calibrations for the 2005 run:

Comparing the first two plots, one notices immediately that many of the pp gains on the east (eta < 0) side are quite high. A glance at the last plot on the summary canvas reveals a collection of towers with phi < -pi/2 that have unusually high gains. These towers were added during the pp run and hence their gains are based on nominal HV values without any iteration (thanks Mike, Stephen). If we mask out those towers in the summary plot, the plots look much more balanced:

The bottom plot clearly shows that the final pp gains are ~10% higher than the gains established from the mip calibration using the cucu data. Moreover, the cucu data closely follows a 1/sin(theta) curve, while the curve through the pp data is flatter. This is revealed in the shape of the bottom plot. Note that we never scaled the gains near eta=-1 for the cucu data, which is why there is still a significant drop-off in the ratio of the mean gains in that region.
New calibration and status tables (including the gains for the new towers that were turned on during pp running) are available at
bemcCalib.20050322.000001.root
bemcStatus.20050322.000001.root
It should be noted that the scale factors we used to get the final gains near eta=-1 on the east side were calculated without the new towers since they were throwing off the fit function. However, those new towers still had their final gains scaled before we produced the calibration and status tables.
Systematic Uncertainty Studies
In the 2003+2004 jet cross section and A_LL paper we quoted a 5% systematic uncertainty on the absolute BTOW calibration. For the 2005 jet A_LL paper there is some interest in reducing the size of this systematic.I went back to the electron ntuple used to set the absolute gains and started making some additional plots. Here's an investigation of E_{tower} / p_{track} versus track momentum. I only included tracks passing directly through the center of the tower (R<0.003) where the correction from shower leakage is effectively zero.
Full set of electron cuts (overall momentum acceptance 1.5 < p < 20.):
dedx>3.5 && dedx<4.5 && status==1 && np>25 && adc>2*rms && r<0.003 && id<2401
I forgot to impose a vertex constraint on these posted plots, but when I did require |vz| < 30 the central values didn't really move at all.
Here are the individual slices in track momentum used to obtain the points on that plot:

Electrons with momentum up to 20 GeV were accepted in the original sample, but there are only ~300 of them above 6 GeV and the distribution is actually rather ugly. Integrating over the full momentum range yields a E/p measurement of 0.9978 +- 0.0023, but as you can see the contributions from invididual momentum slices scatter around 1.0 by as much as 4.5%
Next Steps? -- I'm thinking of slicing versus eta and maybe R (distance from center of tower).